. 2018 Feb 27;8(1):3680.
doi: 10.1038/s41598-018-22109-y.

Role and regulation of growth plate vascularization during coupling with osteogenesis in tibial dyschondroplasia of chickens

Affiliations

Role and regulation of growth plate vascularization during coupling with osteogenesis in tibial dyschondroplasia of chickens

Shu-Cheng Huang et al. Sci Rep. .

Abstract

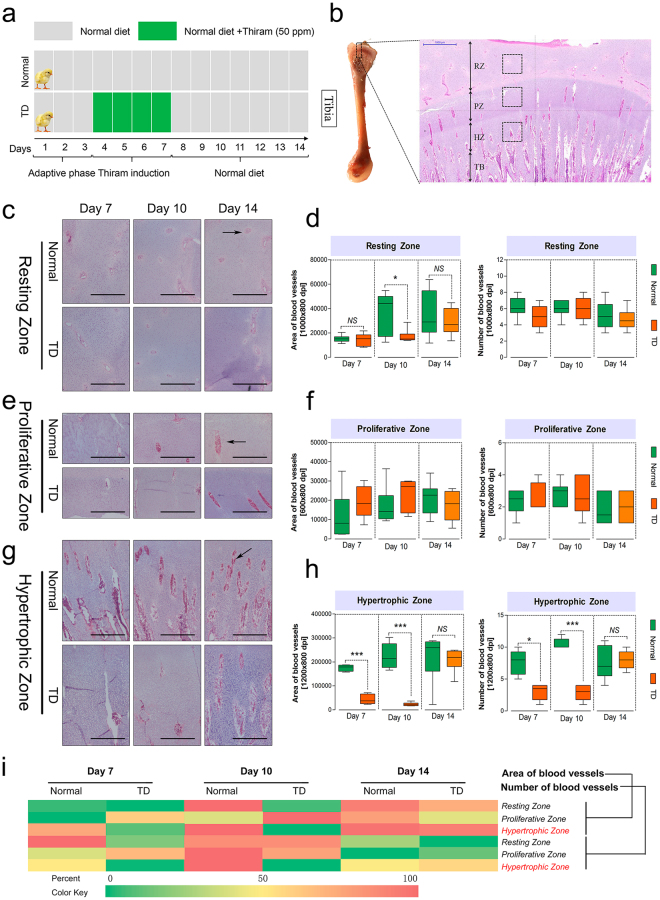
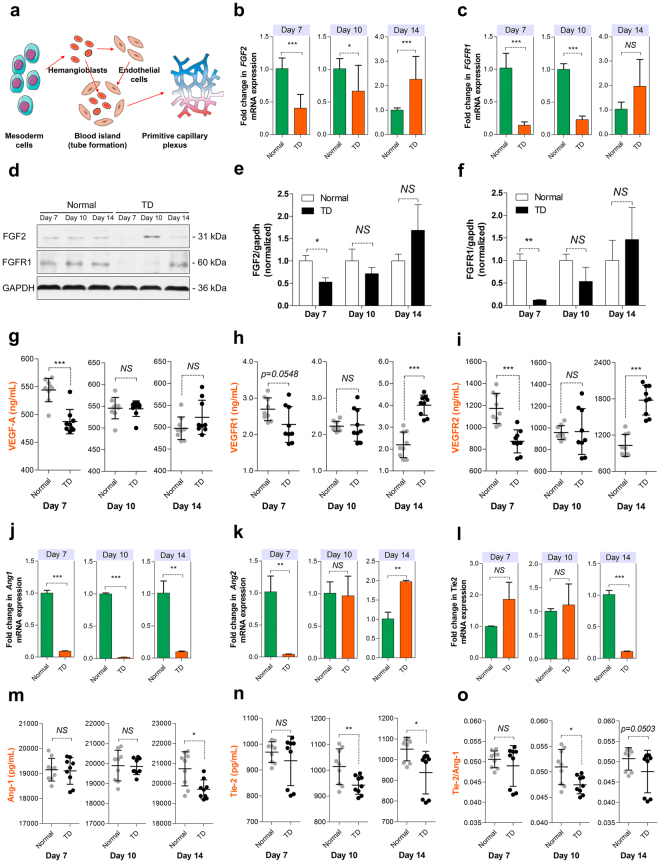
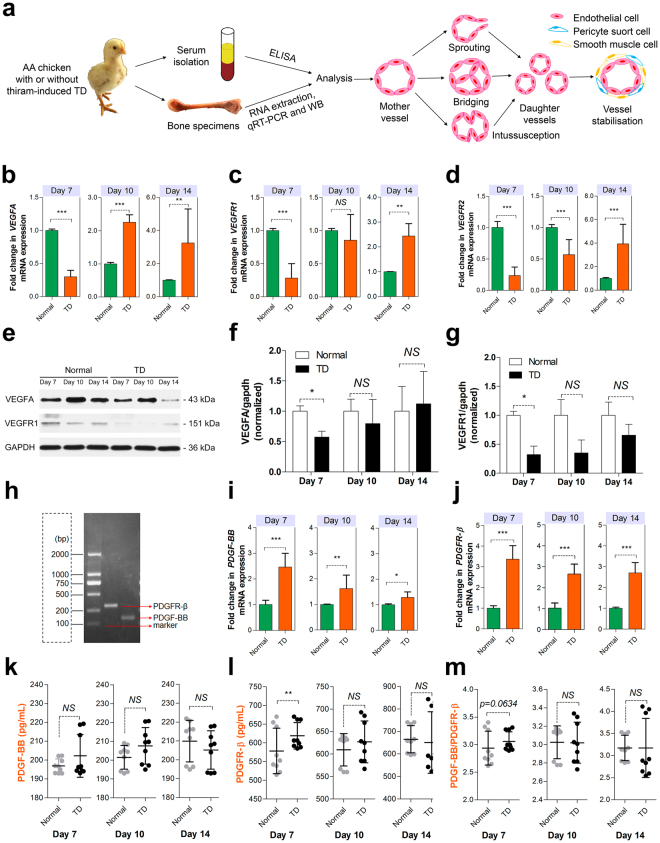
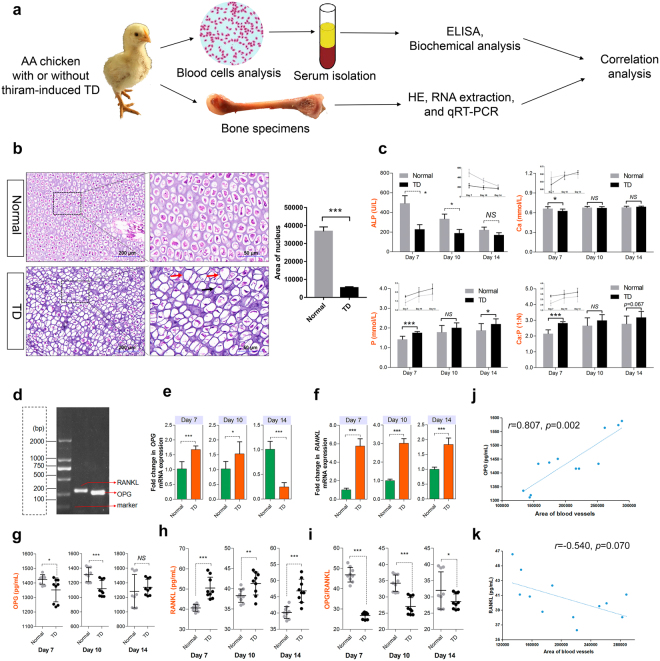
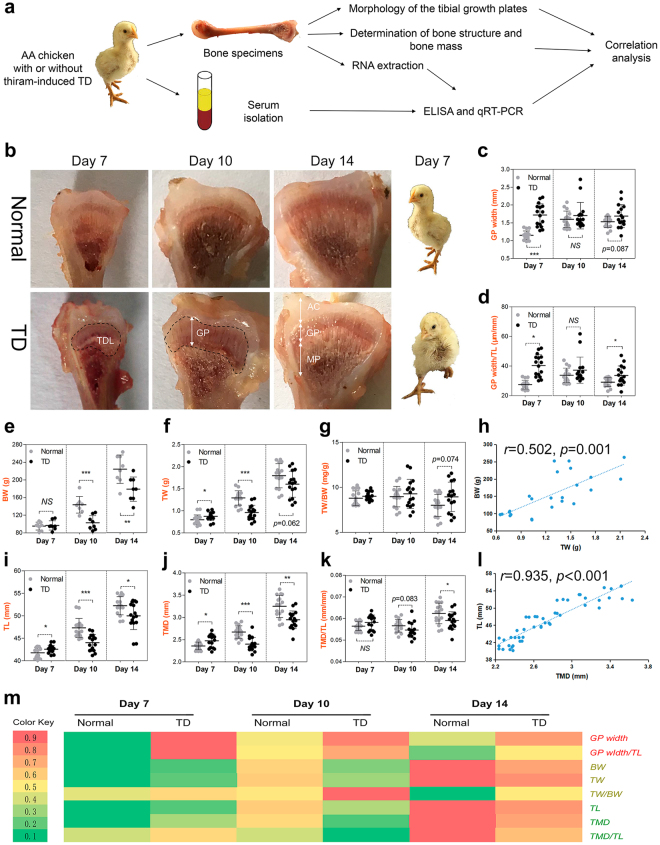
Tibial dyschondroplasia (TD) is the most-prevalent leg disorder in fast-growing chickens; it is intractable and characterized by abnormal endochondral bone formation of proximal tibial growth-plates (TGPs). Previous studies have shown that bone is a highly vascularized tissue dependent on the coordinated coupling between angiogenesis and osteogenesis, but the underlying mechanisms of bone formation and bone remodeling are poorly defined in TD chickens. Here, we observed that inhibition of vasculogenesis and angiogenesis remarkably impaired vascular invasion in the hypertrophic chondrocyte zone of the TGPs, resulting in the massive death of chondrocytes due to a shortage of blood vessels and nutrients. Moreover, the balance of the OPG (osteoprotegerin)/RANKL (receptor activator of nuclear factor-kB ligand) system is also severely disrupted during the osteogenesis process while coupling with angiogenesis, both of which eventually lead to abnormal endochondral bone formation in TD chickens. Thus, the process of vascular formation in endochondral bone appears to initiate the pathological changes in TD, and improvement of this process during coupling with osteogenesis may be a potential therapeutic approach to treat this intractable disease.


Conflict of interest statement

The authors declare no competing interests.

Figures

Figure 1
Figure 1
Growth rate of the chicken BW is not in synchronized with the growth of bones and blood vessels. (a,b) Quantitative analysis of increment speed of BW (a; body weight) and T. weight (b; tibia weight) in the normal group from 7-, 10 and 14-day-old broiler chickens. (c,d) Quantitative analysis of growth rate and increment speed of the T. weight index in the normal group from 7-, 10 and 14-day-old broiler chickens. (e,f) Quantitative analysis of growth rate of BW and T. weight in the normal group from 7-, 10 and 14-day-old broiler chickens. (gj) Quantitative analysis of growth rate and increment speed of the vascular area and vascular number in the normal group from 7-, 10 and 14-day-old broiler chickens. N = 8 chickens in each group from four independent experiments; Data represent means ± s.d. *p < 0.05, **p < 0.01, ***p < 0.001, one-way analysis of variance (ANOVA) and Least-significant difference (LSD) Duncan test. NS, not significant. (k) The changes of BW, T. weight, T. weight index, vascular area and vascular number were shown in a heatmap using the indicated pseudocolor scale from 0 percent (green) to 100 percent (red) relative to average values. Growth rate = (Nt − N0)/N0 * 100%; increment speed = (Nt − N0)/(t − 0), N: value, t: end time, 0: start time.
Figure 2
Figure 2
Tibial vascular invasion in the hypertrophic chondrocyte zones is diminished in TD chickens. (a) Protocol of thiram treatment in AA chickens (n = 60 chicks/group). (b) Schematic diagram of vascular distribution in different zones (RZ, PZ, and HZ) in the proximal tibia. RZ, resting chondrocyte zone; PZ, proliferative chondrocyte zone; HZ, hypertrophic chondrocyte zone; TB, trabecular bone. (c,e,g) Representative images of tibia sections stained with H&E from different zones of the proximal tibia growth plate of normal and TD chickens. Black arrows indicate the blood vessels. Scale bar, 500 μm. (d,f,h) Quantification of tibia blood vessel area and blood vessel number in the RZ, PZ, and PZ, respectively, from normal and TD chickens. Data represent means ± min or max. (n = 6, 3 sample replicates and 2 two isolated statistical groups (3 different microscopic fields were used as an average) using Image-Pro® Plus 6.0), *p < 0.05, ***p < 0.001, two-tailed unpaired t-test. NS, not significant. (i) The changes in area and number of blood vessels were shown in heatmaps using the indicated pseudocolor scale from 0 percent (green) to 100 percent (red), relative to average values.
Figure 3
Figure 3
Tibial vasculogenesis is disturbed in TD chickens. (a) A schematic diagram illustrating the procedure of vasculogenesis. (b,c) qRT-PCR analysis of FGF2 and FGFR1 expression levels (normalized to GAPDH) in proximal TGPs sorted from normal and TD chickens at 7, 10 and 14 days, respectively. Data represent means ± s.e.m. (n = 3 biological replicates). *p < 0.05, ***p < 0.001, two-tailed unpaired t-test. NS, not significant. (d–f) Western blot analysis (d) and the quantitation (e,f) of the relative levels of FGF2 and FGFR1 protein expression in proximal TGPs derived from normal and TD chickens at 7, 10 and 14 days, respectively. (n = 3 in each group from three independent experiments). Data represent means ± s.e.m. *p < 0.05, **p < 0.01, two-tailed unpaired t-test. NS, not significant. (g–i) VEGFA, VEGFR1, and VEGFR2 concentrations assessed by ELISA in serum. (n = 9 in each group from three independent experiments, 3 technical replicates per experiment). Data represent means ± s.d. ***p < 0.001, two-tailed unpaired t-test. NS, not significant. (j–l) qRT-PCR analysis of Ang1, Ang2 and Tie2 expression (normalized to GAPDH) levels in proximal TGPs sorted from normal and TD chickens at 7, 10 and 14 days, respectively. Data represent means ± s.e.m. (n = 3 biological replicates). **p < 0.01, ***p < 0.001, two-tailed unpaired t-test. NS, not significant. (mo) Ang1 and Tie2 concentrations assessed by serum ELISAs and Tie2/Ang1 ratios were determined. (n = 9 in each group from three independent experiments, 3 technical replicates per experiment). Data represent means ± s.d. *p < 0.05, **p < 0.01, two-tailed unpaired t-test. NS, not significant.
Figure 4
Figure 4
Inhibition of tibial angiogenesis in TD chickens. (a) A schematic diagram illustrating the experimental design and procedure of angiogenesis. Serum and bone specimens were collected from normal and TD chickens at 7, 10 and 14 days old, respectively. (b–d) qRT-PCR analysis of VEGFA, VEGFR1 and VEGFR2 expression (normalized to GAPDH) in proximal TGPs sorted from normal and TD chickens at 7, 10 and 14 days, respectively. Data represent means ± s.e.m. (n = 3 biological replicates). **p < 0.01, ***p < 0.001, two-tailed unpaired t-test. NS, not significant. (e–g) Western blot analysis (e) and the quantitation (f,g) of the relative levels of VEGFA and VEGFR1 protein expression in proximal TGPs derived from normal and TD chickens at 7, 10 and 14 days, respectively. (n = 3 in each group from three independent experiments). Data represent means ± s.e.m. *p < 0.05, two-tailed unpaired t-test. NS, not significant. (h) The gel electrophoresis diagram of the PDGF-BB and PDGFR-β gene. (i,j) qRT-PCR analysis of PDGF-BB and PDGFR-β expression levels (normalized to GAPDH) in proximal TGPs sorted from normal and TD chickens at 7, 10 and 14 days, respectively. Data represent means ± s.e.m. (n = 3 biological replicates). ***p < 0.001, two-tailed unpaired t-test. NS, not significant. (k–m) PDGF-BB and PDGFR-β concentrations assessed by serum ELISAs and PDGF-BB/PDGFR-β ratios were also determined. (n = 9 in each group from three independent experiments, 3 technical replicates per experiment). Data represent means ± s.d. **p < 0.01, two-tailed unpaired t-test. NS, not significant.
Figure 5
Figure 5
Growth plate vascularization is essential for chondrocyte growth and differentiation to promote bone mineralization. (a) A schematic diagram illustrating the experimental design. Serum and bone specimens were collected from normal and TD chickens at 7, 10 and 14 days old, respectively. (b) Representative images of tibia sections stained with H&E from lower hypertrophic chondrocyte zone of the proximal tibia growth plate of normal and TD chickens. Higher magnification is shown on the right. Black arrow indicates pyknosis. Red arrows indicate karyolysis. (c) Serum alkaline phosphatase (ALP), calcium (Ca) and phosphorus (P) levels in normal and TD chickens. Data represent means ± s.e.m. (n = 3 chickens from three independent experiments). *p < 0.05, ***p < 0.001, two-tailed unpaired t-test. NS, not significant. (d) Gel electrophoresis diagram of the OPG and RANKL genes. (e,f) qRT-PCR analysis of OPG and RANKL expression (normalized to GAPDH) in proximal TGPs sorted from normal and TD chickens at 7, 10 and 14 days, respectively. Data represent means ± s.e.m. (n = 3 biological replicates). **p < 0.01, ***p < 0.001, two-tailed unpaired t-test. NS, not significant. (g–i) OPG and RANKL concentrations assessed by serum ELISAs and the OPG/RANKL ratio were also determined. (n = 9 in each group from three independent experiments, 3 technical replicates per experiment). Data represent means ± s.d. **p < 0.01, two-tailed unpaired t-test. NS, not significant. (j,k) Correlation analysis between serum OPG level (j, n = 9), serum RANKL level (k, n = 9) and area of blood vessels in the hypertrophic chondrocyte zone of proximal tibia, respectively, were determined by Spearman tests. (n = 6, 3 sample replicates and 2 two isolated statistical groups (3 different microscopic fields were used as an average)).
Figure 6
Figure 6
Suppression of tibia structure and tibia mass are linked to osteogenesis. (a) A schematic diagram illustrating the experimental design. Sera and bone specimens were collected from normal and TD chickens at 7, 10 and 14 days old, respectively. (b) Representative morphological images of proximal tibias from normal and TD chickens. Real images on the right represent normal broiler chicken (above) and lameness of the broiler chicken (below). TDL, Tibial dyschondroplasia lesion; AC, articular cartilage; GP, growth plate; MP, metaphysis. (c,d) Quantitative morphological analysis of tibia mass in normal and TD groups from 7-, 10 and 14-day-old broiler chickens. (GP width, growth plate width; GP width/TL, growth plate width per tibia length. N = 8 chickens in each group from four independent experiments). Data represent means ± s.d. *p < 0.05, ***p < 0.001, two-tailed unpaired t-test. NS, not significant. (e–g, i–k) Quantitative analysis of tibia structure and tibia mass in normal and TD groups from 7-, 10, and 14-day-old broiler chickens. (BW, body weight; TW, tibia weight; TW/BW, tibia weight per body weight; TL, tibia length; TMD, tibia mid-diameter; TMD/TL, tibia mid-diameter per tibia length. N = 8 chickens in each group from four independent experiments). Data represent means ± s.d. *p < 0.05, **p < 0.01, ***p < 0.001, two-tailed unpaired t-test. NS, not significant. (h,l) Correlation analysis between BW and TW (h, n = 8), between TL and TMD (l, n = 8) in normal and TD chickens were determined by Spearman tests. (m) The changes in tibial growth plate parameters and tibia parameters were shown in a heatmap using the indicated pseudocolor scale from 0.1 percent (green) to 0.9 percent (red) relative to average values.

Similar articles

Cited by

References

    1. Pelicia K, et al. Evaluation of a radiographic method to detect tibial dyschondroplasia lesions in broilers. Braz J Poultry Sci. 2012;14:129–135.
    1. Shahzad M, et al. Differential expression of extracellular matrix metalloproteinase inducer (emmprin/cd147) in avian tibial dyschondroplasia. Avian Pathol. 2015;44:13–18. doi: 10.1080/03079457.2014.987210. - DOI - PubMed
    1. Huang S, et al. Tibial dyschondroplasia is highly associated with suppression of tibial angiogenesis through regulating the hif-1α/vegf/vegfr signaling pathway in chickens. Sci Rep-UK. 2017;7:9089. doi: 10.1038/s41598-017-09664-6. - DOI - PMC - PubMed
    1. Genin O, Hasdai A, Shinder D, Pines M. The effect of inhibition of heat-shock proteins on thiram-induced tibial dyschondroplasia. Poult Sci. 2012;91:1619–26. doi: 10.3382/ps.2012-02207. - DOI - PubMed
    1. Pines M, et al. Development of avian tibial dyschondroplasia: gene expression and protein synthesis. Calcif Tissue Int. 1998;63:521–7. doi: 10.1007/s002239900568. - DOI - PubMed

Publication types

LinkOut - more resources