. 2018 Feb 13:9:215.
doi: 10.3389/fimmu.2018.00215. eCollection 2018.

Loss of Rictor in Monocyte/Macrophages Suppresses Their Proliferation and Viability Reducing Atherosclerosis in LDLR Null Mice

Affiliations

Loss of Rictor in Monocyte/Macrophages Suppresses Their Proliferation and Viability Reducing Atherosclerosis in LDLR Null Mice

Vladimir R Babaev et al. Front Immunol. .

Abstract

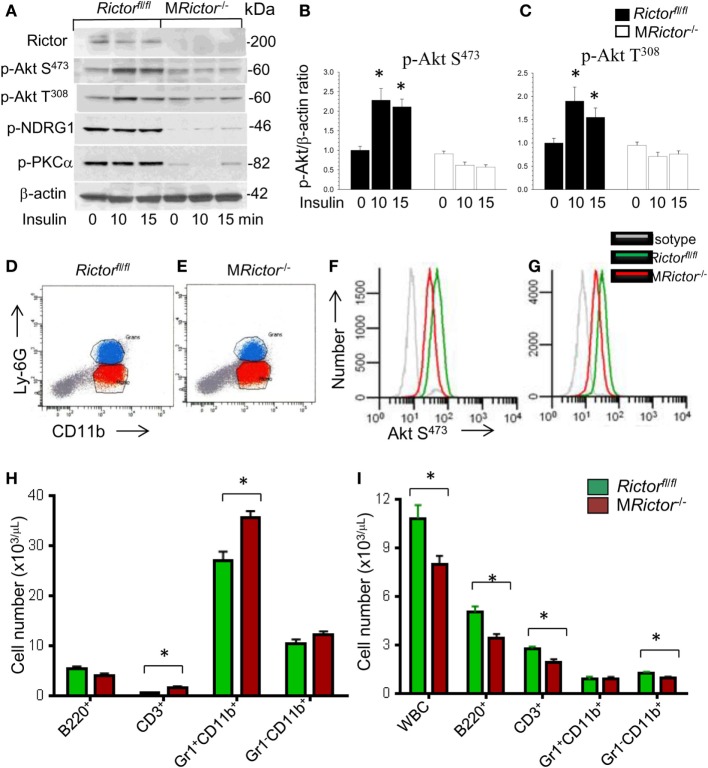
Background: Rictor is an essential component of mammalian target of rapamycin (mTOR) complex 2 (mTORC2), a conserved serine/threonine kinase that may play a role in cell proliferation, survival and innate or adaptive immune responses. Genetic loss of Rictor inactivates mTORC2, which directly activates Akt S473 phosphorylation and promotes pro-survival cell signaling and proliferation.

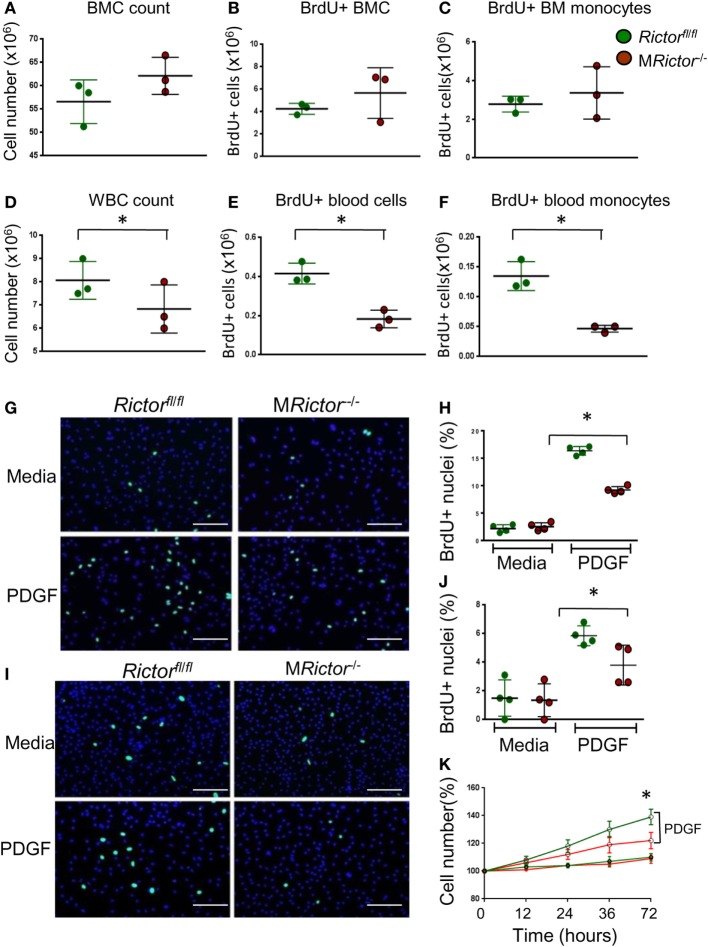
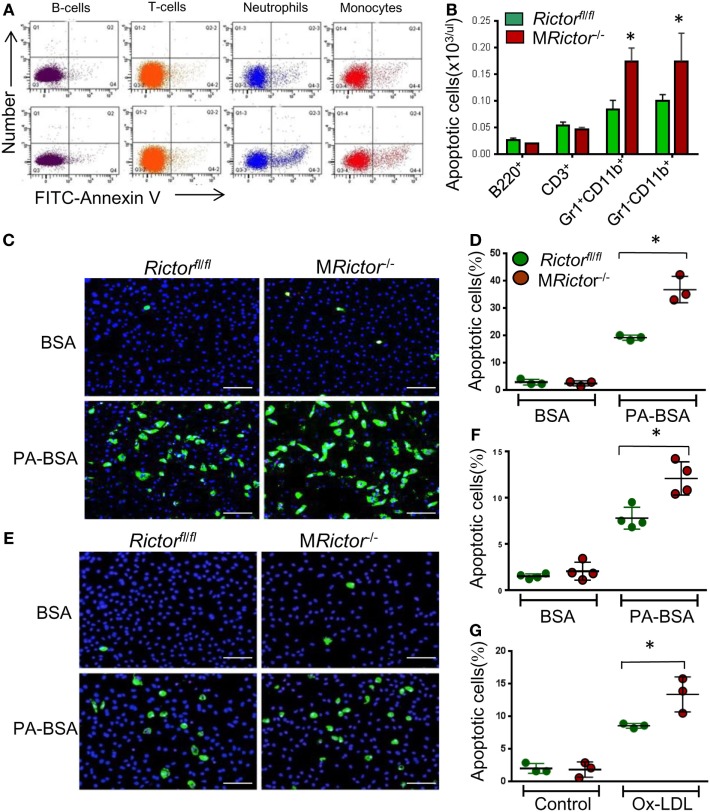
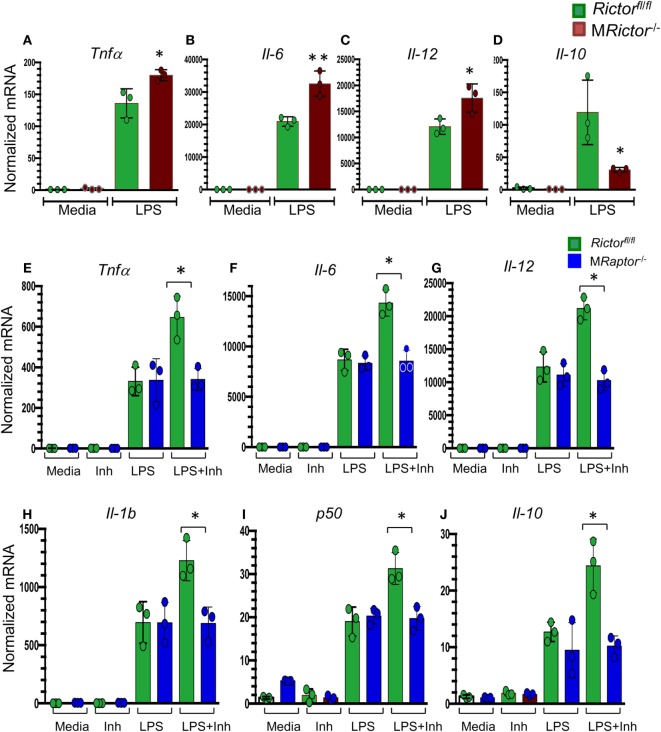
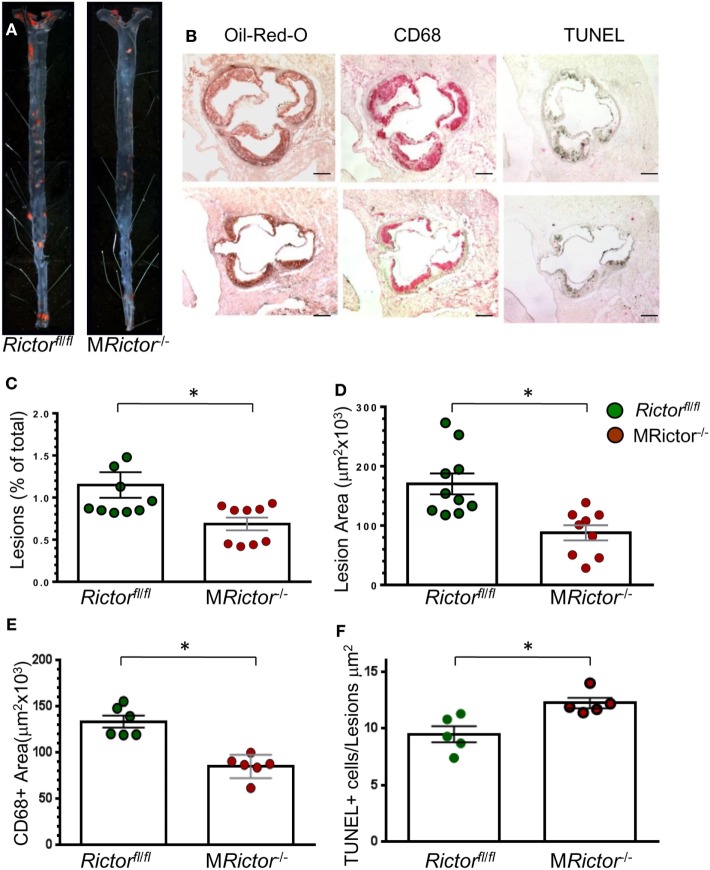
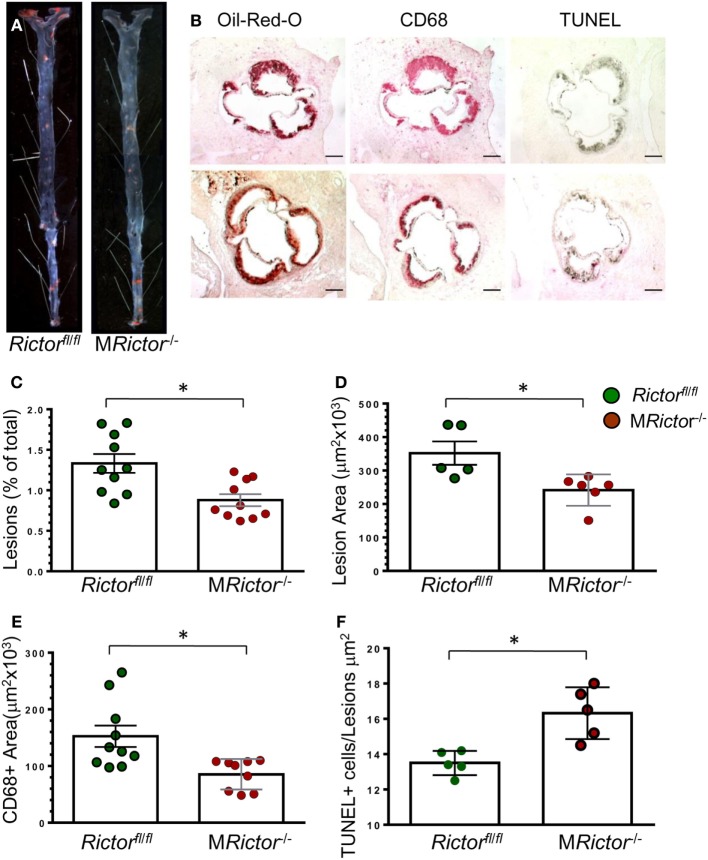
Methods and results: To study the role of mTORC2 signaling in monocytes and macrophages, we generated mice with myeloid lineage-specific Rictor deletion (MRictor-/-). These MRictor-/- mice exhibited dramatic reductions of white blood cells, B-cells, T-cells, and monocytes but had similar levels of neutrophils compared to control Rictor flox-flox (Rictorfl/fl) mice. MRictor-/- bone marrow monocytes and peritoneal macrophages expressed reduced levels of mTORC2 signaling and decreased Akt S473 phosphorylation, and they displayed significantly less proliferation than control Rictorfl/fl cells. In addition, blood monocytes and peritoneal macrophages isolated from MRictor-/- mice were significantly more sensitive to pro-apoptotic stimuli. In response to LPS, MRictor-/- macrophages exhibited the M1 phenotype with higher levels of pro-inflammatory gene expression and lower levels of Il10 gene expression than control Rictorfl/fl cells. Further suppression of LPS-stimulated Akt signaling with a low dose of an Akt inhibitor, increased inflammatory gene expression in macrophages, but genetic inactivation of Raptor reversed this rise, indicating that mTORC1 mediates this increase of inflammatory gene expression. Next, to elucidate whether mTORC2 has an impact on atherosclerosis in vivo, female and male Ldlr null mice were reconstituted with bone marrow from MRictor-/- or Rictorfl/fl mice. After 10 weeks of the Western diet, there were no differences between the recipients of the same gender in body weight, blood glucose or plasma lipid levels. However, both female and male MRictor-/-Ldlr-/- mice developed smaller atherosclerotic lesions in the distal and proximal aorta. These lesions contained less macrophage area and more apoptosis than lesions of control Rictorfl/flLdlr-/- mice. Thus, loss of Rictor and, consequently, mTORC2 significantly compromised monocyte/macrophage survival, and this markedly diminished early atherosclerosis in Ldlr-/- mice.

Conclusion: Our results demonstrate that mTORC2 is a key signaling regulator of macrophage survival and its depletion suppresses early atherosclerosis.

Keywords: Akt signaling; apoptosis; atherosclerosis; macrophages; mammalian target of rapamycin complex 2; monocytes; proliferation.


Figures

Figure 1
Figure 1
Loss of Rictor significantly suppresses Akt and mammalian target of rapamycin complex 2 (mTORC2) signaling in peritoneal macrophages, reduces p-Akt S473 in monocytes and neutrophils in vivo, and decreases blood leukocyte numbers. (A–C) Peritoneal macrophages were isolated from Rictorfl/fl and MRictor−/− mice (n = 3/group), incubated overnight in serum-free media then untreated or treated with insulin (100 nM) for 10 and 15 min. Proteins were extracted, resolved (60 μg/well) and analyzed by western blot using the antibodies as indicated. Note the reduction of p-Akt S473, p-Akt308 and mTORC2 downstream signaling, p-NDRG1 and p-PKCα in MRictor−/− macrophages compared to control Rictorfl/fl cells. Graphs represent data (mean ± SEM; *p < 0.05 compared to control untreated Rictorfl/fl cells). (D–G) Representative plots of gaiting strategy to analyze Akt S473 phosphorylation levels in bone marrow cells of Rictorfl/fl and MRictor−/− mice in vivo (D,E). Note MRictor−/− bone marrow neutrophils (F) and monocytes (G) expressed significantly less p-Akt S473 (red) than control Rictorfl/fl cells (green) but were higher than the isotype control antibodies (gray). (H,I) Multicolor flow cytometry analysis of bone marrow (H) and blood cells (I) isolated from Rictorfl/fl (green) and MRictor−/− (red) mice. Note the increase of T-cells and neutrophils in bone marrow and decrease of white blood cells, B- and T-cells and monocytes but not granulocytes in blood (mean ± SEM; *p < 0.05 compared to control sample). These experiments were repeated three times.
Figure 2
Figure 2
Loss of Rictor suppresses proliferation of blood monocytes and macrophages. (A–F) BrdU (10 ml/kg) was I/P injected into Rictorfl/fl and MRictor−/− mice, 24 h later bone marrow and blood cells were isolated and analyzed by flow cytometry. Note there were no differences in bone marrow cell count, total BrdU+ cells and BrdU+ monocytes (A–C); however, white blood cell count, total BrdU+ blood cells and BrdU+ monocytes were reduced in MRictor−/− compared to Rictorfl/fl mice. Graphs represent data (mean ± SEM) of the experiment with three mice per group (*p < 0.05 compared to control untreated group). (G–J) Blood monocytes (G,H) and peritoneal macrophages (I,J) were isolated from Rictorfl/fl and MRictor−/− mice, and two days incubation in DMEM media containing 10% FBS (and M-CSF for monocytes) treated with or without PDGF (20 ng/ml) and BrdU overnight. The incorporation of BrdU was analyzed under a fluorescent microscopy. Note PDGF treatment significantly increased proliferation but less prominent in MRictor−/− than in Rictorfl/fl cells. Graphs represent data (mean ± SEM) obtained from different mice (n = 4/group; *p < 0.05 t-test analysis compared to Rictorfl/fl cells); Scale bar is 50 mm. (K) WT and MRictor−/− peritoneal macrophages were seeded in triplicate on a 48-well plate and then treated with DMEM media alone or together with PDGF (20 ng/ml) for the indicated times. The cells were counted using an EVOS FL Auto imaging System (Life Technology). Note, top two lines of the graph represent cells treated with PDGF, as indicated.
Figure 3
Figure 3
MRictor−/− macrophages are less resistant to different pro-apoptotic stimuli than Rictorfl/fl cells. (A,B) Representative flow cytometry plots of apoptotic blood cells isolated from Rictorfl/fl (top panel) and MRictor−/− mice (bottom panel) and stained with the Alexa Fluor 488 Annexin V. Note increase of apoptosis in blood monocytes and neutrophils of MRictor−/− mice compared to Rictorfl/fl mice. Graphs represent data (mean ± SEM) of the experiment (n = 3/group, *p < 0.05 t-test analysis compared to Rictorfl/fl mice). (C,D) Blood monocytes were isolated from Rictorfl/fll and MRictor−/− mice (n = 3/group), incubated in DMEM media containing 10% FBS, M-CSF for 2 days, and then treated overnight with 0.3 M palmitic acid complexed to bovine serum albumin (PA-BSA) in the presence of 1% FBS and M-CSF. The Alexa Flour 488 Nalge Nunc International/dead cell apoptosis kit was used to detect apoptotic cells. Note PA-BSA treatment significantly increased apoptosis in both group of cells, more prominently in MRictor−/− than Rictorfl/fl cells; scale bars, 50 μm. Graphs represent data (mean ± SEM; *p < 0.05 by Mann–Whitney rank sum test). (E,G) Peritoneal macrophages were isolated from Rictorfl/fl and MRictor−/− mice (n = 4/group), and 2 days later treated with 0.5 M PA-BSA overnight (E,F) or human oxidized LDL (100 μg/ml) for 24 h (G). Annexin V/dead cell apoptosis kit was used to detect apoptotic cells; Note PA-BSA increases apoptosis more obviously in MRictor−/− than Rictorfl/fl macrophages; scale bars, 50 μm. Graphs represent data (mean ± SEM) of four mice/group; *p < 0.05 by Mann–Whitney rank sum test.
Figure 4
Figure 4
MRictor−/− macrophages have increased levels of inflammatory gene expression in response to lipopolysaccharide (LPS) and a low dose of Akt inhibitor increases the LPS-induced expression of inflammatory genes in Rictorfl/fl but not in MRaptor−/− macrophages. (A–D) Peritoneal macrophages were incubated with media alone (control) or together with LPS (20 ng/ml) for 5 h and the gene-expression levels were measured by real-time polymerase chain reaction. Note MRictor−/− macrophages have increased pro-inflammatory and decreased of interleukin-10 gene expression. Graphs represent data (mean ± SEM) obtained from the same numbers (n = 3 per group) of mice (*p < 0.05 and **p < 0.001 compared to Rictorfl/fl cells treated with LPS by t-test). (E–J) Peritoneal macrophages were isolated from Rictorfl/fl and MRaptor−/− mice and 2 days later were treated with media (Control), with the Akt inhibitor IV (31 μM, Inh) or LPS (20 ng/ml) alone or together with the inhibitor (LPS + Inh) for 5 h at 37°C and the gene-expression levels were measured by real-time polymerase chain reaction. Note a low dose of the Akt inhibitor increases LPS-mediated inflammatory gene expression but loss of Raptor reverses the increase. Graphs represent data (mean ± SEM) obtained from the same numbers (n = 3 per group) of mice (*p < 0.05 and **p < 0.001 compared to WT cells treated with LPS by t-test test).
Figure 5
Figure 5
Female MRictor−/− → Ldlr−/− mice had smaller atherosclerotic lesions, less macrophage area and more apoptotic cells in the lesions than control Rictorfl/fl → Ldlr−/− mice. (A) Representative images of and Sudan IV-stained en face preparation of aortas and (B) and serial cross sections of aortic sinus stained with Oil-Red-O/hematoxylin, CD68 and TUNEL AP from Rictorfl/fl → Ldlr−/− mice (B, top panel) and MRictor−/− → Ldlr−/− mice (B, bottom panel) mice. Scale bars, 200 μm. (C,D) Quantitation of atherosclerotic lesions in aortas en face and cross sections of aortic sinus of Rictorfl/fl → Ldlr−/− and MRictor−/− → Ldlr−/− bone marrow cells; *p < 0.05 by Mann–Whitney rank sum test. (E,F) Macrophage area stained with CD68 and number of TUNEL + cells in atherosclerotic lesions of mice reconstituted with WT or MRictor−/− bone marrow cells; *p < 0.05 by t-test.
Figure 6
Figure 6
Male MRictor−/− → Ldlr−/− mice had less atherosclerosis, smaller macrophage area and more apoptotic cells in the lesion area than control Rictorfl/fl → Ldlr−/− mice. (A) Representative images of and Sudan IV-stained en face preparation of aortas and (B) serial cross sections of aortic sinus stained with Oil-Red-O/hematoxylin, CD68 and TUNEL AP from Rictorfl/fl → Ldlr−/− [(B) top panel] and MRictor−/− → Ldlr−/− [(B) bottom panel] mice. Scale bars, 200 μm. (C,D) Quantitation of atherosclerotic lesions in aortas en face and cross sections of aortic sinus of Rictorfl/fl → Ldlr−/− and MRictor−/− → Ldlr−/− mice; *p < 0.05 by Mann–Whitney rank sum test. (E,F) Macrophage area stained with MOMA-2 and number of TUNEL + cells in atherosclerotic lesions of mice reconstituted with Rictorfl/fl or MRictor−/− bone marrow cells; *p < 0.05 by t-test.

References

    1. Linton MF, Yancey PG, Davies SS, Jerome WGJ, Linton EF, Vickers KC. The role of lipids and lipoproteins in atherosclerosis. In: De Groot LJ, Chrousos G, Dungan K, Feingold KR, Grossman A, Hershman JM, et al., editors. Endotext [Internet]. South Dartmouth (MA): MDTextcom, Inc. (2000). p. 1–92. Available from: https://www.ncbi.nlm.nih.gov/books/NBK343489/
    1. Sharma P, Allison JP. The future of immune checkpoint therapy. Science (2015) 348:56–61.10.1126/science.aaa8172 - DOI - PubMed
    1. Powell JD, Pollizzi KN, Heikamp EB, Horton MR. Regulation of immune responses by mTOR. Annu Rev Immunol (2012) 30:39–68.10.1146/annurev-immunol-020711-075024 - DOI - PMC - PubMed
    1. Weichhart T, Hengstschlager M, Linke M. Regulation of innate immune cell function by mTOR. Nat Rev Immunol (2015) 15:599–614.10.1038/nri3901 - DOI - PMC - PubMed
    1. Bettencourt IA, Powell JD. Targeting metabolism as a novel therapeutic approach to autoimmunity, inflammation, and transplantation. J Immunol (2017) 198:999–1005.10.4049/jimmunol.1601318 - DOI - PMC - PubMed

Publication types

MeSH terms

Substances