

FAM13A and POM121C are candidate genes for fasting insulin: functional follow-up analysis of a genome-wide association study
- PMID: 29487953
- PMCID: PMC6448992
- DOI: 10.1007/s00125-018-4572-8
FAM13A and POM121C are candidate genes for fasting insulin: functional follow-up analysis of a genome-wide association study
Abstract
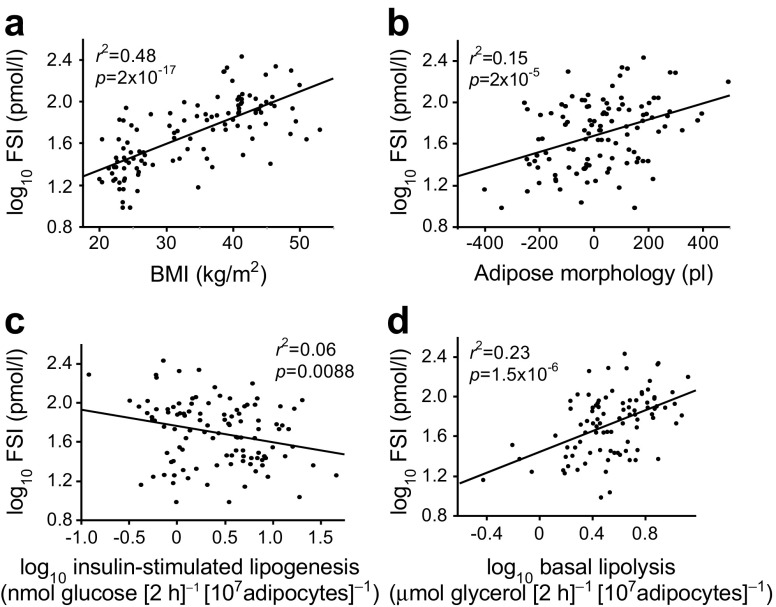
Aims/hypothesis: By genome-wide association meta-analysis, 17 genetic loci associated with fasting serum insulin (FSI), a marker of systemic insulin resistance, have been identified. To define potential culprit genes in these loci, in a cross-sectional study we analysed white adipose tissue (WAT) expression of 120 genes in these loci in relation to systemic and adipose tissue variables, and functionally evaluated genes demonstrating genotype-specific expression in WAT (eQTLs).
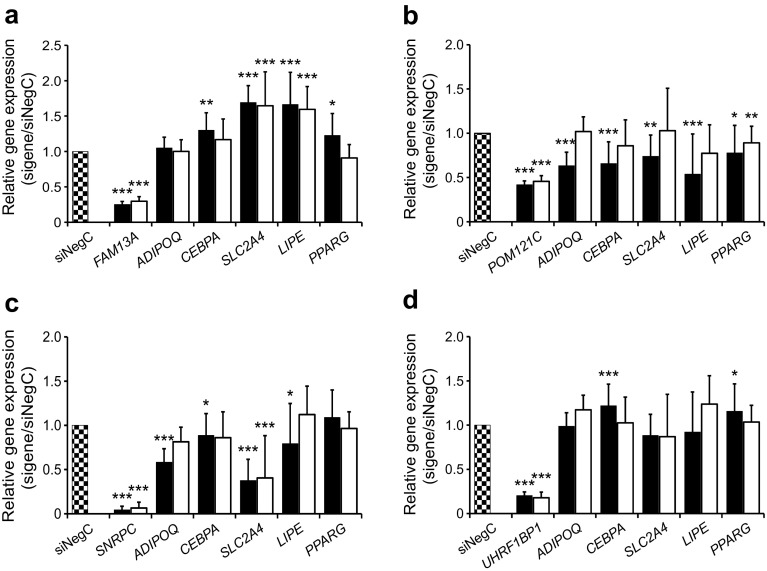
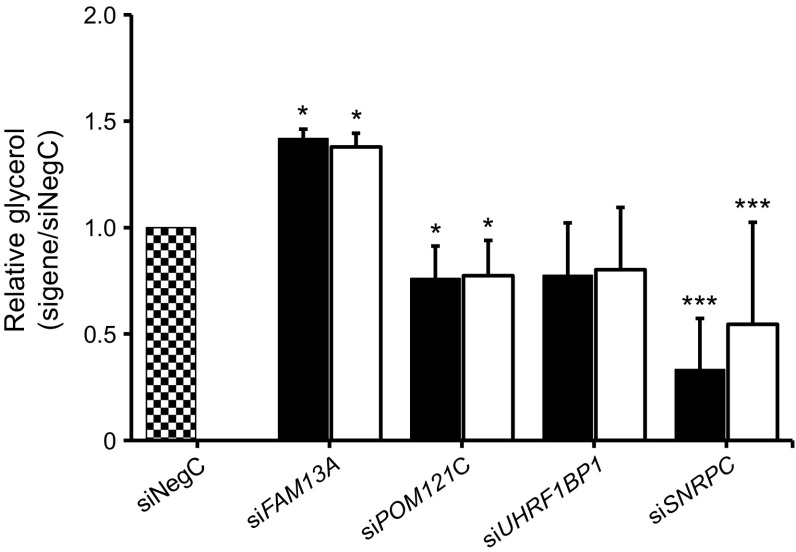
Methods: Abdominal subcutaneous adipose tissue biopsies were obtained from 114 women. Basal lipolytic activity was measured as glycerol release from adipose tissue explants. Adipocytes were isolated and insulin-stimulated incorporation of radiolabelled glucose into lipids was used to quantify adipocyte insulin sensitivity. Small interfering RNA-mediated knockout in human mesenchymal stem cells was used for functional evaluation of genes.
Results: Adipose expression of 48 of the studied candidate genes associated significantly with FSI, whereas expression of 24, 17 and 2 genes, respectively, associated with adipocyte insulin sensitivity, lipolysis and/or WAT morphology (i.e. fat cell size relative to total body fat mass). Four genetic loci contained eQTLs. In one chromosome 4 locus (rs3822072), the FSI-increasing allele associated with lower FAM13A expression and FAM13A expression associated with a beneficial metabolic profile including decreased WAT lipolysis (regression coefficient, R = -0.50, p = 5.6 × 10⁻⁷). Knockdown of FAM13A increased lipolysis by ~1.5-fold and the expression of LIPE (encoding hormone-sensitive lipase, a rate-limiting enzyme in lipolysis). At the chromosome 7 locus (rs1167800), the FSI-increasing allele associated with lower POM121C expression. Consistent with an insulin-sensitising function, POM121C expression associated with systemic insulin sensitivity (R = -0.22, p = 2.0 × 10⁻²), adipocyte insulin sensitivity (R = 0.28, p = 3.4 × 10⁻³) and adipose hyperplasia (R = -0.29, p = 2.6 × 10⁻²). POM121C knockdown decreased expression of all adipocyte-specific markers by 25-50%, suggesting that POM121C is necessary for adipogenesis.
Conclusions/interpretation: Gene expression and adipocyte functional studies support the notion that FAM13A and POM121C control adipocyte lipolysis and adipogenesis, respectively, and might thereby be involved in genetic control of systemic insulin sensitivity.
Keywords: Genomics; Insulin sensitivity; Lipid metabolism.
Conflict of interest statement
The authors declare that there is no duality of interest associated with this manuscript.
Figures
References
-
- American Diabetes Association (1998) Consensus development conference on insulin resistance. 5–6 November 1997. Diabetes Care 21: 310–314 - PubMed
Publication types
MeSH terms
Substances
Grants and funding
LinkOut - more resources
Full Text Sources
Other Literature Sources
Medical
Molecular Biology Databases
