. 2018 Oct;24(10):906-916.
doi: 10.1111/cns.12833. Epub 2018 Feb 27.

Inhibition of Lats1/p-YAP1 pathway mitigates neuronal apoptosis and neurological deficits in a rat model of traumatic brain injury

Affiliations

Inhibition of Lats1/p-YAP1 pathway mitigates neuronal apoptosis and neurological deficits in a rat model of traumatic brain injury

Di Li et al. CNS Neurosci Ther. 2018 Oct.

Abstract

Aims: To investigate the roles of Lats1/p-YAP1 pathway in TBI-induced neuronal apoptosis and neurological deficits in rats.

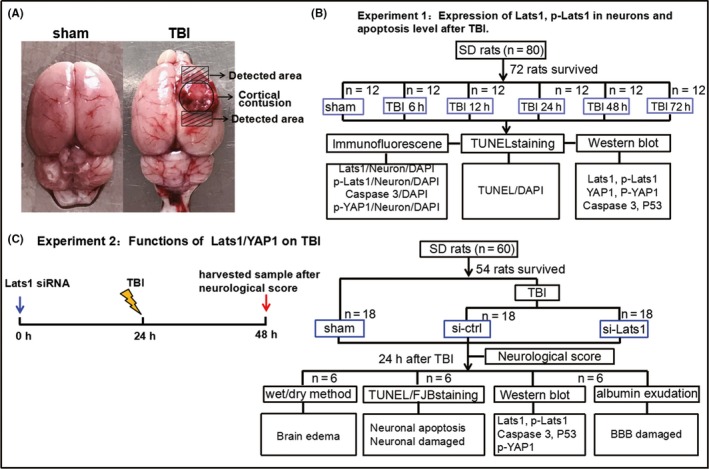
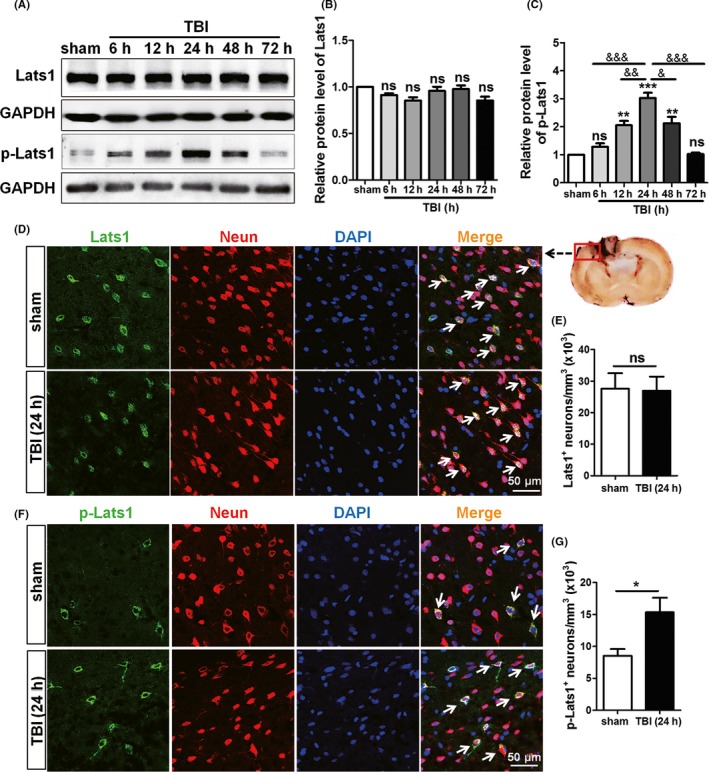
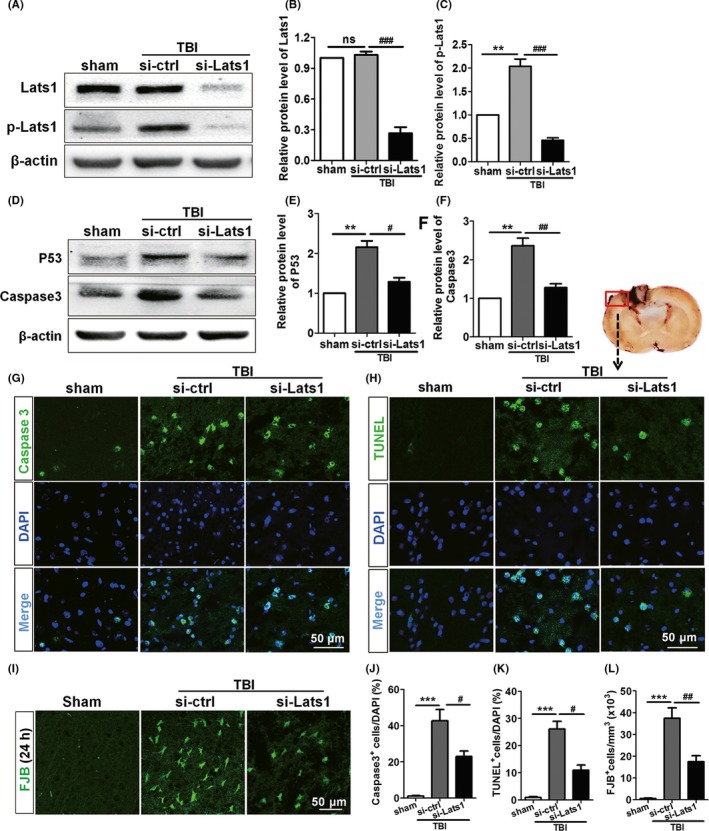
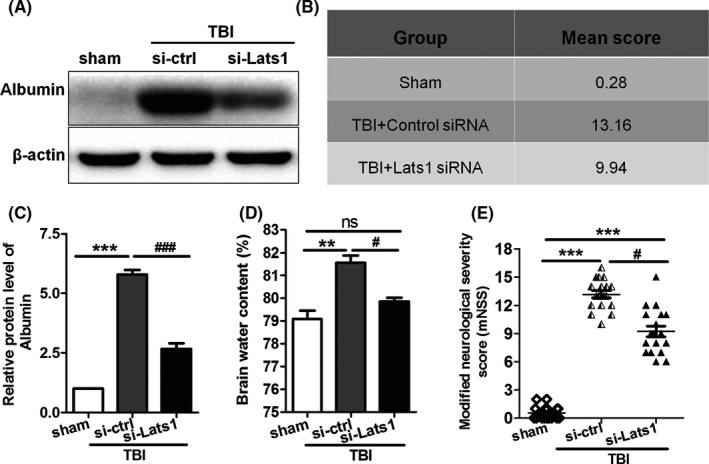
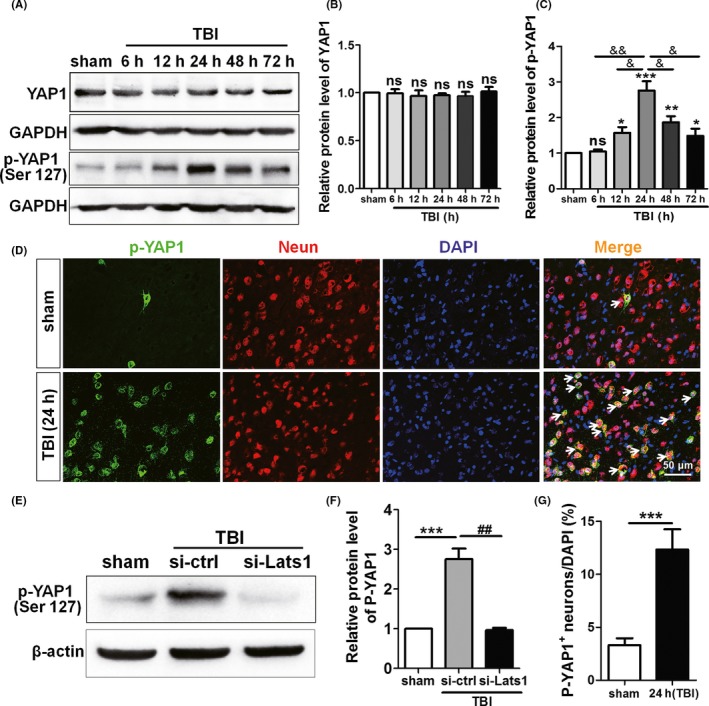
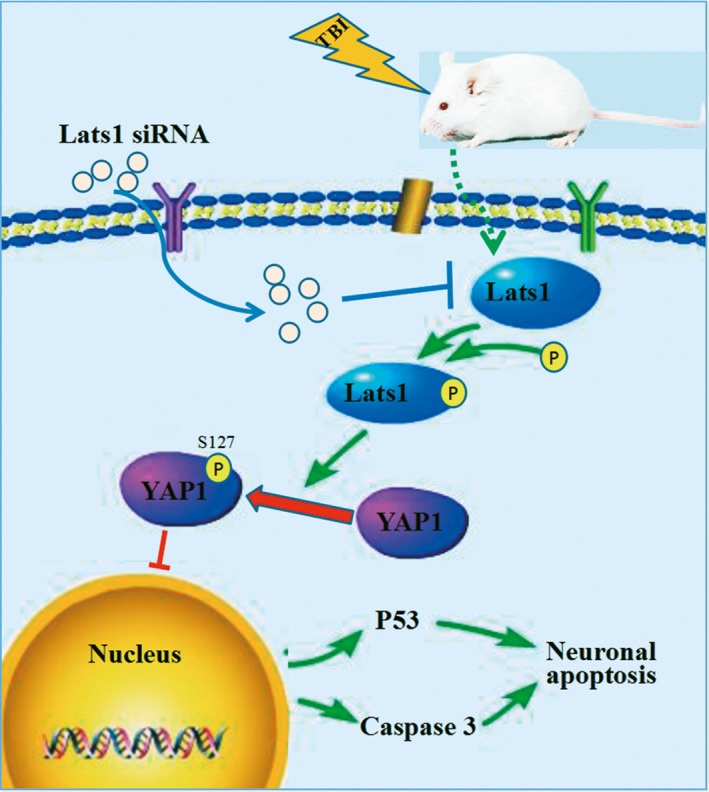
Results: We found that Lats1 and YAP1 were expressed in cerebral cortex neurons of Sprague-Dawley rats, and the phosphorylation levels of Lats1 and YAP1 in injured regions were significantly increased after TBI. Furthermore, inhibition of Lats1 not only decreased the level of p-YAP1, but also attenuated neuronal apoptosis and neurological impairment.

Conclusions: Our work demonstrates that inhibition of Lats1/p-YAP1 pathway mitigates neuronal apoptosis and neurological deficits in a rat model of TBI.

Keywords: Lats1; YAP1; neurological deficit; neuronal apoptosis; traumatic brain injury.


Conflict of interest statement

The authors declare no conflict of interest.

Figures

Figure 1
Figure 1
Traumatic brain injury (TBI) model and experimental design. (A) In TBI group, the circular area in the figure is the cortical contusion section; the shaded part (5 mm x 3 mm x 4 mm) above the circular area was used for Western blot; and the shaded portion under the cortical contusion area was used for immunohistochemistry. (B) The experiment 1 was designed to detect the expression levels of Lats1 at each time point after TBI and indicate the suitable time point for the experiment 2. (C) The experiment 2 was designed to detect the effects of Lats1/YAP1 pathway in TBI. DAPI = 4,6‐diamino‐2‐phenyl indole; FJB = fluoro‐jade B; TUNEL = terminal deoxynucleotidyl transferase‐mediated dUTP nick‐end labeling
Figure 2
Figure 2
Lats1 was expressed in neurons, and its phosphorylation level was increased after Traumatic brain injury (TBI). (A) Western blot analysis showed the protein levels of Lats1 and p‐Lats1 at 6 h, 12 h, 24 h, 48 h, and 72 h following TBI. (B, C) Quantification of Lats1 and p‐Lats1 protein levels at each time point as shown in (A), and the protein level of p‐Lats1 reached the highest at 24 h after TBI. (D, F) Immunofluorescence results indicated that Lats1 (green) and p‐Lats1 (green) were expressed in rat cortical neurons (red). And the expression levels of p‐Lats1 were increased at 24 h after TBI. (E, G) Density of Lats1 + cells and p‐Lats1 + cells. Scale bars: 50 μm. Values represent means ± SEM. Student's t test and one‐way ANOVA. *P < 0.05; **P < 0.01; ***P < 0.001 vs sham group; & P < 0.05; && P < 0.01; &&& P < 0.001 vs TBI group (24 h); ns: not significant
Figure 3
Figure 3
Inhibition of Lats1 repressed the expression level of p‐Lats1 and attenuated apoptosis following Traumatic brain injury (TBI). (A) Western blot analyzed the expression levels of Lats1 and p‐Lats1 in sham group, control siRNA group, and Lats1 siRNA group after silenced Lats1. (B, C) Quantification of the expression levels of Lats1 and p‐Lats1 in each group as shown in (A). (D) Western blot analysis of caspase‐3 and P53 protein levels in cerebral cortex of each group after silenced Lats1. (E, F) Quantification of the expression levels of caspase‐3 and P53 as shown in (E). (G‐I) Coronal sections of the cerebral cortex from sham group, control siRNA group, and Lats1 siRNA group rats were immunostained for caspase‐3, TUNEL, and FJB at 48 hrs after intracerebroventricular injection of siRNA. (J‐L) Numbers of caspase‐3 + cells (J), TUNEL+ cells (K), and FJB+cells (L) are expressed as percentage of DAPI+ cell numbers in the rat cortex of each group. Scale bars: 50 μm. Values represent means ± SEM. One‐way ANOVA. **P < 0.01; ***P < 0.001 vs sham group; # P < 0.05; ## P < 0.01; ### P < 0.001 vs si‐ctrl group; ns: not significant
Figure 4
Figure 4
Inhibition of Lats1 reduced brain edema, BBB damage, and neurological deficits following Traumatic brain injury (TBI). (A) Western blot analysis of albumin protein level in cerebral cortex of sham group, control siRNA group, and Lats1 siRNA group after inhibited Lats1. (B, E) Neurological behavior scores in each group. (C) Quantification of the expression levels of albumin in each group as shown in (A). (D) Dry and wet method analysis of brain water content in different groups. Values represent means ± SEM. One‐way ANOVA and nonparametric analysis of variance. **< 0.01; ***< 0.001 vs sham group; # P < 0.05; ### P < 0.001 vs si‐ctrl group
Figure 5
Figure 5
YAP1 phosphorylation level is increased after TBI, and inhibition of Lats1 represses YAP1 phosphorylation. (A) Western blot detected the expression levels of YAP1 and p‐YAP1 at 6 h, 12 h, 24 h, 48 h, and 72 h following TBI. (B, C) The protein levels of YAP1 and p‐YAP1 were quantified as shown in (A), and the protein level of p‐YAP1 reached the peak at 24 hrs after TBI. (D) Immunofluorescence results indicated that p‐YAP1 (green) was expressed in rat cortical neurons (red). And the expression levels of p‐YAP1 were increased in TBI group. (E) Western blot analysis protein levels of p‐YAP1 in sham group, control siRNA group, and Lats1 siRNA group under the premise of silenced Lats1. (F) Quantification of the p‐YAP1 protein levels in each group as shown in (E). (G) Density of p‐YAP1 + cells. Scale bars: 50 μm. Values represent means ± SEM. Student's t test and one‐way ANOVA. *P < 0.05; **P < 0.01; ***P < 0.001 vs sham group; & P < 0.05; && P < 0.01 vs TBI group (24 h); ## P < 0.01 vs si‐ctrl group; ns: not significant
Figure 6
Figure 6
Schematic model for the roles of Lats1‐YAP1 signaling in neuronal apoptosis. Lats1 is phosphorylated and activated; in turn, p‐Lats1 phosphorylates the downstream molecule YAP1; and p‐YAP1 is cytoplasmic retention, then the expression levels of P53 and caspase‐3 are upregulated which aggravates neuronal apoptosis following Traumatic brain injury (TBI)

References

    1. Wang Y, Liu Y, Lopez D, et al. Protection against TBI‐induced neuronal death with post‐treatment with a selective calpain‐2 inhibitor in mice. J Neurotrauma. 2018;35:105‐117. - PMC - PubMed
    1. Indraswari F, Wang H, Lei B, et al. Statins improve outcome in murine models of intracranial hemorrhage and traumatic brain injury: a translational approach. J Neurotrauma. 2012;29:1388‐1400. - PubMed
    1. Salehi A, Zhang JH, Obenaus A. Response of the cerebral vasculature following traumatic brain injury. J Cereb Blood Flow Metab. 2017;37:2320‐2339. - PMC - PubMed
    1. Hopp S, Nolte MW, Stetter C, Kleinschnitz C, Sirén AL, Albert‐Weissenberger C. Alleviation of secondary brain injury, posttraumatic inflammation, and brain edema formation by inhibition of factor XIIa. J Neuroinflammation. 2017;14:39. - PMC - PubMed
    1. Menon DK, Maas AI. Traumatic brain injury in 2014. Progress, failures and new approaches for TBI research. Nat Rev Neurol. 2015;11:‐72. - PubMed

Publication types

MeSH terms

LinkOut - more resources