. 2018 Jun;48(6):1046-1058.
doi: 10.1002/eji.201747355. Epub 2018 Mar 23.

Arginase-1 is neither constitutively expressed in nor required for myeloid-derived suppressor cell-mediated inhibition of T-cell proliferation

Affiliations

Arginase-1 is neither constitutively expressed in nor required for myeloid-derived suppressor cell-mediated inhibition of T-cell proliferation

Zhen Bian et al. Eur J Immunol. 2018 Jun.

Abstract

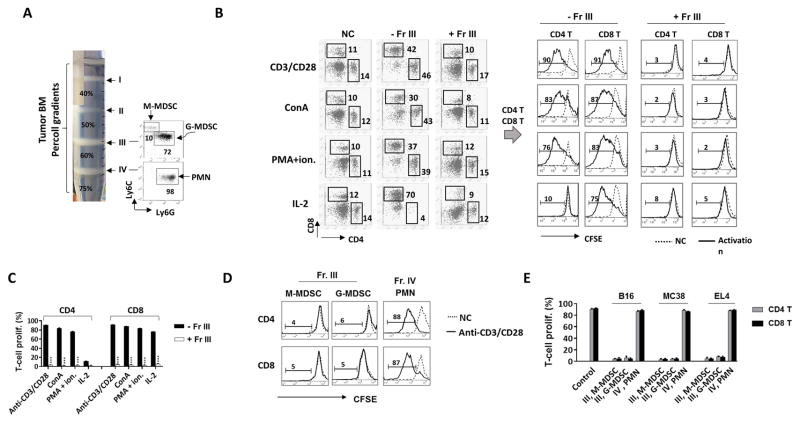
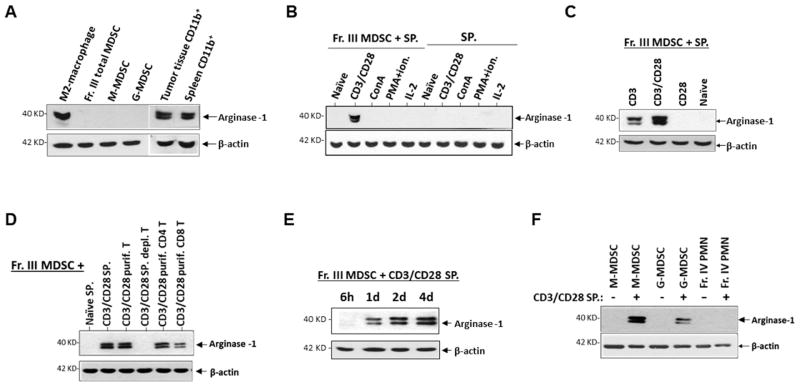
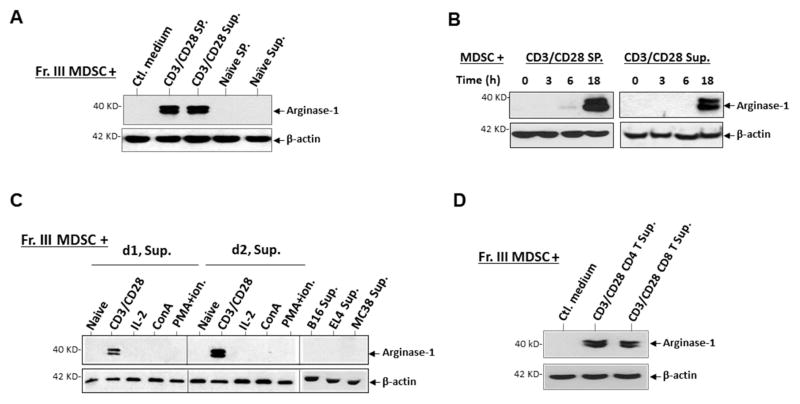
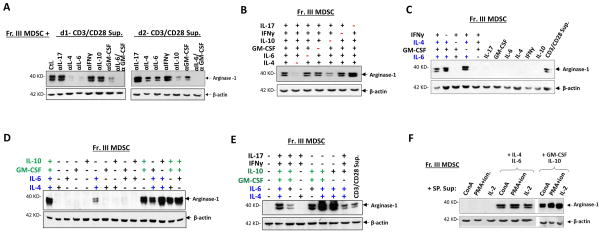
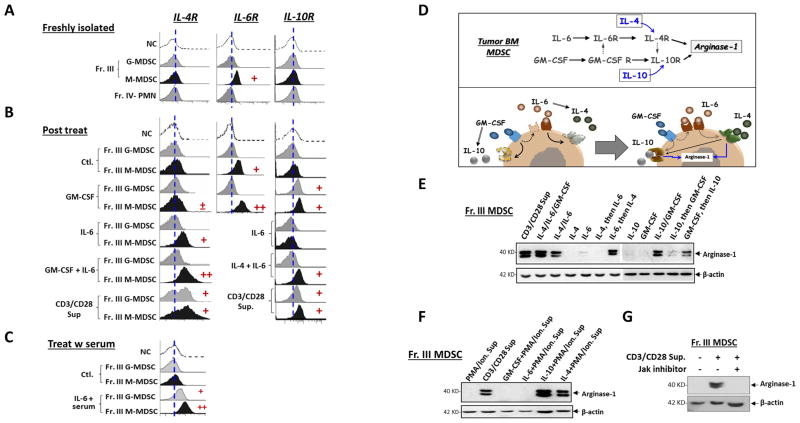
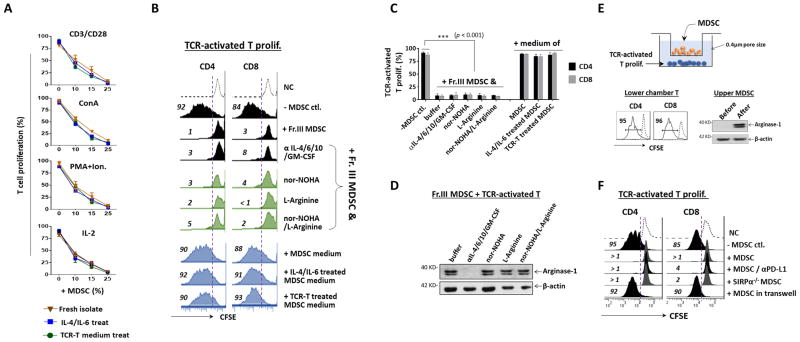
Although previous reports suggest that tumor-induced myeloid-derived suppressor cells (MDSC) inhibit T cells by L-arginine depletion through arginase-1 activity, we herein show that arginase-1 is neither inherently expressed in MDSC nor required for MDSC-mediated inhibition. Employing Percoll density gradients, large expansions of MDSC in the bone marrow of tumor-bearing mice were isolated and demonstrated potent inhibition in T-cell proliferation activated by TCR-ligation, Concanavalin A, PMA plus ionomycin, or IL-2. Despite demonstrating characteristic immunosuppressive capacity, these MDSC exhibit no arginase-1 expression and/or exert their inhibitory effects independent of arginase-1 activity. However, arginase-1 expression in MDSC can be induced by exposure to TCR-activated T cells or their culture medium, but not T cells activated by other means or growing tumor cells. Further investigation reveals multiple cytokines secreted by TCR-activated T cells as orchestrating two signaling-relay axes, IL-6-to-IL-4 and GM-CSF/IL-4-to-IL-10, leading to arginase-1 expression in MDSC. Specifically, IL-6 signaling increases IL-4R, enabling IL-4 to induce arginase-1 expression; similarly, GM-CSF in concert with IL-4 induces IL-10R, allowing IL-10-mediated induction. Surprisingly, our study indicates that induction of arginase-1 expression is not conducive to the critical MDSC-mediated inhibition toward T cells, which is rather dependent on direct cell contacts undiminished by PD-L1 blockade or SIRPα deficiency.

Keywords: Arginase-1; GM-CSF; IL-10; IL-4; Myeloid-derived suppressor cell.


Conflict of interest statement

Conflict of interest

The authors declare no financial or commercial conflict of interest.

Figures

Figure 1
Figure 1
Expansion of MDSC in tumor bone marrow. A) Isolation of bone marrow myeloid leukocytes by Percoll density gradients. Bone marrow cells harvested from tumor-bearing mice were applied to discontinuous Percoll density gradients and separated into four fractions (I, II, III, and IV), where myeloid leukocytes were enriched in fractions III and IV (Fr. III and Fr. IV) as determined by Ly6C and Ly6G labeling. B–C) Characterization of Fr. III MDSC by inhibition of T cell proliferation. Splenic T cells labeled with CFSE were induced to proliferate by antibody ligations of CD3 and CD28 (CD3/CD28), ConA, PMA plus ionomycin (PMA+ion.), and IL-2 in the absence (control) or the presence of Fr. III MDSC at the ratio of MDSC: splenocytes = 1: 4. After 4 days, the proliferation of T cells, both CD4 and CD8, was determined by flow cytometric analyses of CSFE dilution (left shift). NC, no proliferation induction. The full gating strategy is presented in Supporting Information Fig 1. D–E) Inhibitory effect of M-MDSC and G-MDSC on T cell proliferation. Fr. III MDSC were further separated into M-MDSC and G-MDSC by Ly6C and Ly6G selection, respectively, prior to testing in T cell proliferation induced by CD3/CD28. The Fr. IV mature PMN were also simultaneously tested. MDSC/PMN: splenocytes = 1:4. The experiments of B) and D) were repeated independently at least more than five times using MDSC from different tumor-bearing mice (n > 15) with statistical data (mean ± SEM) shown in C) and E), respectively. ***, p ≤ 0.001.
Figure 2
Figure 2
Bone marrow MDSC express no arginase-1 unless induced. A) Arginase-1 expression in freshly isolated bone marrow MDSC. Western blot (WB) was performed to detect arginase-1 in total bone marrow MDSC (Fr. III MDSC) and separated M-MDSC and G-MDSC, CD11b+ myeloid cells isolated from tumor tissues and the spleen of the same tumor-bearing mice, and M2-skewed macrophages (positive control.). B) Arginase-1 expression in MDSC after exposure to activated T cells. Splenocytes in which T cell proliferation was stimulated by different mechanisms were cultured in the presence (Fr. III MDSC + SP.) or the absence (SP.) of freshly isolated bone marrow MDSC. After 4 days, cells were collected for arginase-1 detection by WB. “Naïve” are T cells without proliferative stimulation. C) Splenocytes in which T cells were antibody ligated for CD3 alone, CD3 and CD28, or CD28 alone were co-cultured with Fr. III MDSC for 4 days prior to WB analyses for arginase-1 expression. D) MDSC were co-cultured with total splenocytes, purified splenic T cells, T cell-depleted splenocytes, purified CD4+ T and CD8+ T cells without (naïve) or with TCR activation (CD3/CD28) prior to detection of arginase-1 expression. E) Time length required for MDSC to express arginase after exposing to TCR-activated T cells. F) Arginase-1 expression in M-MDSC, G-MDSC and PMN under induction. Data represent consensus results of more than five independent experiments.
Figure 3
Figure 3
Cell contact-independent induction of arginase-1 expression in MDSC by TCR-activated T cells. A). MDSC treated for 24 h with conditioned medium containing cell-free supernatants (30% conditioned) collected from splenocyte cultures in which T cells were activated by TCR ligation (CD3/CD28 Sup.) were tested for arginase-1 expression. Supernatants from cultures in which T cells were not activated (naïve) were used as controls. B) Time-course of medium-induced arginase-1 expression. MDSC treated with TCR-activated T cell medium as in A) were collected at 0, 3, 6, and 18 h for analyses. C) Comparison of cell mediums for the capacity of inducing arginase-1. Cell-free supernatants from T cell cultures in which T cells were activated by different mechanisms and from cultures of tumor cells including B16 melanoma, EL4 lymphoma, and MC38 colonic carcinoma were used to treat MDSC (30% conditioned medium). D1 and d2, supernatants collected day-1 and day-2, respectively, after T cell culture started. D) Aginase-1 expression in MDSC after exposure to conditioned medium of TCR-activated, either CD4 or CD8 T cells. Arginase-1 expression in MDSC were detected by WB with β-actin detection as loading controls. Demonstrated data represent five independent experiments.
Figure 4
Figure 4
Cytokine-mediated arginase-1 induction in MDSC. A) Effect of cytokine neutralization in TCR-activated T cell medium on arginase-1 induction in MDSC. T cell culture supernatants collected on day-1 (d1) and day-2 (d2) after T cells were activated by CD3/CD28 ligation were used to treat freshly isolated bone marrow MDSC (Fr. III MDSC, 50% conditioned medium) in the absence (control.) or the presence of blocking antibodies against IL-4, IL-6, IL-10, IL-17, IFNγ or GM-CSF, alone or in combination. After 24 h of treatment, arginase-1 expression in MDSC was assessed by WB. B–E) Directly treating Fr. III MDSC with cytokines. MDSC were treated with recombinant IL-4, IL-6, IL-10, IL-17, IFNγ or GM-CSF in various combinations (B-E), or alone (C), for 24 h prior to analyses for arginase-1 expression by WB. Sample data shown indicate that two cytokine combinations, IL-4/IL-6 (colored blue) and GM-CSF/IL-10 (colored green), are capable of inducing arginase-1 expression in MDSC. F) Supplementation with IL-4/IL-6 or GM-CSF/IL-10 confers the capacity for T cells activated by ConA, PMA plus ionomycin, or IL-2 to induce arginase-1. Fr. III MDSC were treated with culture supernatants collected from T cells activated by ConA, PMA plus ion., or IL-2 (50% conditioned medium) without or with the addition of IL-4 and IL-6, or GM-CSF and IL-10 for 24 h prior to analyses for arginase-1 expression. More than twenty different cytokine neutralization permutations have been performed, and sample data presented in the figure represent at least five independent experiments. All WB used β-actin detection as the loading control and demonstrated data represent five independent experiments
Figure 5
Figure 5
Dual axes of cytokine-mediated arginase-1 induction in MDSC. A–C) Expression of cytokine receptors on MDSC. Freshly isolated Fr. III MDSC without treatment (A),or treated by various cytokines or T cell culture supernatants (B–C) for 24 h were tested for the cell surface expression of receptors for IL-4 (IL-4R), IL-6 (IL-6R) and IL-10 (IL-10R) by flow cytometry. In particular, cytokine treatments were performed in DMEM with either 10% FBS (B) or 20% murine serum (C) obtained from tumor-bearing mice. D) Schematic depiction of dual-axis cytokine responses that induce arginase-1 expression in MDSC. E) Testing arginase-1 induction via IL-6-to-IL-4 and GM-CSF-to-IL-10 pathways and the effect of GM-CSF on promoting IL-6/IL-4-mediated induction. Fr. III MDSC were treated with different cytokines or their combinations for 24 h prior to WB analyses. For sequential treatments, MDSC were incubated with the first cytokine for 12 h, washed three times, then were incubated with the second cytokines for 18 h. F) IL-4 or IL-10 confers the capacity for T cells activated by PMA plus ionomycin to induce arginase-1. The culture supernatants from T cells activated by PMA plus ionomycin (Table 2) were supplemented with IL-4 or IL-10 when used for treating Fr. III MDSC (50% conditioned medium). G) Inhibition of JAK kinases in MDSC abrogates arginase-1 induction by TCR-activated T cells. Fr. III MDSC were treated with TCR-activated T cell medium in the absence or the presence of a JAK inhibitor (JAK Inhibitor I) that inhibits JAK1/2/3. All MDSC treatments lasted for 24 h prior to arginase-1 detection by WB with β-actin detection as the loading control. Demonstrated data represent at least five independent experiments.
Figure 6
Figure 6
MDSC inhibition of T cell proliferation depends on direct cell contact not arginase-1 activity. A). MDSC with or without prior induction of arginase-1 by IL-4/IL-6 or TCR-activated T cell medium (24 h treatment) were added at varied amounts into T cell proliferation systems induced by CD3/CD28 ligation, ConA, PMA plus ionomycin, or IL-2 for 4 days. The amounts of MDSC added were MDSC: splenocytes = 1: 9 (10%), 1: 6 (15%) and 1: 3 (25%). B) Blockade of arginase-1 expression or activity did not dampen MDSC inhibition of TCR-activated T cell proliferation. Black panel, TCR-activated T cell proliferation was performed in the presence Fr. III MDSC (25%). Neutralization antibodies against IL-4, IL-6, IL-10 and GM-CSF were added in the co-culture to suppress arginase-1 induction in MDSC. Green panel, Arginase-1 inhibitor (nor-NOHA) and L-arginine free amino acid do not rescue T cell proliferation inhibited by MDSC. Nor-NOHA or L-arginine were added into the co-culture of TCR-activated T cells and MDSC on day 1 and day 3. Blue Panel, Cell-free culture medium of MDSC does not confer inhibitory capacity toward T cells. MDSC were cultured in the absence or the presence of IL-4 and IL-6, or TCR-activated T cells-conditioned medium to induce arginase-1 expression for two days. The cell-free supernatants collected were then added (50% of the volume) into CD3/CD28 ligation-induced T cell proliferation system to assess inhibitory effects. C) Statistical data of B. Data are presented as mean ± SEM (n ≥ 5). ***, p ≤ 0.001. D) Confirmation of arginase-1 expression in MDSC used in B. E) MDSC and splenocytes in which T cell proliferation was induced by CD3/CD28 ligation were placed in the upper and the lower chamber, respectively, of a transwell device with filters (0.4 μm diameter pore), thereby physically separating the cells, but not the medium. After co-culturing for 4 days, the upper chamber MDSC and the lower chamber T cells were analyzed for arginase-1 expression and T cell proliferation, respectively. F) The ability of PD-L1 blockade and deficiency of SIRPα in SIRPα−/− MDSC to diminish T cell proliferation was assayed using CFSE dilution as readout. Demonstrated data throughout this figure are all representative of at least five independent experiments each.

References

    1. Corzo CA, Cotter MJ, Cheng P, Cheng F, Kusmartsev S, Sotomayor E, Padhya T, McCaffrey TV, McCaffrey JC, Gabrilovich DI. Mechanism regulating reactive oxygen species in tumor-induced myeloid-derived suppressor cells. J Immunol. 2009;182:5693–5701. - PMC - PubMed
    1. Bronte V, Apolloni E, Cabrelle A, Ronca R, Serafini P, Zamboni P, Restifo NP, Zanovello P. Identification of a CD11b(+)/Gr-1(+)/CD31(+) myeloid progenitor capable of activating or suppressing CD8(+) T cells. Blood. 2000;96:3838–3846. - PMC - PubMed
    1. Diaz-Montero CM, Salem ML, Nishimura MI, Garrett-Mayer E, Cole DJ, Montero AJ. Increased circulating myeloid-derived suppressor cells correlate with clinical cancer stage, metastatic tumor burden, and doxorubicin-cyclophosphamide chemotherapy. Cancer Immunol Immunother. 2009;58:49–59. - PMC - PubMed
    1. Kusmartsev S, Nefedova Y, Yoder D, Gabrilovich DI. Antigen-specific inhibition of CD8+ T cell response by immature myeloid cells in cancer is mediated by reactive oxygen species. J Immunol. 2004;172:989–999. - PubMed
    1. Gabrilovich DI, Nagaraj S. Myeloid-derived suppressor cells as regulators of the immune system. Nat Rev Immunol. 2009;9:162–174. - PMC - PubMed

Publication types

MeSH terms