. 2018 Jun;37(6):1723-1733.
doi: 10.1002/etc.4125. Epub 2018 May 7.

Adverse outcome pathway networks I: Development and applications

Affiliations

Adverse outcome pathway networks I: Development and applications

Dries Knapen et al. Environ Toxicol Chem. 2018 Jun.

Abstract

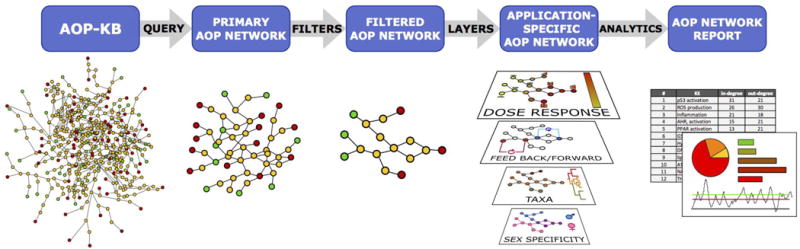
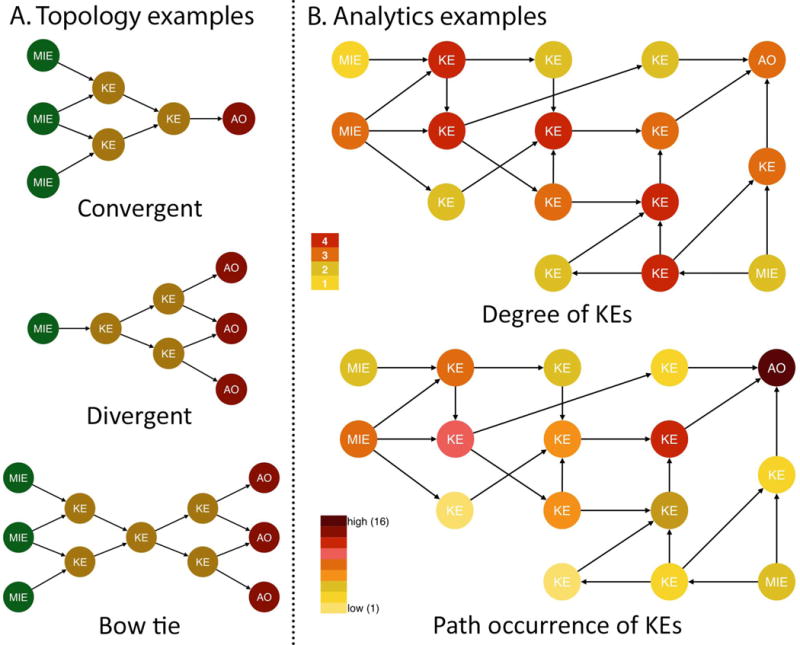
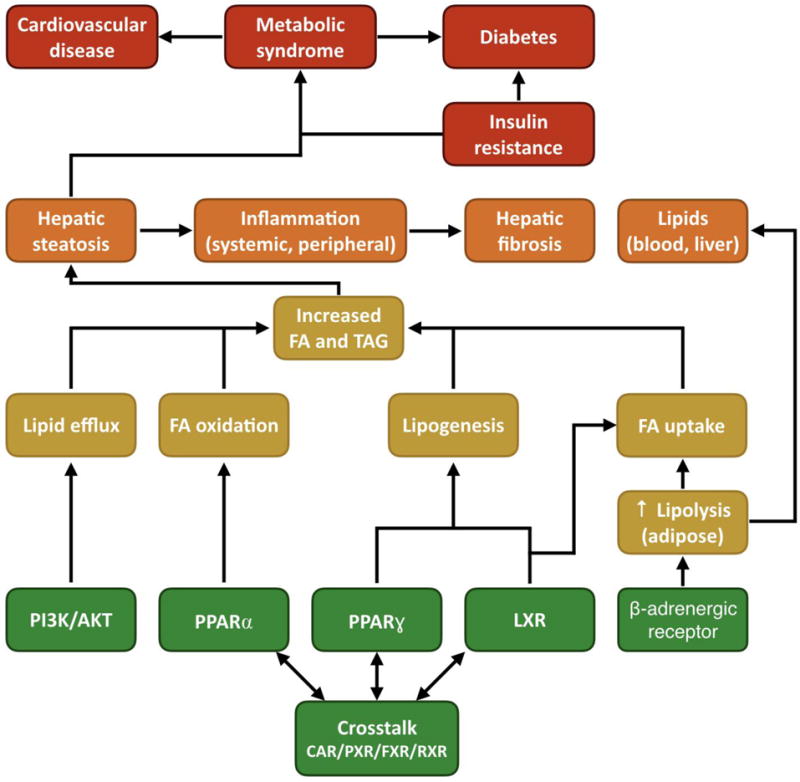
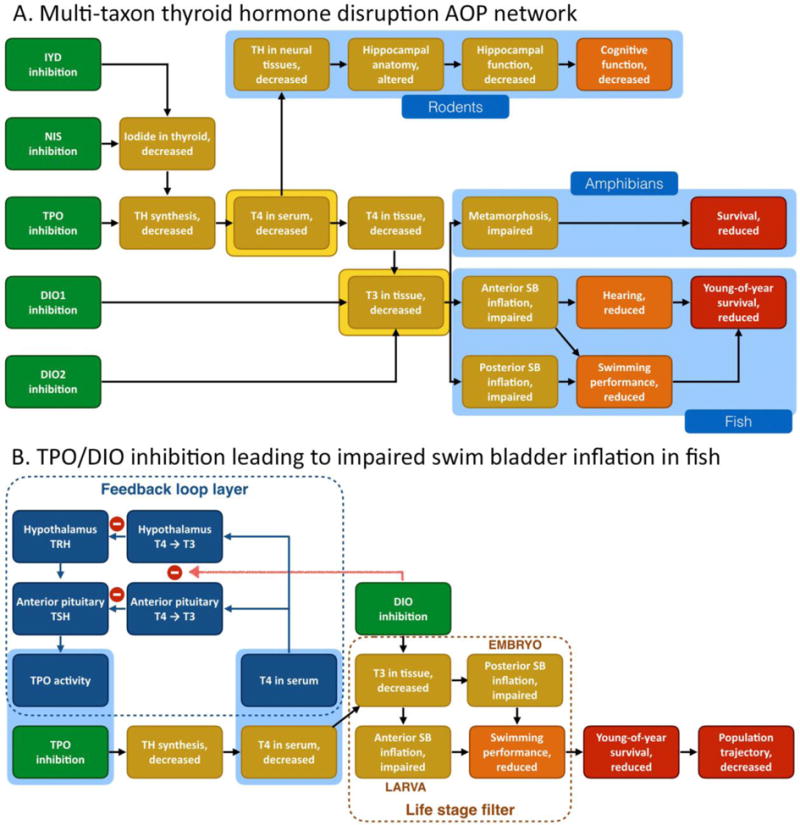
Based on the results of a Horizon Scanning exercise sponsored by the Society of Environmental Toxicology and Chemistry that focused on advancing the adverse outcome pathway (AOP) framework, the development of guidance related to AOP network development was identified as a critical need. This not only included questions focusing directly on AOP networks, but also on related topics such as mixture toxicity assessment and the implementation of feedback loops within the AOP framework. A set of two articles has been developed to begin exploring these concepts. In the present article (part I), we consider the derivation of AOP networks in the context of how it differs from the development of individual AOPs. We then propose the use of filters and layers to tailor AOP networks to suit the needs of a given research question or application. We briefly introduce a number of analytical approaches that may be used to characterize the structure of AOP networks. These analytical concepts are further described in a dedicated, complementary article (part II). Finally, we present a number of case studies that illustrate concepts underlying the development, analysis, and application of AOP networks. The concepts described in the present article and in its companion article (which focuses on AOP network analytics) are intended to serve as a starting point for further development of the AOP network concept, and also to catalyze AOP network development and application by the different stakeholder communities. Environ Toxicol Chem 2018;37:1723-1733. © 2018 The Authors. Environmental Toxicology and Chemistry published by Wiley Periodicals, Inc. on behalf of SETAC.

Keywords: Adverse outcome pathway; Adverse outcome pathway network; Network development; Network topology; Predictive toxicology; Risk assessment.


Figures

Figure 1
Figure 1
Graphical representation of the AOP network derivation – refinement – analysis workflow. A primary AOP network is constructed by querying the AOP knowledgebase (AOP-KB). Filters are then applied to derive a filtered network containing AOPs of interest for a given application or research question. Layers can be added in a next step to add data relevant to the application. Finally, the AOP network can be analyzed to produce metrics related to the topology and other properties of the network.
Figure 2
Figure 2
Examples of AOP network analysis concepts and approaches. (A) Network topology analysis can reveal converging, diverging, or mixed patterns. A mixed pattern can take the shape of a bow tie motif. (B) Two different examples of network metrics calculated for the same hypothetical AOP network. The degree of a node (key event, KE) in the network is equal to the number of edges (key event relationships, KERs) connecting the node to the network and is one way of expressing how connected that node is to the network. The path occurrence is the number of times a node (KE) occurs in a path connecting a molecular initiation event (MIE) to an adverse outcome (AO) after evaluating all possible paths between the MIEs and AOs of the network. The path occurrence may be an indication of the relative importance of a node within the overall network.
Figure 3
Figure 3
AOP network for steatosis. The high level of crosstalk between the different receptors and associated signaling pathways complicates the use of existing high-throughput screening data as predictors of a steatotic outcome. This challenge was overcome by identifying a network topology converging into four key events (i.e., lipogenesis, and fatty acid uptake, efflux and oxidation) that were viewed as critical paths leading to steatosis. Assays measuring these points of convergence integrate the complex interplay of upstream events and translate them into measures that are more directly related to the adverse outcome. FA: fatty acid, TAG: triacylglycerol, PI3K: phosphatidylinositol-3-kinase, AKT: protein kinase B, PPAR: peroxisome proliferator-activated receptor, LXR: liver X receptor, CAR: constitutive androstane receptor, PXR: pregnane X receptor, FXR: farnesoid X receptor, RXR: retinoid X receptor.
Figure 4
Figure 4
AOP networks related to disruption of the thyroid axis. (A) Multi-taxon thyroid hormone disruption AOP network including mammalian, amphibian and teleost endpoints. The blue regions illustrate how a taxonomic applicability layer may be used to add relevant data to the primary network representation. The key events highlighted in yellow indicate two major points of convergence/divergence in the network, resembling the “knot” of a bow tie motif. (B) Filtered thyroid AOP network only containing key events that are relevant to fish. The dashed brown area illustrates how additional filtering might be used to further refine the network, e.g. to only include key events that are relevant to specific life stages. The blue area illustrates the use of a layer to indicate the presence of a feedback loop acting on an AOP in the network, and the interaction between the feedback loop and one of the molecular initiating events in the network. IYD: iodotyrosine deiodinase, NIS: sodium-iodide symporter, TPO: thyroperoxidase, DIO: iodothyronine deiodinase, TH: thyroid hormone, T4: thyroxine, T3: triiodothyronine, TRH: thyrotropin-releasing hormone, TSH: thyroid stimulating hormone, thyrotropin, SB: swim bladder. Red negative sign: inhibition processes. Red arrow: DIO inhibition decreases conversion of T4 into T3, thereby inhibiting the feedback inhibition of T3 on TRH and TSH synthesis.

References

    1. Angrish MM, Kaiser JP, McQueen CA, Chorley BN. Tipping the Balance: Hepatotoxicity and the 4 Apical Key Events of Hepatic Steatosis. Toxicol Sci. 2016;150(2):261–268. - PubMed
    1. Angrish MM, McQueen CA, Cohen-Hubal E, Rooney JP, Bruno M, Ge Y, Chorley BN. Mechanistic Toxicity Tests Based on an Adverse Outcome Pathway Network for Hepatic Steatosis. Toxicol Sci. 2017;159(1):159–169. - PMC - PubMed
    1. Ankley GT, Bennett RS, Erickson RJ, Hoff DJ, Hornung MW, Johnson RD, Mount DR, Nichols JW, Russom CL, Schmieder PK, Serrrano JA, Tietge JE, Villeneuve DL. Adverse outcome pathways: a conceptual framework to support ecotoxicology research and risk assessment. Environ Toxicol Chem. 2010;29(3):730–741. - PubMed
    1. Bell SM, Angrish MM, Wood CE, Edwards SW. Integrating Publicly Available Data to Generate Computationally Predicted Adverse Outcome Pathways for Fatty Liver. Toxicol Sci. 2016;150(2):510–20. - PubMed
    1. Cavallin JE, Ankley GT, Blackwell BR, Blanksma CA, Fay KA, Jensen KM, Kahl MD, Knapen D, Kosian PA, Poole ST, Randolph EC, Schroeder AL, Vergauwen L4, Villeneuve DL. Impaired swim bladder inflation in early life stage fathead minnows exposed to a deiodinase inhibitor, iopanoic acid. Environ Toxicol Chem. 2017;36(11):2942–2952. - PMC - PubMed

Publication types

Substances

LinkOut - more resources