. 2018 Mar 8;555(7695):256-259.
doi: 10.1038/nature25784. Epub 2018 Feb 28.

The SMAD2/3 interactome reveals that TGFβ controls m6A mRNA methylation in pluripotency

Affiliations

The SMAD2/3 interactome reveals that TGFβ controls m6A mRNA methylation in pluripotency

Alessandro Bertero et al. Nature. .

Abstract

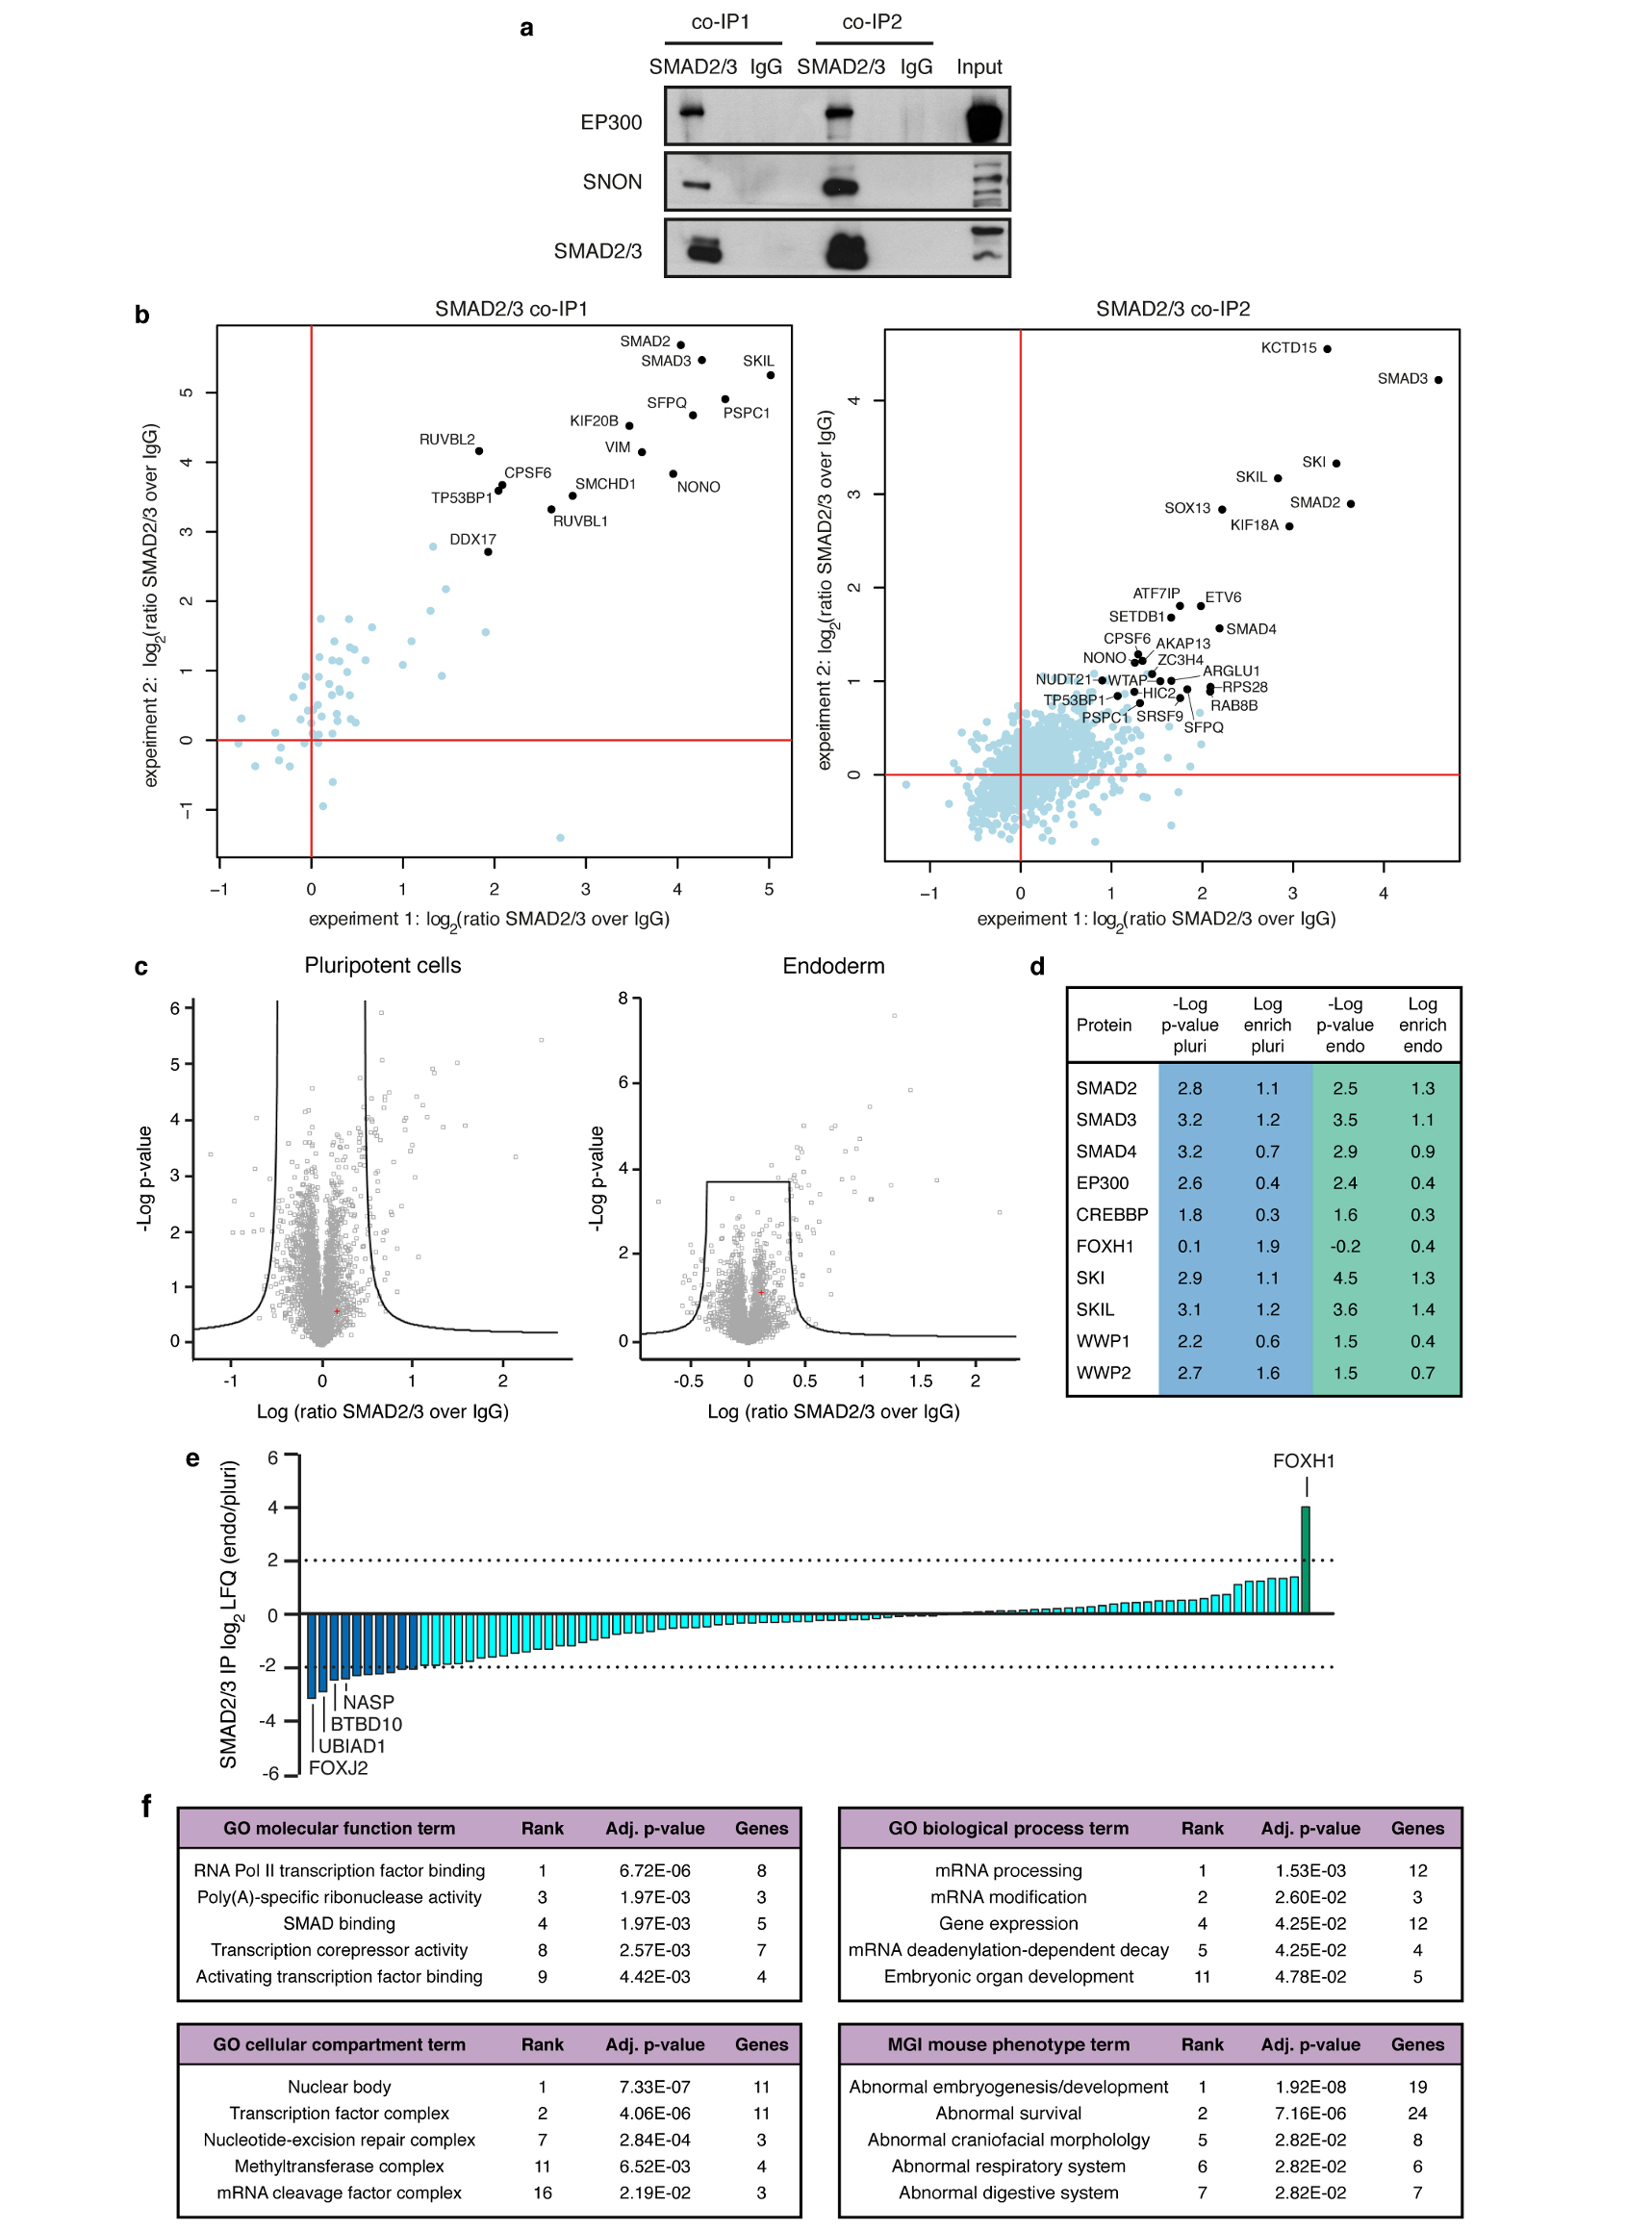
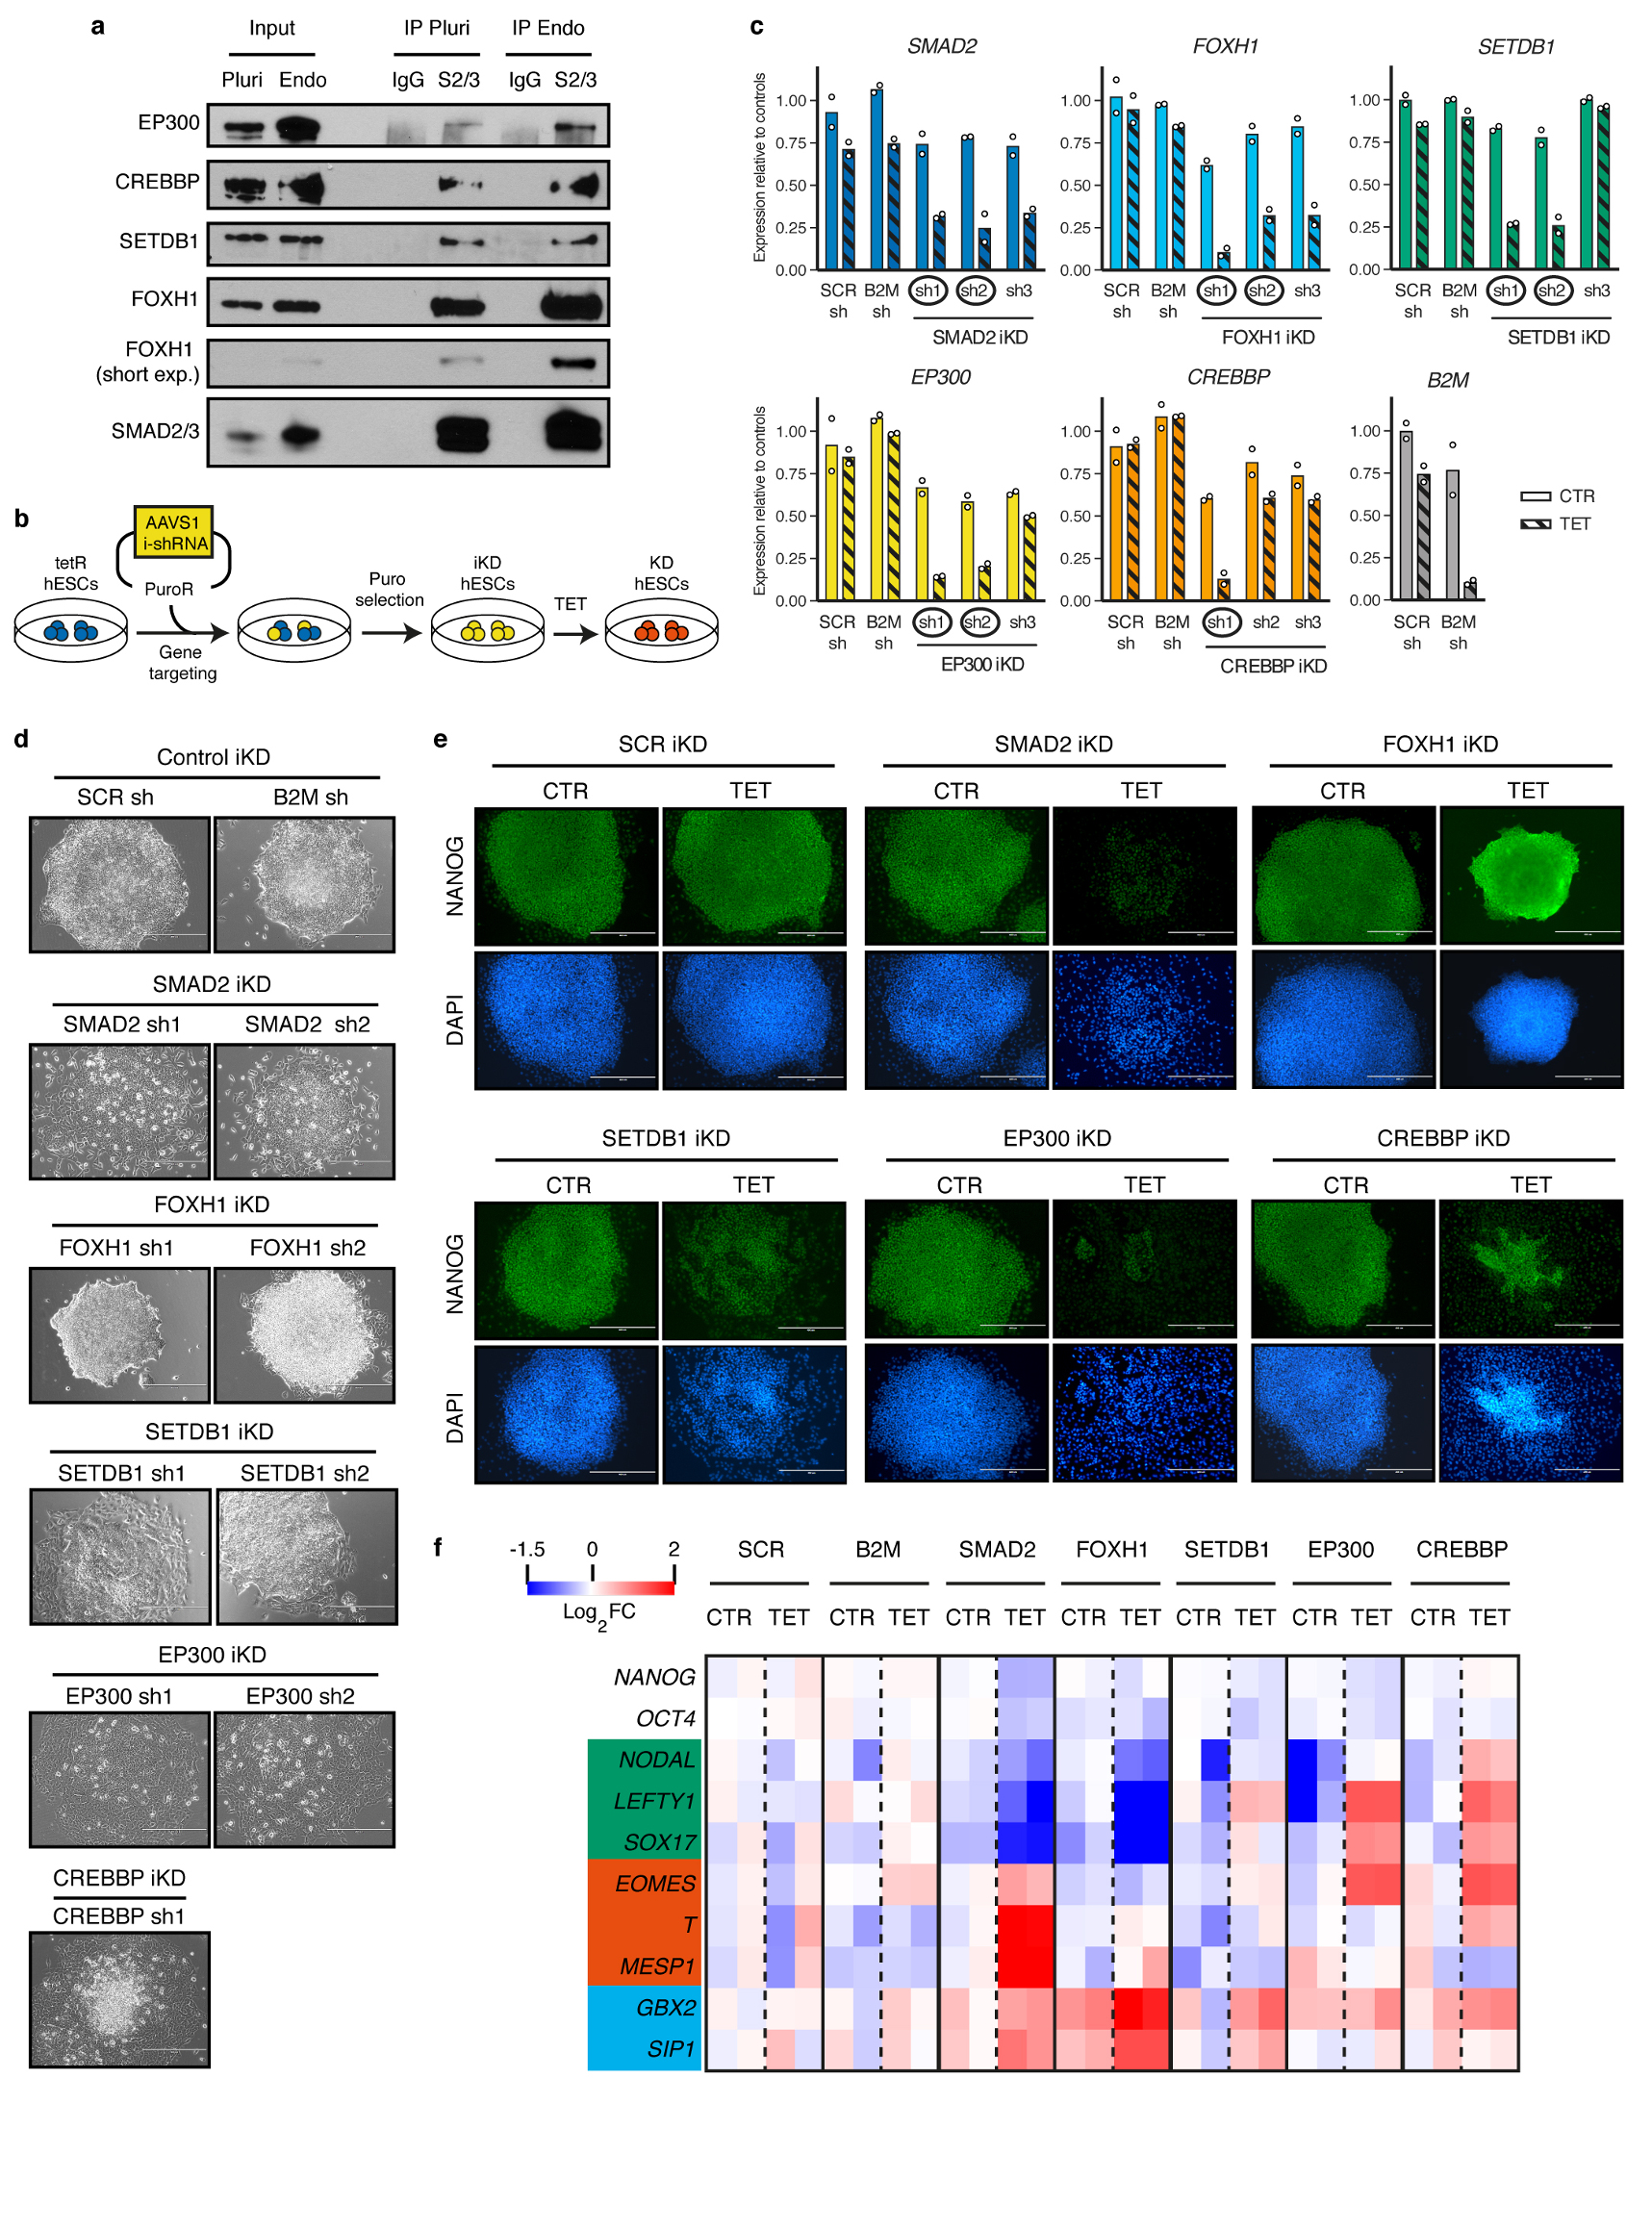
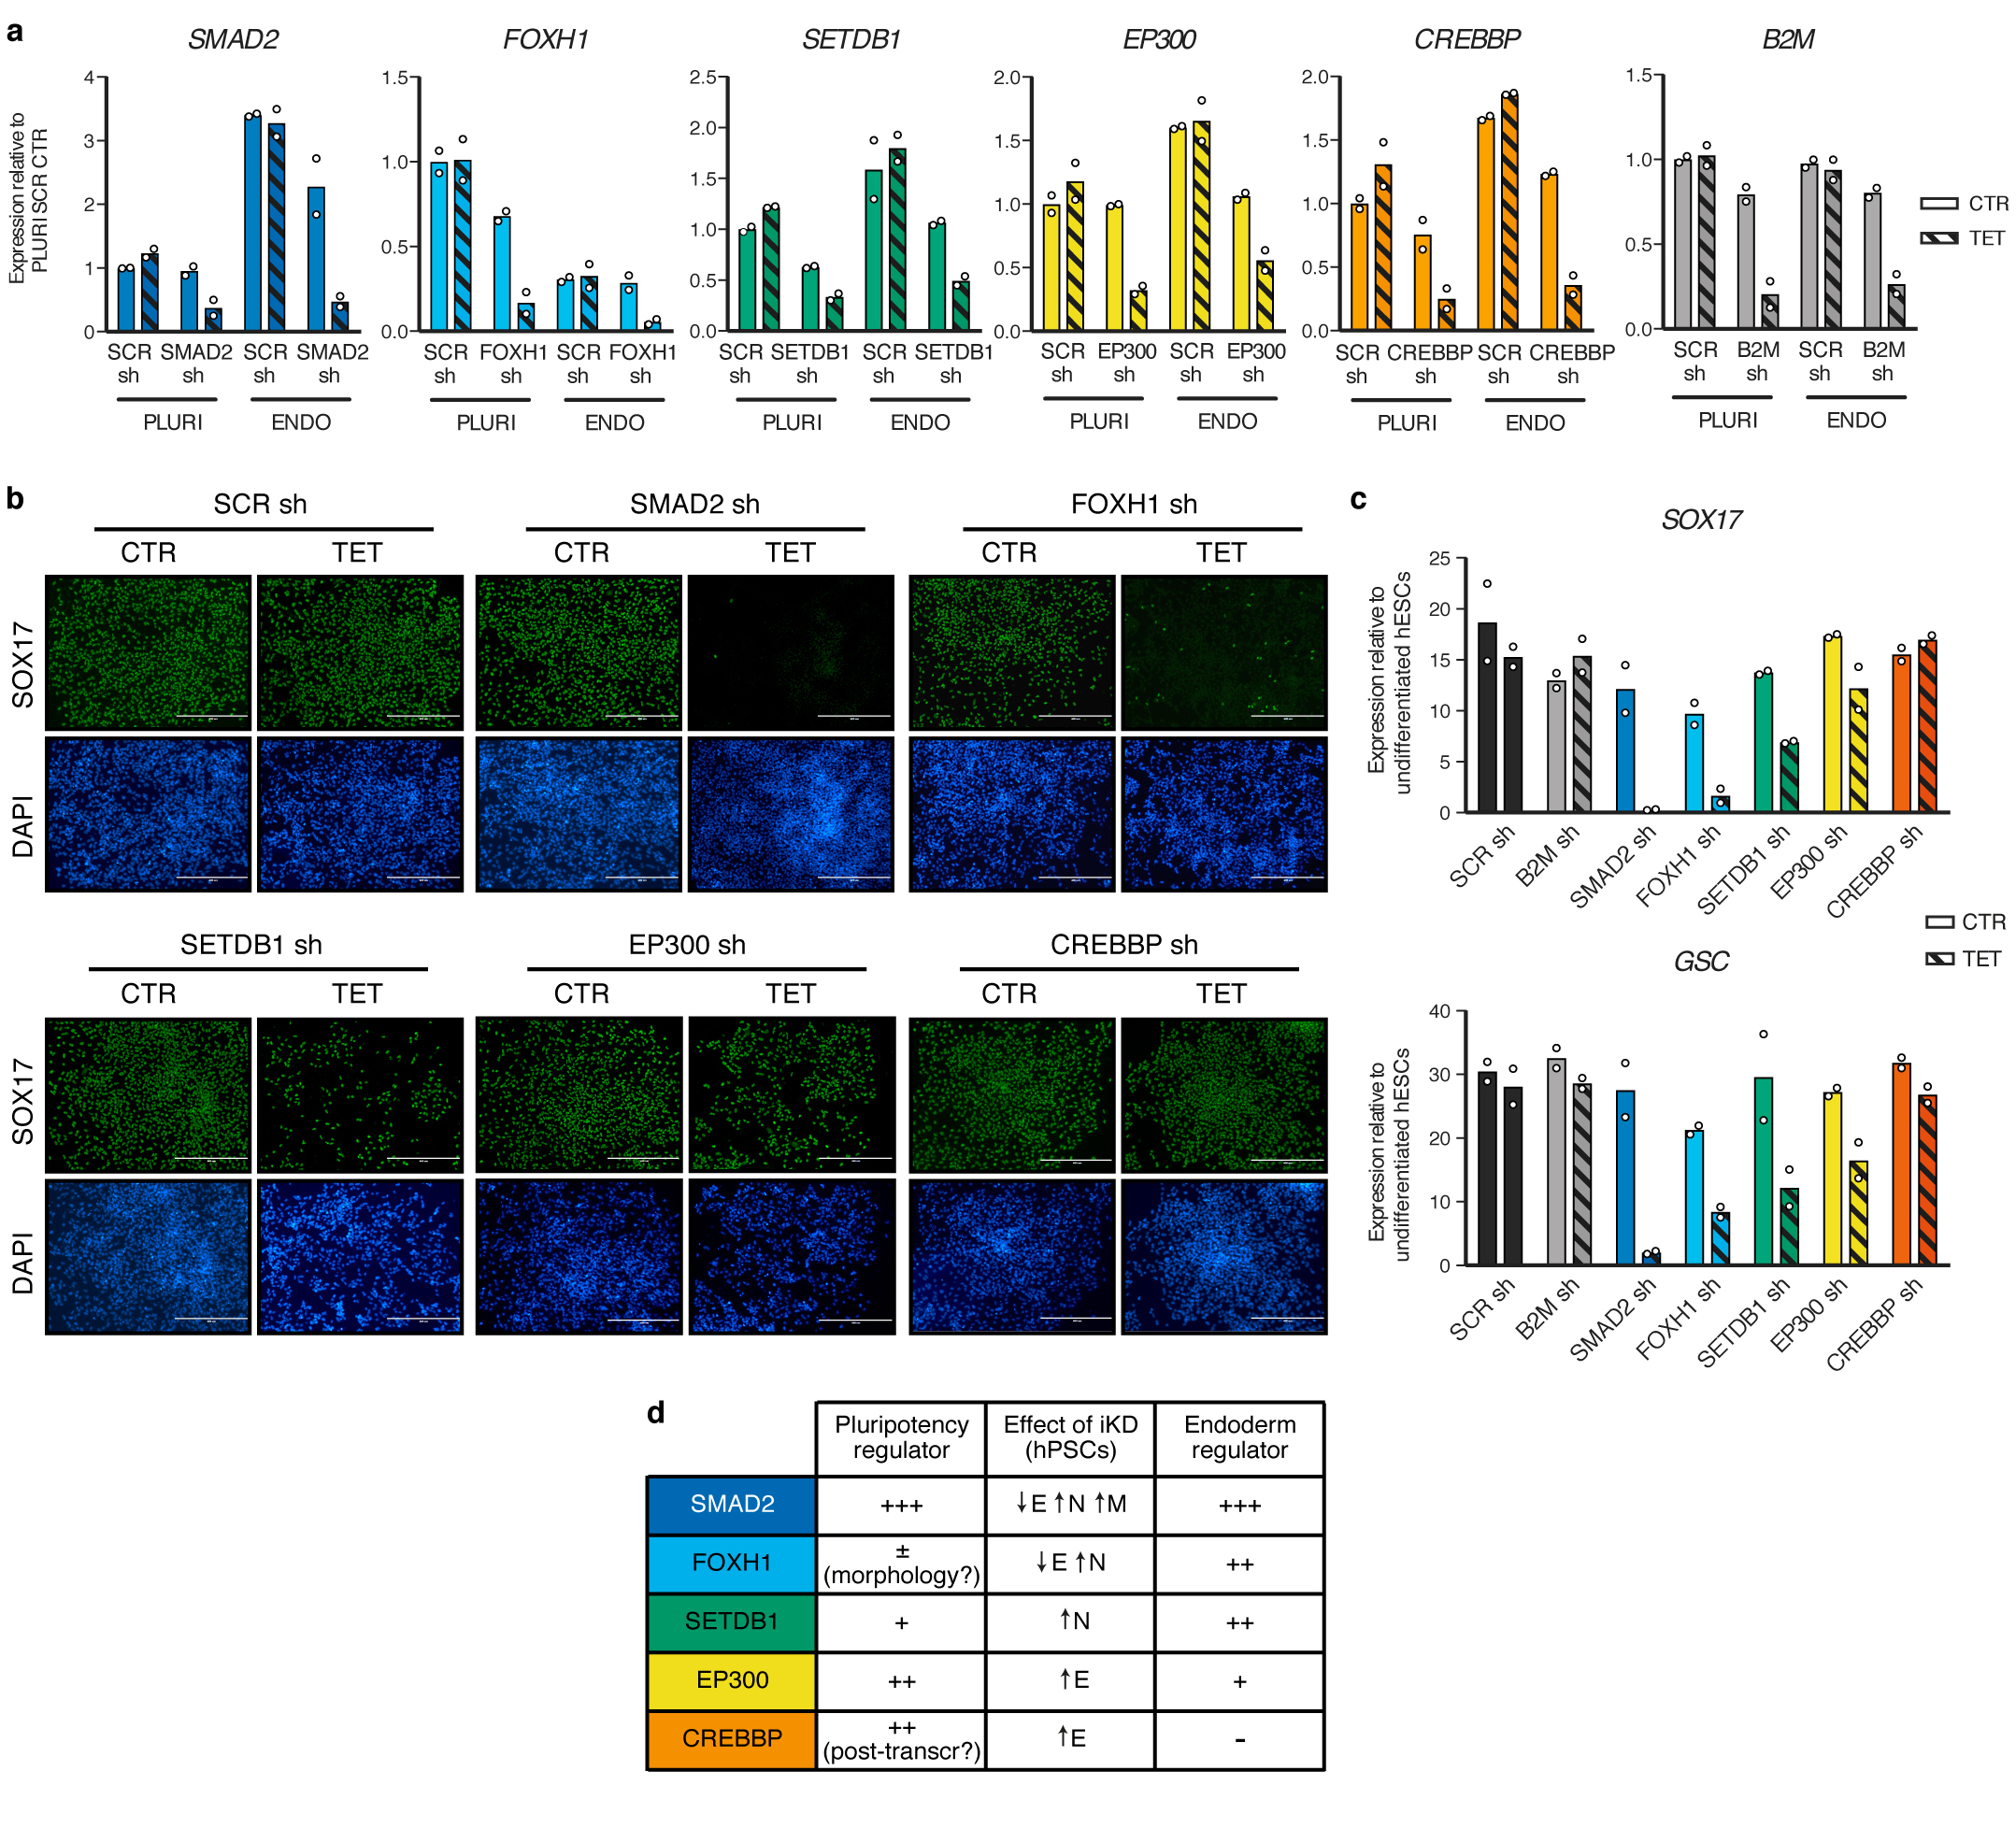
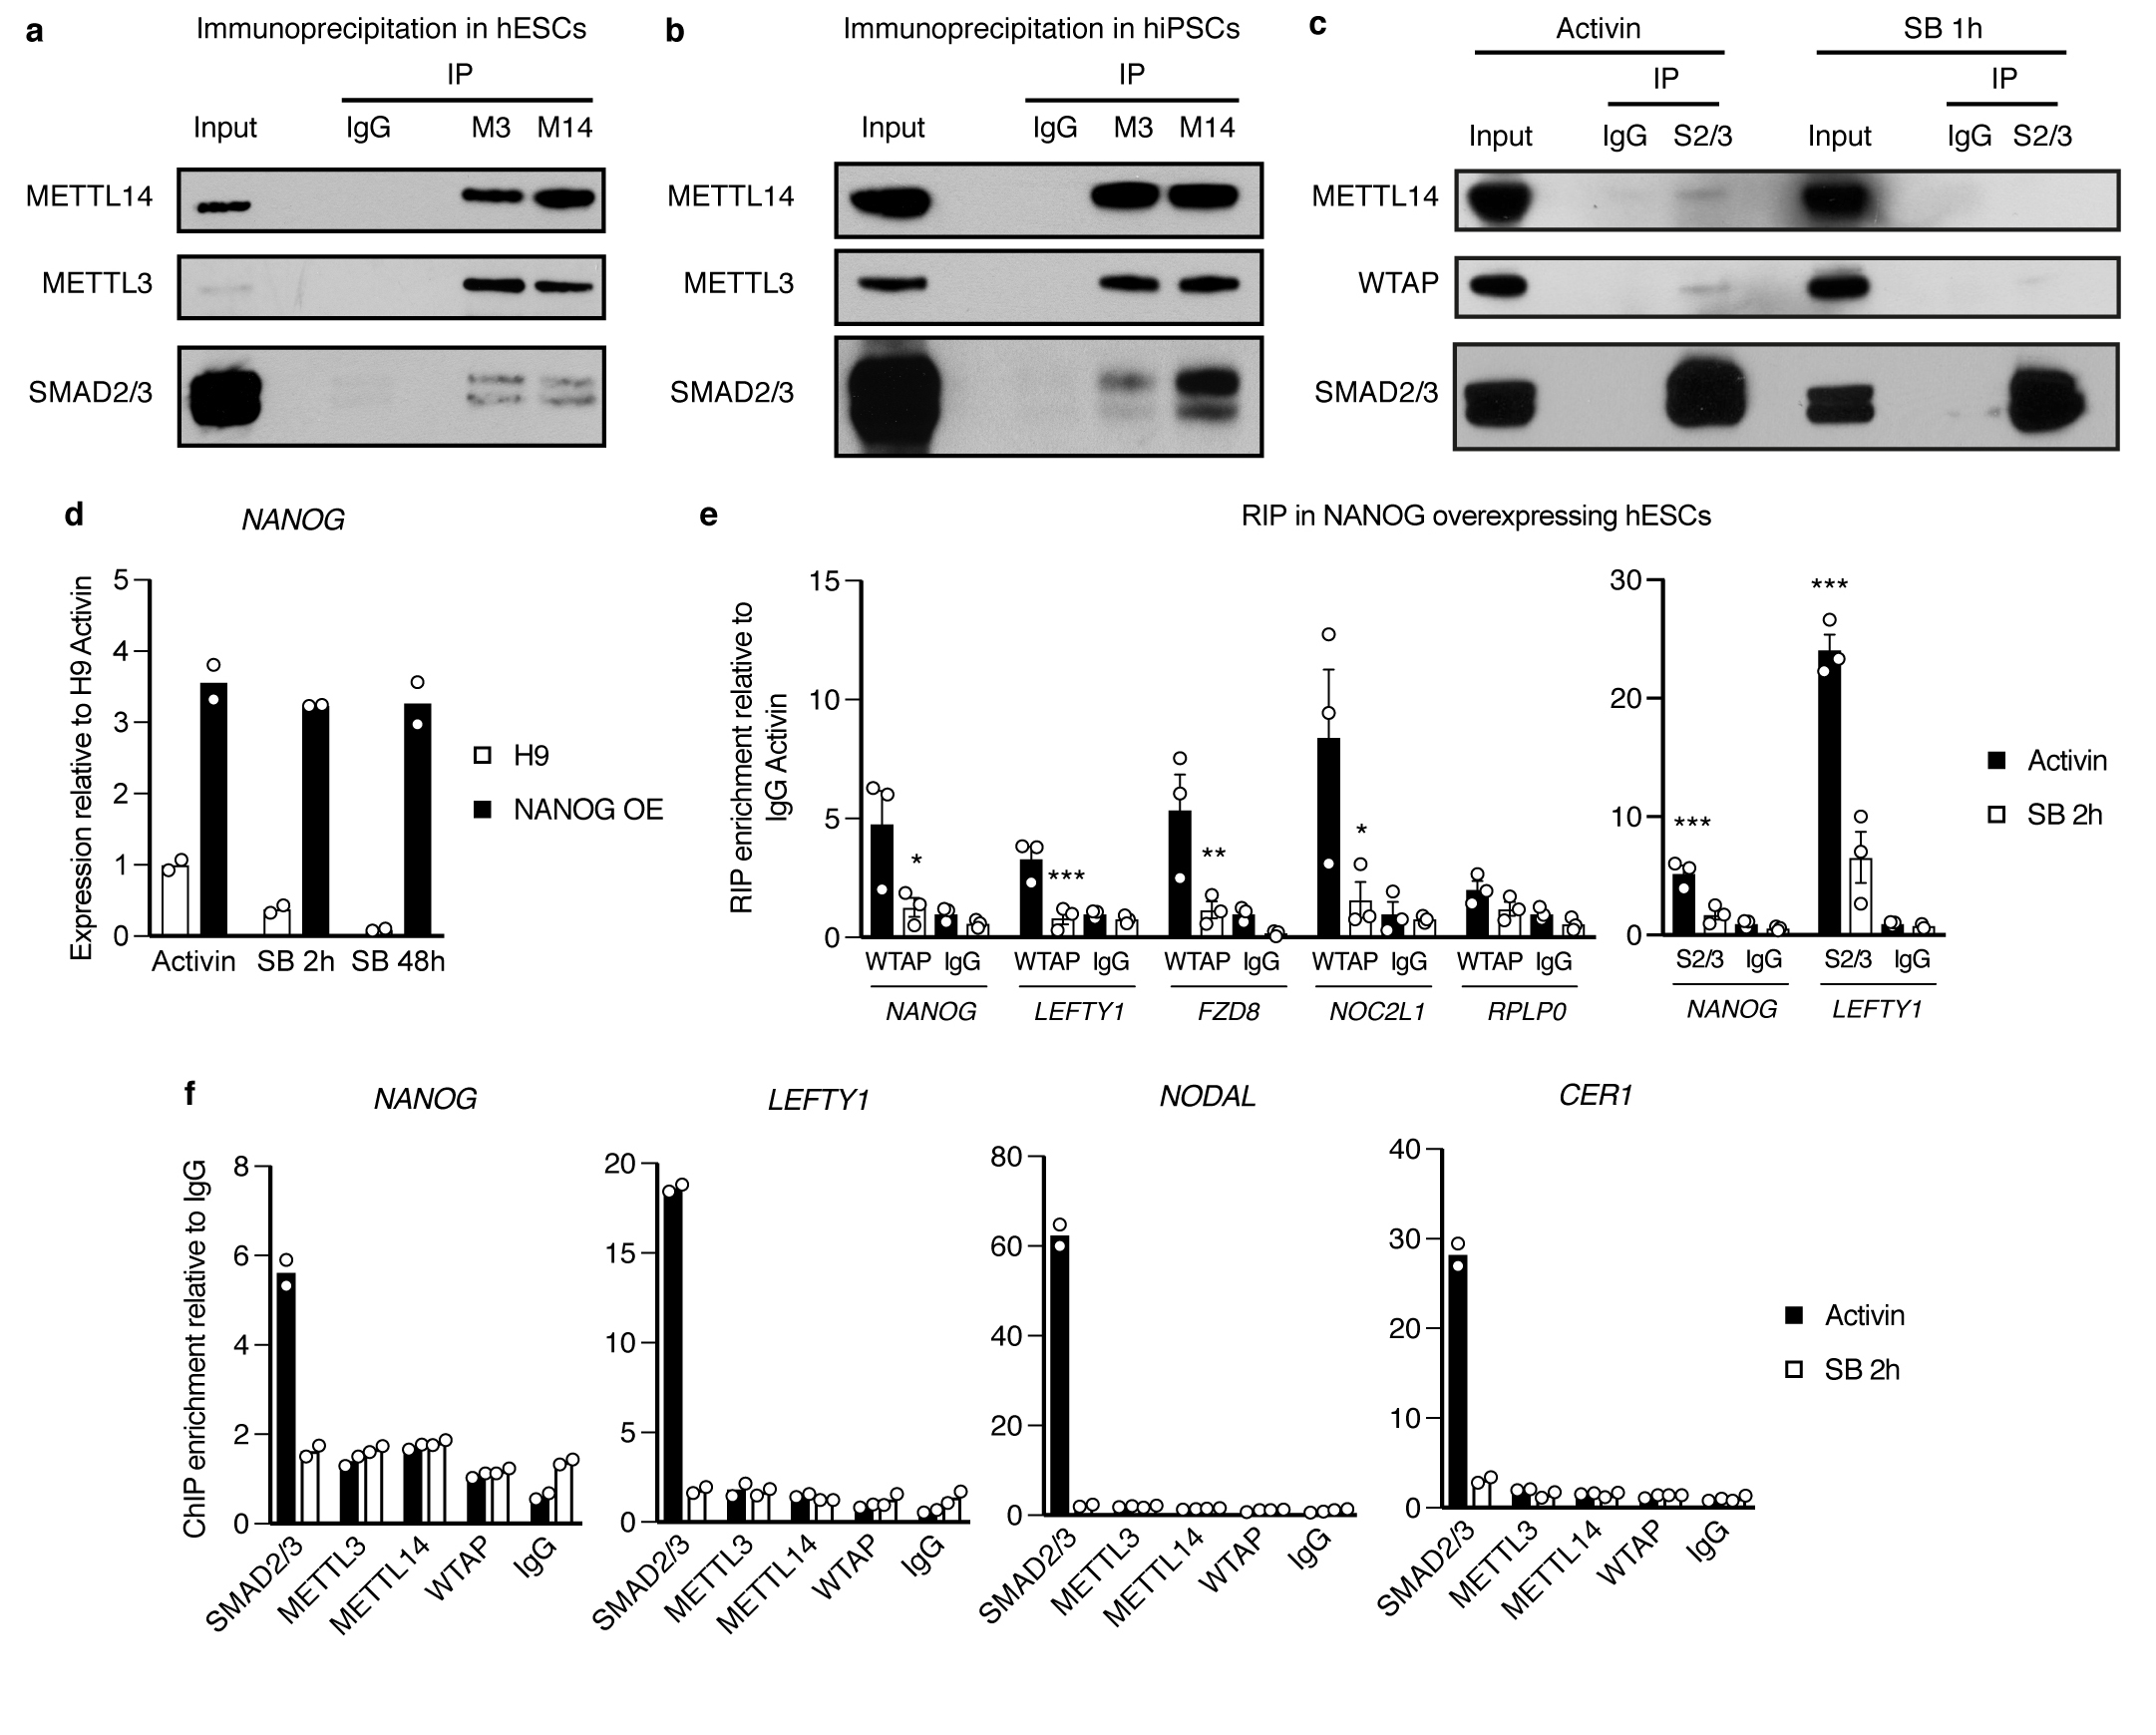
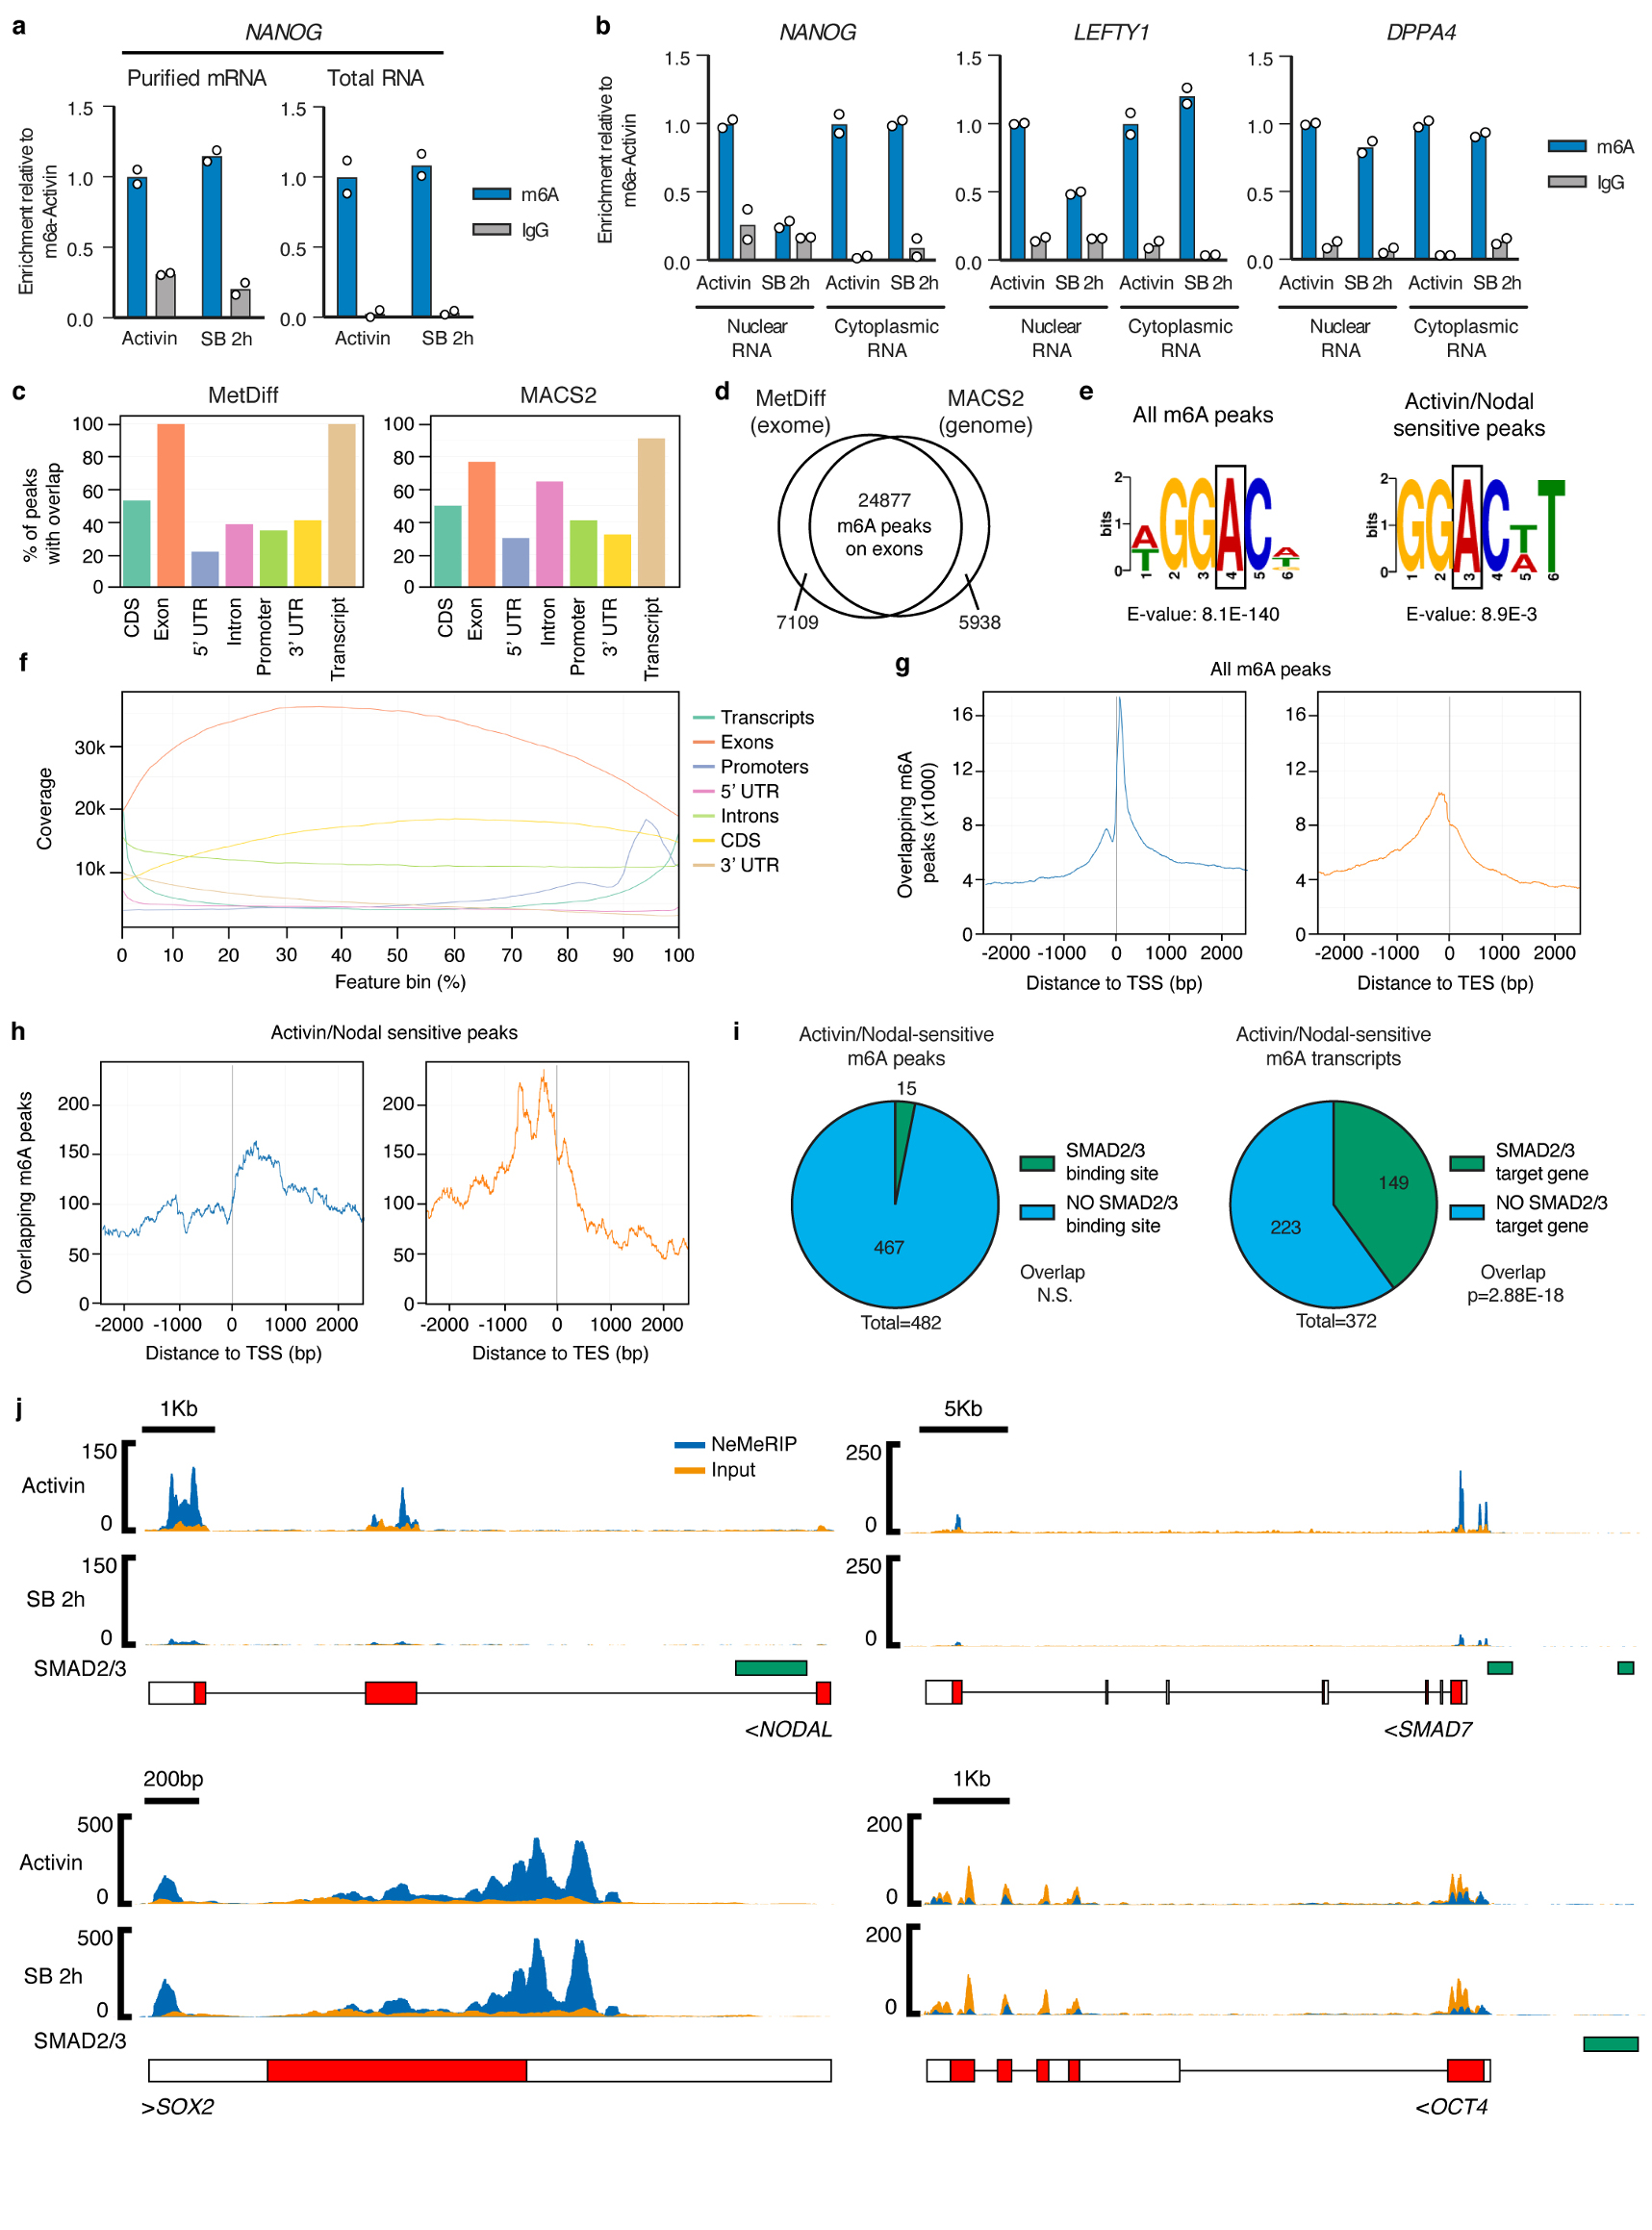
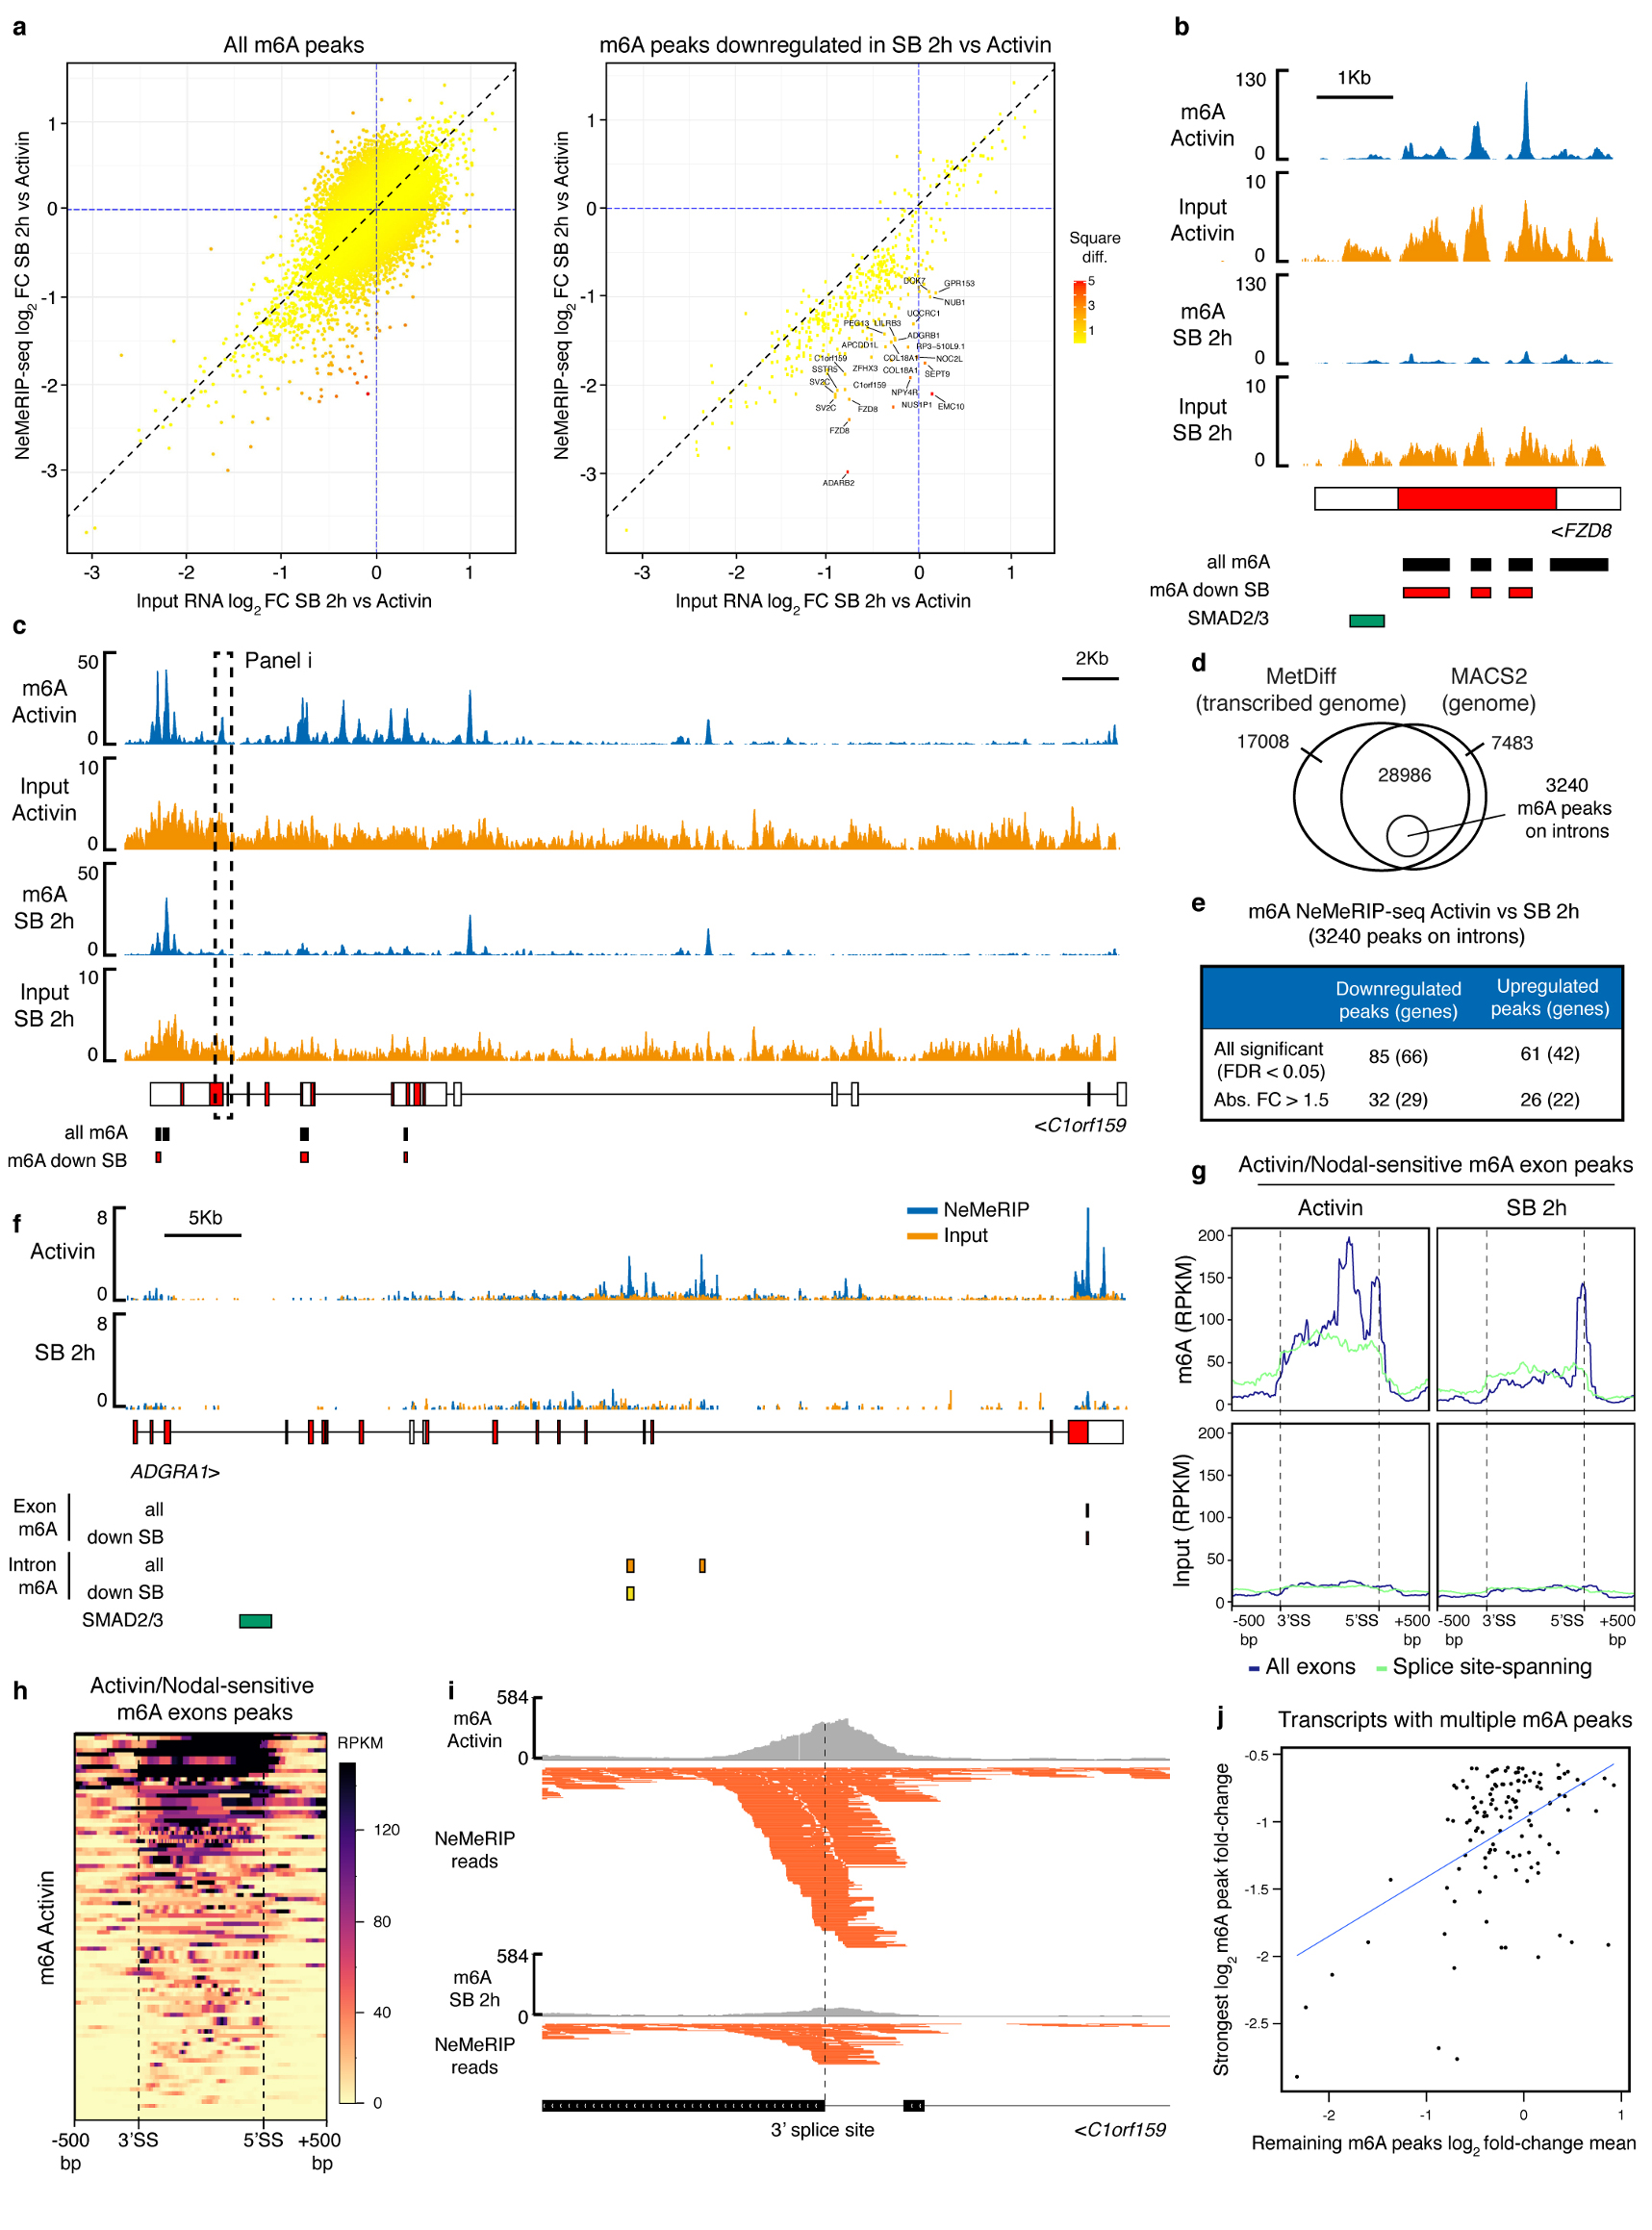
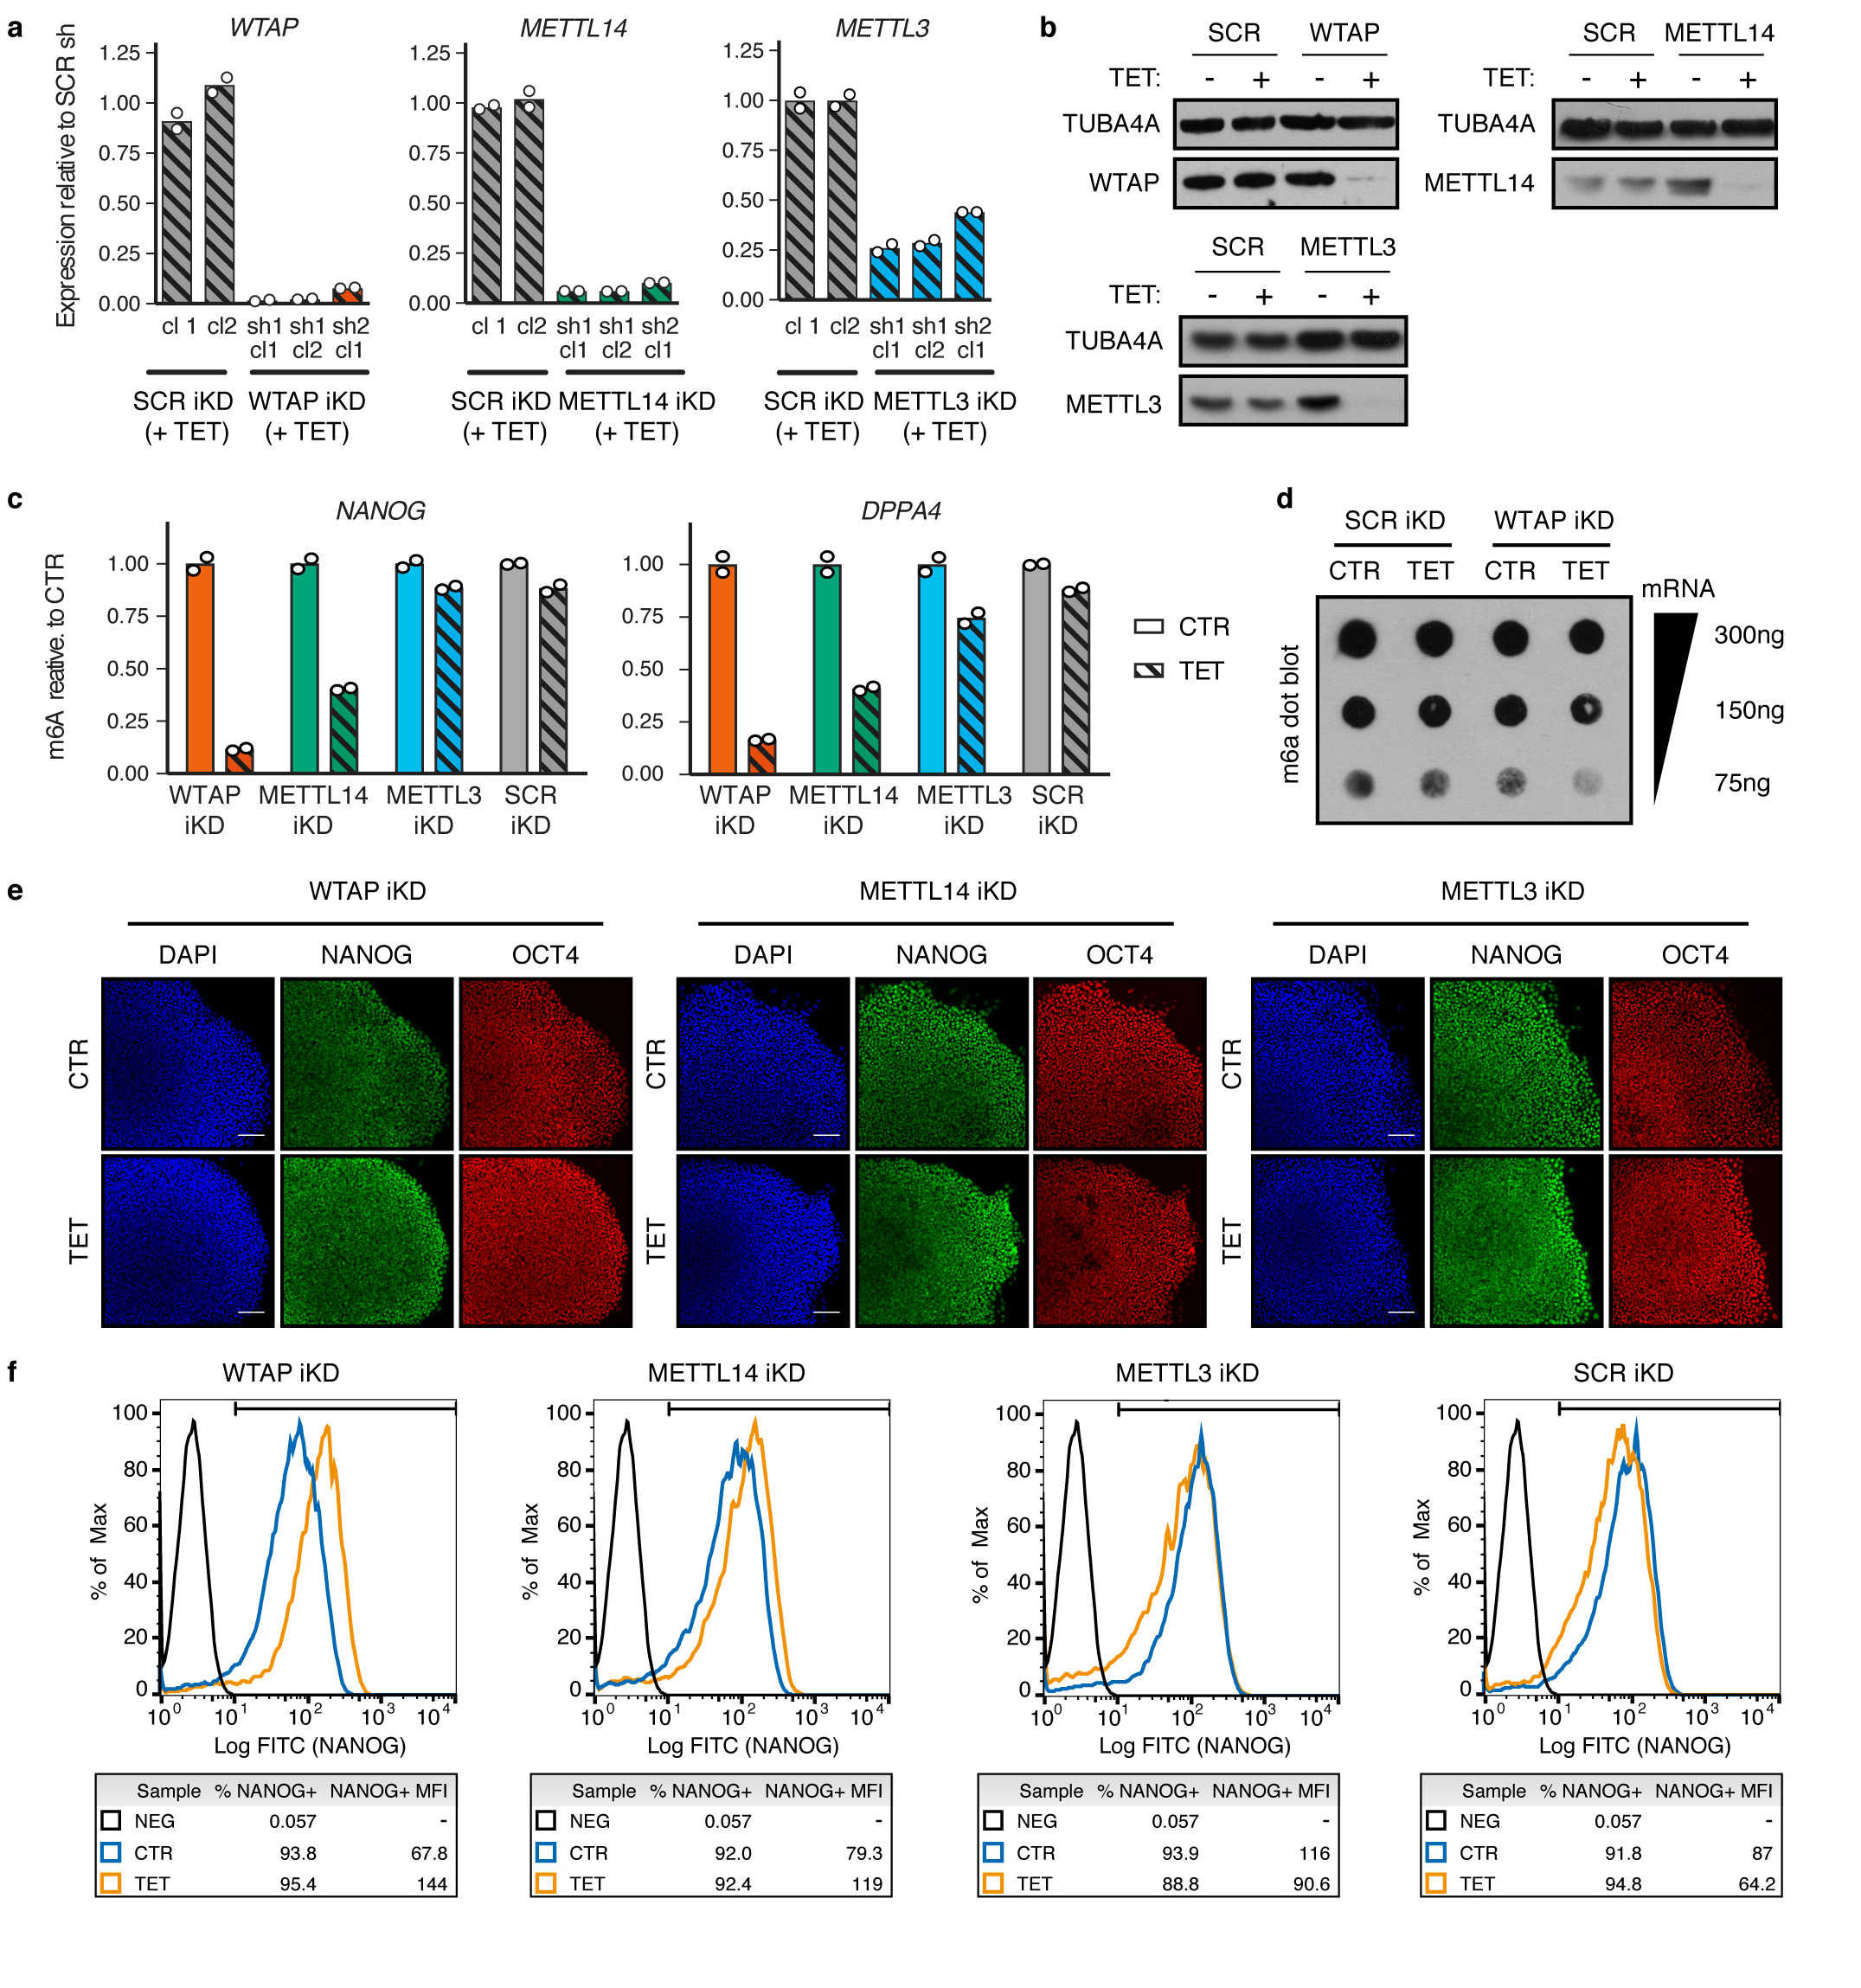
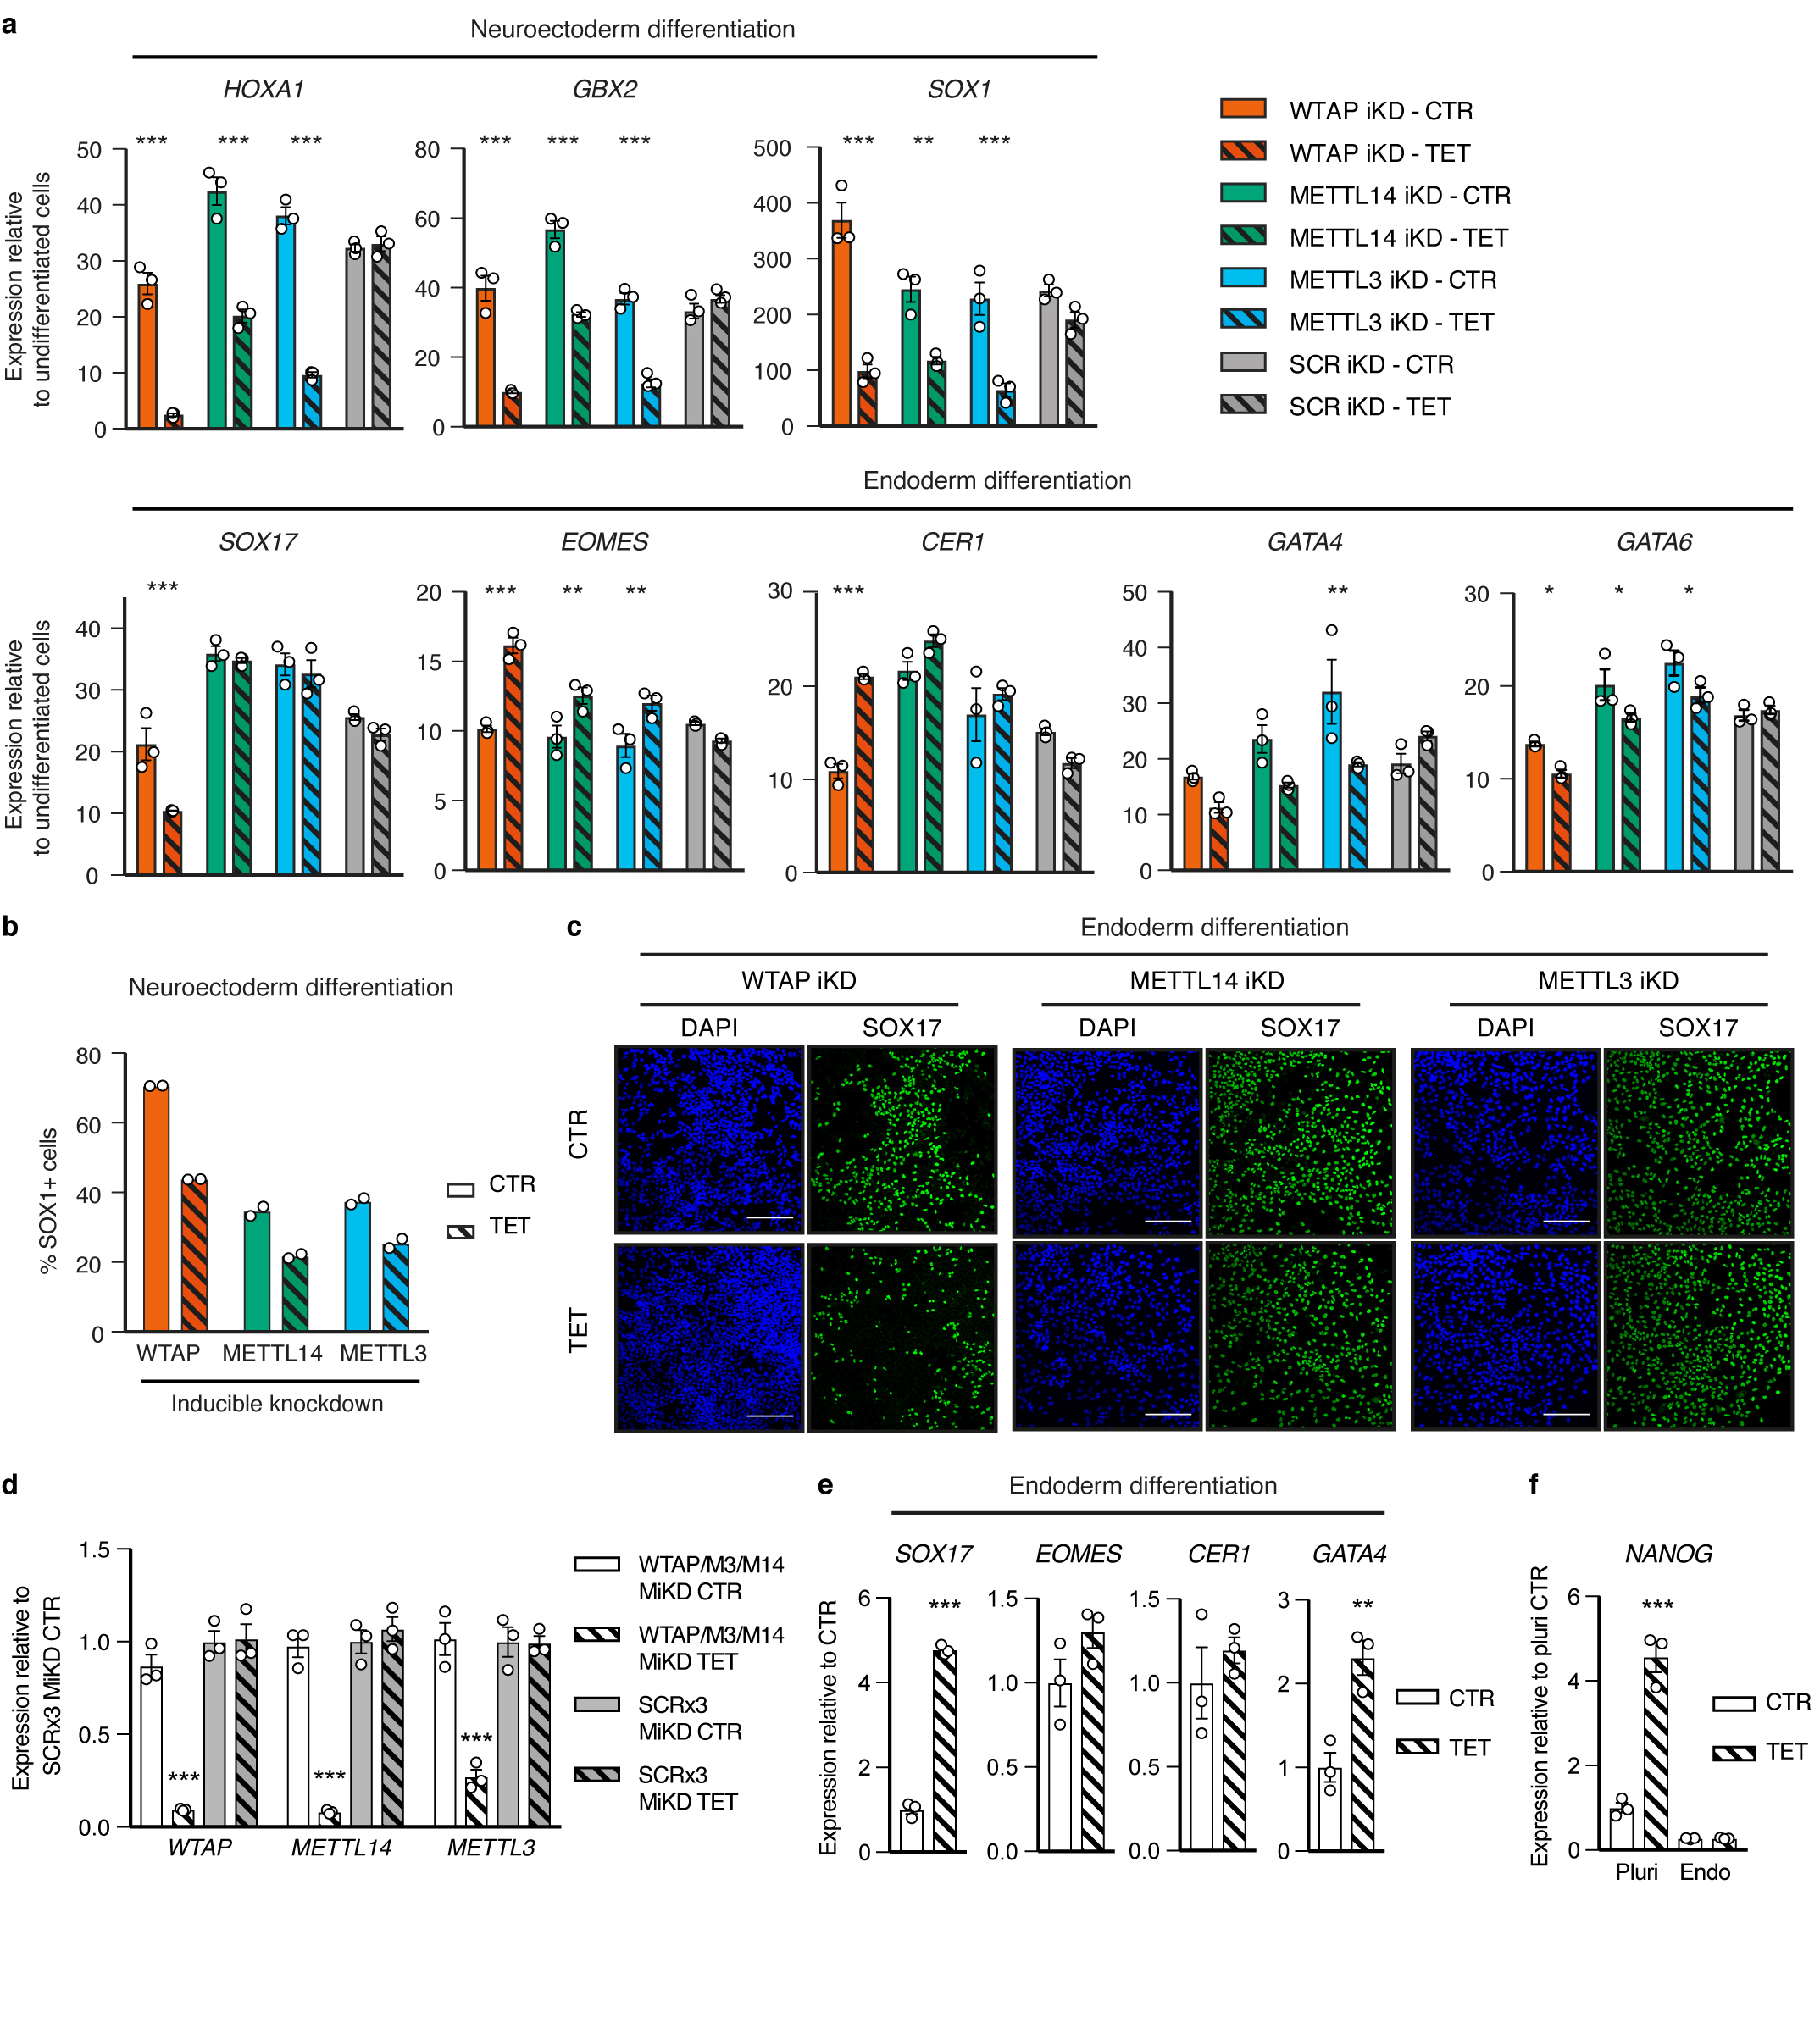
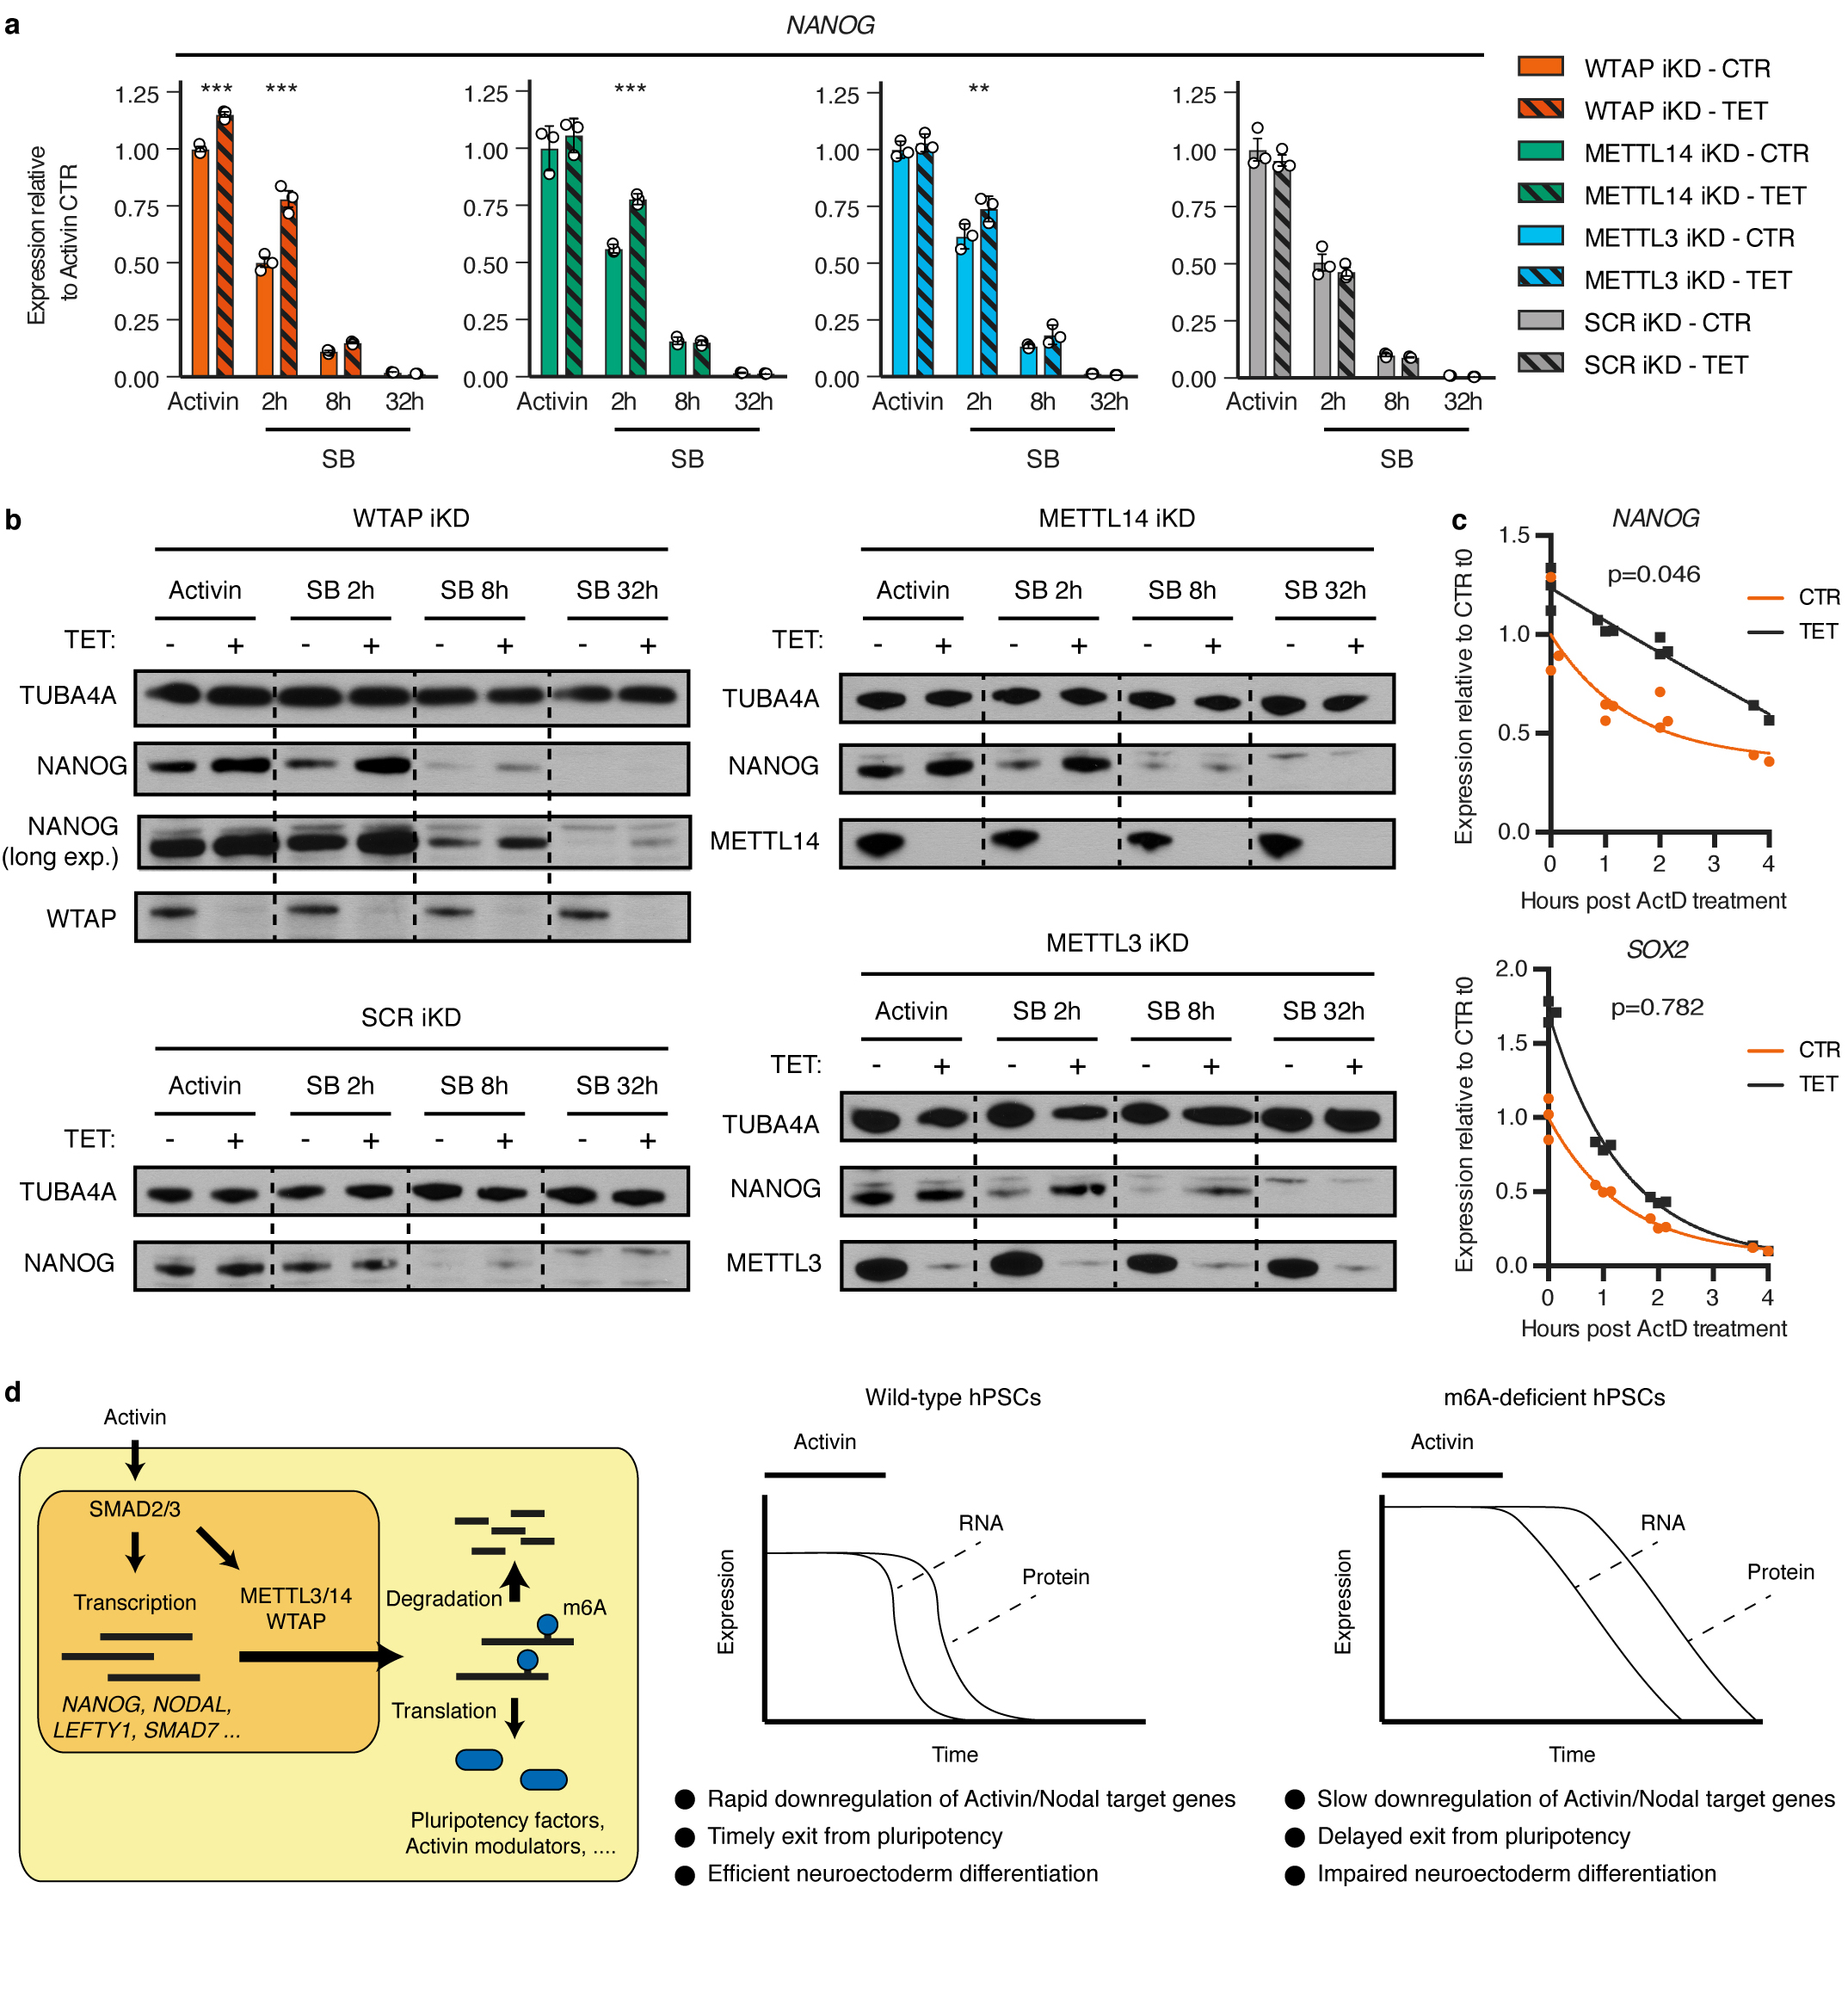
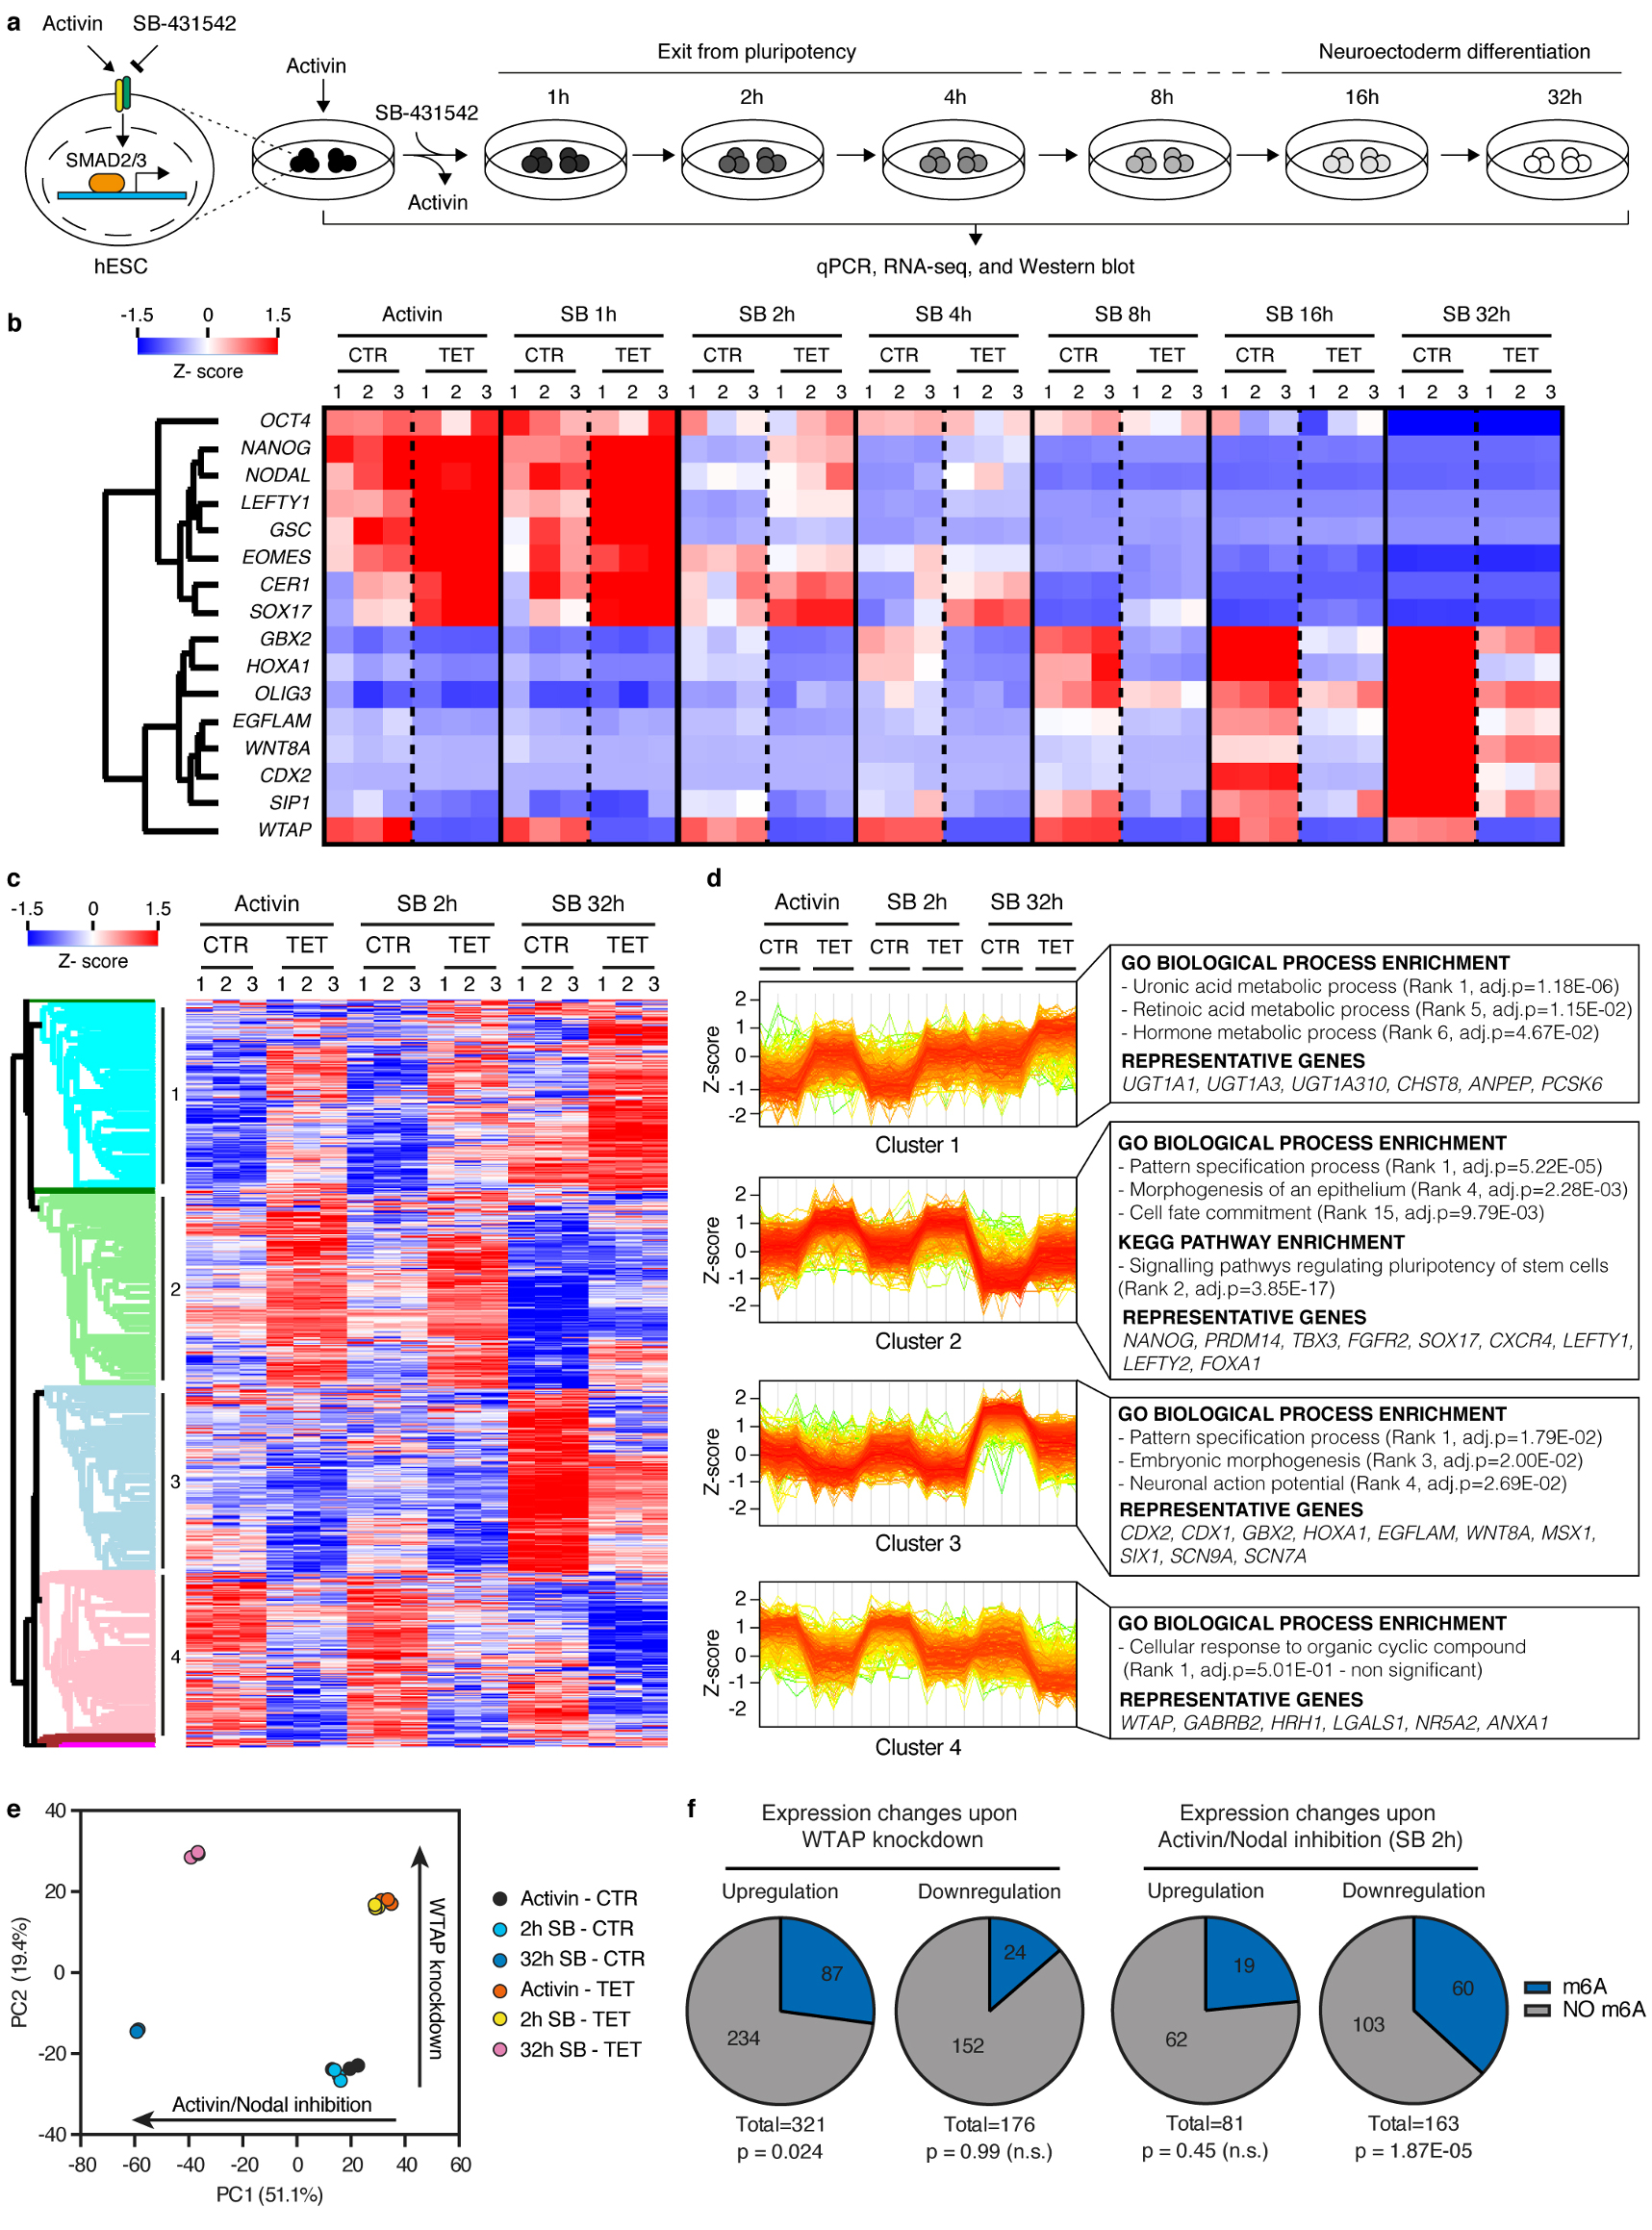
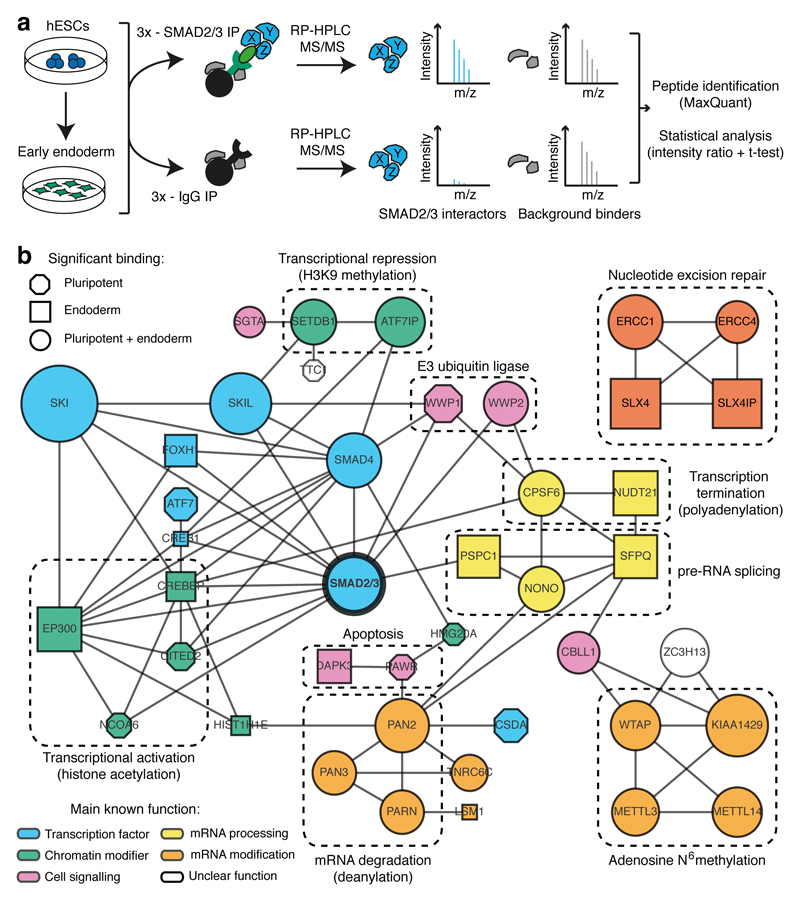
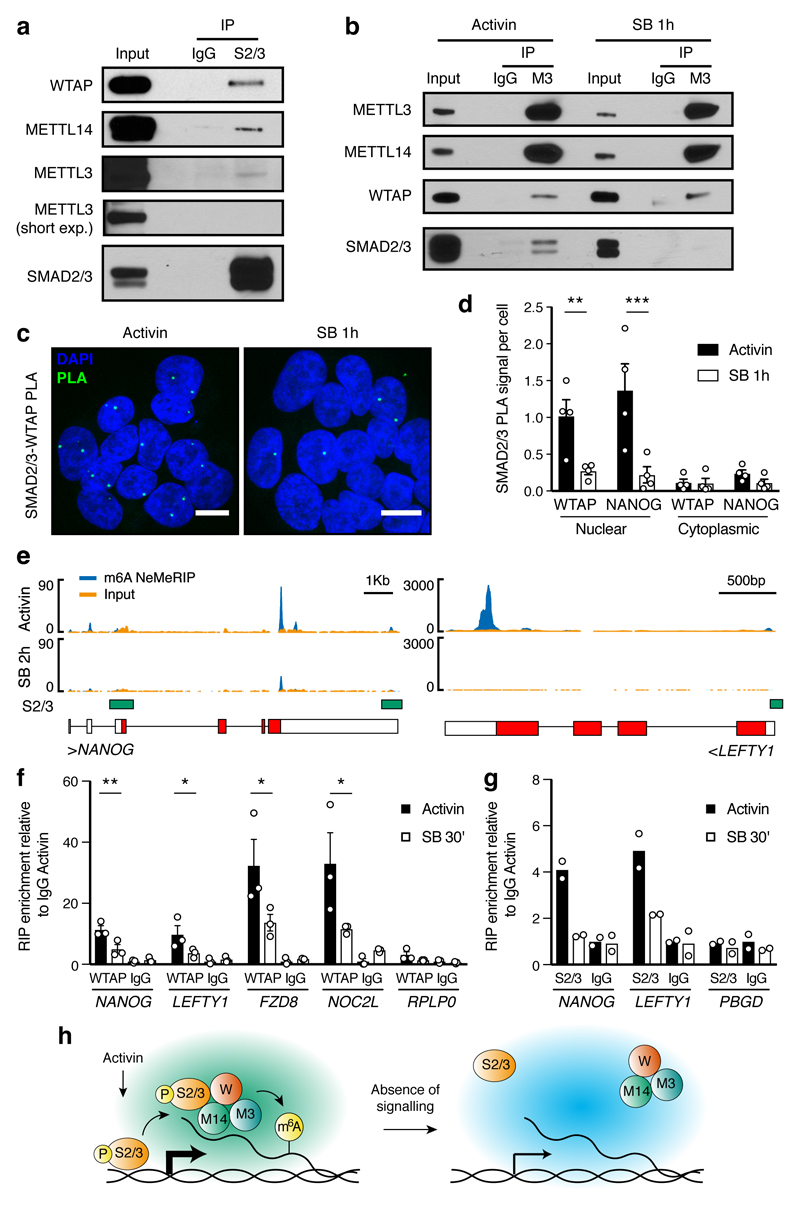
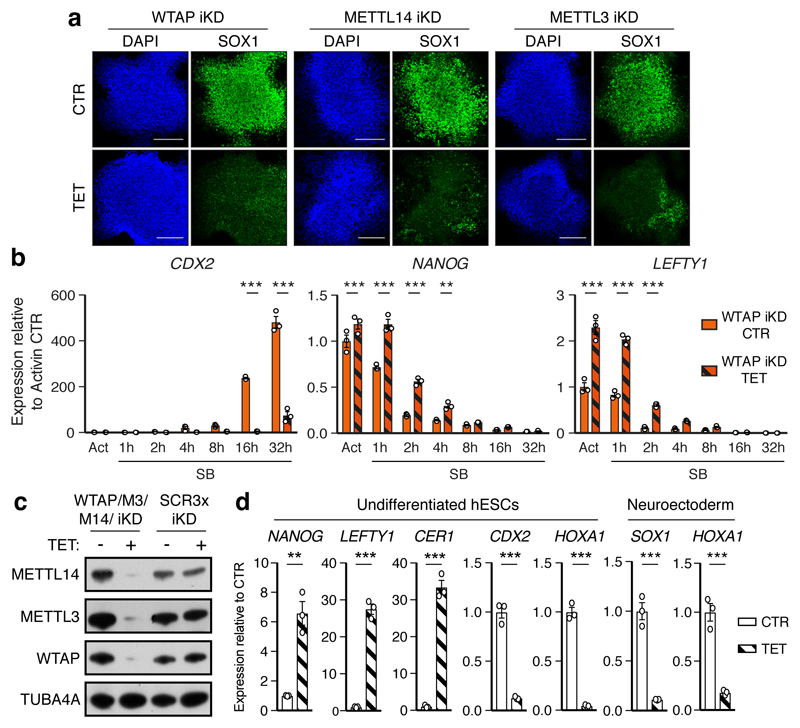
The TGFβ pathway has essential roles in embryonic development, organ homeostasis, tissue repair and disease. These diverse effects are mediated through the intracellular effectors SMAD2 and SMAD3 (hereafter SMAD2/3), whose canonical function is to control the activity of target genes by interacting with transcriptional regulators. Therefore, a complete description of the factors that interact with SMAD2/3 in a given cell type would have broad implications for many areas of cell biology. Here we describe the interactome of SMAD2/3 in human pluripotent stem cells. This analysis reveals that SMAD2/3 is involved in multiple molecular processes in addition to its role in transcription. In particular, we identify a functional interaction with the METTL3-METTL14-WTAP complex, which mediates the conversion of adenosine to N6-methyladenosine (m6A) on RNA. We show that SMAD2/3 promotes binding of the m6A methyltransferase complex to a subset of transcripts involved in early cell fate decisions. This mechanism destabilizes specific SMAD2/3 transcriptional targets, including the pluripotency factor gene NANOG, priming them for rapid downregulation upon differentiation to enable timely exit from pluripotency. Collectively, these findings reveal the mechanism by which extracellular signalling can induce rapid cellular responses through regulation of the epitranscriptome. These aspects of TGFβ signalling could have far-reaching implications in many other cell types and in diseases such as cancer.


Conflict of interest statement

No competing financial interests are declared.

Figures

Extended Data Figure 1
Extended Data Figure 1. Optimized SMAD2/3 co-immunoprecipitation protocol to define its interactome in hPSCs and early endoderm cells.
(a) Western blots of SMAD2/3 or control (IgG) immunoprecipitations (IPs) from nuclear extracts of hESCs following the co-IP1 or co-IP2 protocols. Input is 5% of the material used for IP. Results are representative of two independent experiments. For gel source data, see Supplementary Figure 1. (b) Scatter plots of the log2 ratios of label-free quantification (LFQ) intensities for proteins identified by quantitative mass spectrometry in SMAD2/3 co-IPs compared with IgG negative control co-IPs. The experiments were performed from nuclear extracts of hESCs. The SMAD2/3 and IgG negative control co-IPs were differentially labelled post-IP using the dimethyl method, followed by a combined run of the two samples in order to compare the abundance of specific peptides and identify enriched ones. The values for technical dye-swap duplicates are plotted on different axes, and proteins whose enrichment was significant (significance B<0.01) are shown in black and named. As a result of this comparison between the two co-IP protocols, co-IP2 was selected for further experiments (see Supplementary Discussion). (c) Volcano plots of statistical significance against fold-change for proteins identified by label-free quantitative mass spectrometry in SMAD2/3 or IgG negative control IPs in pluripotent hESCs or early endoderm (see Fig. 1a). The black lines indicate the threshold used to determine specific SMAD2/3 interactors, which are located to the right (n=3 co-IPs; one-tailed t-test: permutation-based FDR<0.05). (d) Selected results of the analysis described in panel c for SMAD2, SMAD3, and selected known bona fide SMAD2/3 binding partners (full results can be found in Supplementary Table 1). (e) Average label free quantification (LFQ) intensity log2 ratios in endoderm (Endo) and pluripotency (Pluri) for all SMAD2/3 interactors. Differentially enriched proteins are shown as green and blue bars. (f) Selected results from gene ontology (GO) enrichment analysis, and enrichment analysis for mouse phenotypes annotated in the Mouse Genomics Informatics (MGI) database. All SMAD2/3 putative interacting proteins were considered for this analysis (n=89 proteins; Fisher’s exact test followed by Benjamini-Hochberg correction for multiple comparisions). For each term, its rank in the analysis, the adjusted p-value, and the number of associated genes are reported.
Extended Data Figure 2
Extended Data Figure 2. Functional characterization of SMAD2/3 transcriptional and epigenetic cofactors in hPSCs.
(a) Western blots of SMAD2/3 or control (IgG) immunoprecipitations (IPs) from nuclear extracts of pluripotent hESCs (Pluri), or hESCs differentiated into endoderm for 36h (Endo). Input is 5% of the material used for IP. Results are representative of two independent experiments. (b) Schematic of the experimental approach for the generation of tetracycline-inducible knockdown (iKD) hESC lines for SMAD2/3 cofactors. (c) qPCR screening of iKD hESCs cultured in absence (CTR) or presence of tetracycline for 3 days (TET). Three distinct shRNAs were tested for each gene. Expression is shown as normalized on the average level in hESCs carrying negative control shRNAs (scrambled, SCR, or against B2M) and cultured in absence of tetracycline. The mean is indicated, n=2 independent clonal pools. Note than for the B2M shRNA only the SCR shRNA was used as negative control. shRNAs selected for further experiments are circled. (d) Phase contrast images of iKD hESCs expressing the indicated shRNAs (sh) and cultured in presence of tetracycline for 6 days to induce knockdown. Scale bars: 400μm. Results are representative of two independent experiments. (e) Immunofluorescence for the pluripotency factor NANOG in iKD hESCs for the indicated genes cultured in absence (CTR) or presence of tetracycline (TET) for 6 days. DAPI: nuclear staining; scale bars: 400μm. Results are representative of two independent experiments. (f) Heatmap summarizing qPCR analyses of iKD hESCs cultured as in panel e. log2 fold-changes (FC) are compared to SCR CTR (n=2 clonal pools). Germ layer markers are grouped in boxes (green: endoderm; red: mesoderm; blue: neuroectoderm).
Extended Data Figure 3
Extended Data Figure 3. Functional characterization of SMAD2/3 transcriptional and epigenetic cofactors during endoderm differentiation.
(a) qPCR validation of inducible knockdown (iKD) hESCs in pluripotency (PLURI) and following endoderm differentiation (ENDO). Pluripotent cells were cultured in absence (CTR) or presence of tetracycline (TET) for 6 days. For endoderm differentiation, tetracycline treatment was initiated in undifferentiated hESCs for 3 days in order to ensure gene knockdown at the start of endoderm specification, and was then maintained during differentiation (3 days). For each gene, the shRNA resulting in the strongest level of knockdown in hPSCs was selected (refer to Extended Data Fig. 2). Expression is shown as normalized to the average level in pluripotent hESCs carrying a scrambled (SCR) control shRNAs and cultured in absence of tetracycline. The mean is indicated, n=2 independent clonal pools. (b) Immunofluorescence for the endoderm marker SOX17 following endoderm differentiation of iKD hESCs expressing the indicated shRNAs (sh) and cultured as described in panel a. DAPI shows nuclear staining. Scale bars: 400μm. Results are representative of two independent experiments. (c) qPCR following endoderm differentiation of iKD hESCs. The mean is indicated, n=2 independent clonal pools. (d) Table summarizing the phenotypic results presented in Extended Data Fig. 2 and in this figure. E: endoderm; N: neuroectoderm; M: mesoderm.
Extended Data Figure 4
Extended Data Figure 4. Mechanistic insights into the functional interaction between SMAD2/3 and the m6A methyltransferase complex.
(a-c) Western blots of SMAD2/3 (S2/3), METTL3 (M3), METTL14 (M14), or control (IgG) immunoprecipitations (IPs) from nuclear extracts of hPSCs (hESCs for panels a and c, and hiPSCs for panel b). Input is 5% of the material used for IP. In c, IPs were performed from hPSCs maintained in presence of Activin or treated for 1h with the Activin/Nodal inhibitor SB-431542 (SB). Results are representative of three (panel a) or two (panels b-c) independent experiments. (d) qPCR validation of hESCs constitutively overexpressing NANOG (NANOG OE) following gene targeting of the AAVS1 locus with pAAV-Puro_CAG-NANOG. Parental wild-type H9 hESCs (H9) were analysed as negative control. Cells were cultured in presence of Activin or treated with SB for the indicated time points. The mean is indicated, n=2 cultures. NANOG OE cells are resistant to downregulation of NANOG following Activin/Nodal inhibiton. (e) RNA immunoprecipitation (RIP) experiments for WTAP, SMAD2/3 (S2/3), or IgG control in NANOG overexpressing hESCs maintained in presence of Activin or treated for 2 hours with SB. Enrichment of the indicated transcripts was measured by qPCR and expressed over background levels observed in IgG RIP in presence of Activin. RPLP0 was tested as a negative control transcript. Mean ± SEM, n=3 cultures. Significance was tested for differences versus Activin (left panel) or versus IgG (right panel) by 2-way ANOVA with post-hoc Holm-Sidak comparisons: *=p<0.05, **=p<0.01, and ***=p<0.001. (f) Chromatin immunoprecipitation (ChIP) qPCR in hESCs for the indicated proteins or for the negative control ChIP (IgG). qPCR was performed for validated genomic SMAD2/3 binding sites associated to the indicated genes,. hESCs were cultured in presence of Activin or treated for 2h with SB. The enrichment is expressed as normalized levels to background binding observed in IgG ChIP. The mean is indicated, n=2 technical replicates. Results are representative of three independent experiments.
Extended Data Figure 5
Extended Data Figure 5. Monitoring the changes in m6A deposition rapidly induced by Activin/Nodal inhibition.
(a-b) m6A methylated RNA immunoprecipitation (MeRIP) qPCR results from purified mRNA, total cellular RNA, or cellular RNA species separated following nuclear/cytoplasmic subcellular fractionation. hESCs were cultured in pluripotency-maintaining conditions containing Activin, or subjected to Activin/Nodal inhibition for 2h with SB-431542 (SB). IgG MeRIP experiments were performed as negative controls. The mean is indicated, n=2 technical replicates. Differences between Activin and SB-treated cells were observed only in the nuclear-enriched fraction. Therefore, the nuclear-enriched MeRIP protocol (NeMeRIP) was used for subsequent experiments (refer to the Supplementary Discussion). Results are representative of two independent experiments. (c) Overlap with the indicated genomic features of m6A peaks identified by NeMeRIP-seq using two different bioinformatics pipelines in which peak calling was performed using MetDiff or MACS2. For each pipeline, the analyses were performed on the union of peaks identified from data obtained in hESCs cultured in presence of Activin or subjected to Activin/Nodal inhibition for 2h with SB (n=3 cultures). Note that the sum of the percentages within each graph does not add to 100% because some m6A peaks overlap several feature types. MetDiff is an exome peak caller, and accordingly 100% of peaks map to exons. MACS2 identifies peaks throughout the genome. (d) Venn diagrams showing the overlap of peaks identified by the two pipelines. Only MetDiff peaks that were also identified MACS2 were considered for subsequent analyses focused on m6A peaks on exons. (e) Top sequence motifs identified de novo on all m6A exon peaks, or on such peaks that showed significant downregulation following Activin/Nodal inhibition (Activin/Nodal-sensitive m6A peaks; Supplementary Table 2). The position of the methylated adenosine is indicated by a box. (f) Coverage profiles for all m6A exon peaks across the length of different genomic features. Each feature type is expressed as 100 bins of equal length with 5’ to 3’ directionality. (g-h) Overlap of m6A exon peaks to transcription start sites (TSS) or transcription end sites (TES). In g, the analysis was performed for all m6A peaks. In h, only Activin/Nodal-sensitive peaks were considered. (i) On the left, Activin/Nodal-sensitive m6A exon peaks were evaluated for direct overlap with SMAD2/3 binding sites measured by ChIP-seq. n=482 peaks; FDR=0.41 (non-significant at 95% confidence interval, N.S.) as calculated by the permutation test implemented by the GAT python package. On the right, overlap was calculated after the same features were mapped to their corresponding transcripts or genes, respectively. A significant overlap was observed for the transcript-gene overlap. n=372 genes; hypergeometric test p-value (p) of 2.88E-18, significant at 95% confidence interval. (j) m6A NeMeRIP-seq results for selected transcripts (n=3 cultures; replicates combined for visualization). Coverage tracks represent read-enrichments normalized by million mapped reads and size of the library. Blue: sequencing results of m6A NeMeRIP. Orange: sequencing results of pre-NeMeRIP input RNA (negative control). GENCODE gene annotations are shown (red: protein coding exons; white: untranslated exons; note that all potential exons are shown and overlaid). The location of SMAD2/3 ChIP-seq binding sites is also reported. Compared to the other genes shown, the m6A levels on SOX2 were unaffected by Activin/Nodal inhibition, showing specificity of action. OCT4/POU5F1 is reported as negative control since it is known not to have any m6A site, as confirmed by the lack of m6A enrichment compared to the input.
Extended Data Figure 6
Extended Data Figure 6. Features of Activin/Nodal-sensitive differential m6A deposition.
(a) Scatter plot of the average log2 fold-change (FC) in SB-431542 (SB) versus Activin-treated hESCs for m6A NeMeRIP-seq and pre-NeMeRIP input RNA (n=3 cultures). The analysis was performed for all m6A exon peaks (left), or for such peaks significantly downregulated following Activin/Nodal inhibition (right). Data was colour coded according to the square of the difference between the two values (square diff.). (b-c) As in Extended Data Fig. 5j, but for representative transcripts whose expression is stable following Activin/Nodal inhibition for 2 hours (n=3 cultures; replicates combined for visualization). The m6A NeMeRIP and input tracks were separated and have a different scale in order to facilitate visual comparison between the conditions. The m6A peaks and those significantly downregulated after SB treatment for 2h are indicated. (d) Venn diagram illustrating the strategy for the identification of m6A peaks on introns. Peaks mapping to the transcribed genome were obtained by running MetDiff using an extended transcriptome annotation based on the pre-NeMeRIP input RNA, which is abundant with introns. The resulting peaks were first filtered by overlap with genome-wide MACS2-identified peaks, and then by lack of overlap with annotated exons. (e) Results of MetDiff differential methylation analysis in Activin vs SB 2h for m6A peaks on introns. n=3 cultures; p-value calculated by likelihood ratio test implemented in the MetDiff R package, and adjusted to False Discovery Rate (FDR) by Benjamini-Hochberg correction. See Supplementary Table 2 for the FDR of individual peaks. abs. FC: absolute fold-change. (f) As in Extended Data Fig. 5j, but for a representative transcript that shows Activin/Nodal-sensitive m6A deposition in introns (n=3 cultures; replicates combined for visualization). The m6A peaks on exons, introns, and those significantly downregulated after SB treatment within each subset are indicated. (g) Plots of RPKM-normalized mean m6A coverage for m6A exon peaks significantly downregulated after SB treatment (absolute fold-change>1.5). Data for all such peaks is in blue, while green lines report coverage for only those peaks characterized by next generation sequencing reads that span exon-intron junctions. Exons were scaled proportionally, and the position of the 3’ and 5’ splice sites (SS) is indicated. A window of 500 base pairs (bp) on either side of the splice sites is shown. m6A: signal from m6A NeMeRIP-seq; input: signal from pre-NeMeRIP input RNA. The results show that coverage of Activin/Nodal-sensitive m6A peaks often spans across splice sites (highlighted by the dotted lines). (h) Heatmap representing in an extended form the data shown in panel g for all Activin/Nodal-sensitive m6A exon peaks in hESCs cultured in presence of Activin. Multiple regions where sequencing coverage extends across exon-intron junctions can be observed (see Supplementary Table 2). (i) Example of an Activin/Nodal-sensitive peaks located in the proximity of a 3’ splice site (n=3 cultures; replicates combined for visualization). This peak can be visualized within its genomic context in panel c, where it is indicated by a dotted box. Data plotted on top is m6A NeMeRIP-seq coverage, while individual next generation sequencing reads are shown on the bottom. Multiple reads spanning the exon-intron junction (indicated by the dashed line) can be observed. (j) Relationship between the decrease of m6A on the most strongly affected exonic peak located on a transcript (y axis) and the mean change of all other peaks mapping to the same transcript (x axis). The analysis considered transcripts with multiple m6A peaks and with at least one peak significantly decreasing after Activin/Nodal inhibition with SB (absolute fold-change>1.5). Sensitivity of m6A deposition to Activin/Nodal signalling across these transcripts correlated.
Extended Data Figure 7
Extended Data Figure 7. Generation and functional characterization of inducible knockdown hPSCs for the subunits of the m6A methyltransferase complex.
(a) qPCR validation of tetracycline-inducible knockdown (iKD) hESCs cultured in presence of tetracycline (TET) for 5 days to drive gene knockdown. Two distinct shRNAs (sh) and multiple clonal sublines (cl) were tested for each gene. Expression is shown as normalized on the average level in hESCs carrying a negative control scrambled (SCR) shRNA. For each gene, sh1 cl1 was chosen for further analyses. The mean is indicated, n=2 cultures. (b) Western blot validation of selected iKD hESCs for the indicated genes. TUB4A4 (α-tubulin): loading control. Results are representative of three independent experiments. (c) m6A methylated RNA immunoprecipitation (MeRIP)-qPCR in iKD hESCs cultured for 10 days in absence (CTR) or presence of tetracycline (TET). m6A abundance is reported relative to control conditions in the same hESC line. The mean is indicated, n=2 technical replicates. Results are representative of two independent experiments. (d) m6A dot blot in WTAP or SCR iKD hESCs treated as described in panel c. Decreasing amounts of mRNA were spotted to facilitate semi-quantitative comparisons, as indicated. Results are representative of two independent experiments. (e) Immunofluorescence for the pluripotency markers NANOG and OCT4 in iKD hESCs cultured for three passages (15 days) in absence (CTR) or presence of tetracycline (TET). DAPI shows nuclear staining. Scale bars: 100μm. Results are representative of two independent experiments. (f) Flow cytometry quantifications for NANOG in cells treated as described for panel e. The percentage and median fluorescence intensity (MFI) of NANOG positive cells (NANOG+) are reported. The gates used for the analysis are shown, and were determined based on a secondary antibody only negative staining (NEG). Results are representative of two independent experiments.
Extended Data Figure 8
Extended Data Figure 8. Function of the m6A methyltransferase complex during germ layer specification.
(a) qPCR analysis following neuroectoderm or endoderm differentiation of inducible knockdown (iKD) hESCs cultured in absence (CTR) or presence of tetracycline (TET). Tetracycline treatment was initiated in undifferentiated hESCs for 10 days and was maintained during differentiation (3 days). Expression is shown as normalized on the average level in undifferentiated hESCs. Mean ± SEM, n=3 cultures. Significant differences vs same iKD line in control conditions were calculated by 2-way ANOVA with post-hoc Holm-Sidak comparisons: *=p<0.05, **=p<0.01, and ***=p<0.001. (b) Flow cytometry quantification of the percentage of SOX1 positive cells (SOX1+) in cells treated as described for panel a. Mean is indicated, n=2 cultures. (c) Immunofluorescent stainings for the lineage marker SOX17 in endoderm-differentiated hESCs treated as described for panel a. DAPI shows nuclear staining. Scale bars: 100μm. Results are representative of two independent experiments. (d) qPCR validation of multiple inducible knockdown (MiKD) hESCs simultaneously expressing shRNAs against WTAP, METTL3 (M3), and METTL14 (M14). Cells expressing three copies of the scrambled shRNA (SCR3x) were used as negative control. Cells were cultured in presence of tetracycline (TET) for 5 days to drive gene knockdown. Mean ± SEM, n=3 cultures. Significant differences vs SCR3x hESCs in control conditions were calculated by 2-way ANOVA with post-hoc Holm-Sidak comparisons: ***=p<0.001. (e-f) qPCR analysis following endoderm differentiation of WTAP, METTL3, and METTL14 MiKD hESCs treated as described for panel a. Mean ± SEM, n=3 cultures. Significant differences versus control conditions were calculated by two tailed t-test (panel e) or 2-way ANOVA with post-hoc Holm-Sidak comparisons (panel f): **=p<0.01, and ***=p<0.001.
Extended Data Figure 9
Extended Data Figure 9. Function of the m6A methyltransferase complex during pluripotency exit induced by Activin/Nodal inhibition.
(a) qPCR analyses in inducible knockdown (iKD) hESCs cultured in absence (CTR) or presence of tetracycline (TET) for 10 days, then subjected to Activin/Nodal signalling inhibition with SB-431542 (SB) for the indicated time (see Extended Data Fig. 10a). Activin: cells maintained in standard pluripotency-promoting culture conditions containing Activin and collected at the beginning of the experiment. Mean ± SEM, n=3 cultures. Significant differences vs same iKD line in control conditions were calculated by 2-way ANOVA with post-hoc Holm-Sidak comparisons: **=p<0.01, and ***=p<0.001. (b) Western blots of cells treated as described in panel a. TUBA4A (α-tubulin): loading control. Results are representative of two independent experiments. (c) Measurement of mRNA stability in WTAP iKD hESCs cultured in absence (CTR) or presence of tetracycline (TET) for 10 days. Samples were collected following transcriptional inhibition using Actinomycin D (ActD) for the indicated time. The statistical significance of differences between the mRNA half-lives in TET vs CTR is reported (n=3 cultures, comparison of fits to one phase decay model by extra sum-of-squares F test). The difference was significant for NANOG but not SOX2 (95% confidence interval). (d) Model showing the interplays between Activin/Nodal signalling and m6A deposition in hPSCs (left), and the phenotype induced by impairment of the m6A methyltransferase complex (right).
Extended Data Figure 10
Extended Data Figure 10. Genome wide analysis of the relationship between WTAP and Activin/Nodal signalling.
(a) Schematic of the experimental approach to investigate the transcriptional changes induced by the knockdown of the m6A methyltransferase complex subunits during neuroectoderm specification of hESCs. (b) qPCR analyses of WTAP inducible knockdown (iKD) hESCs subjected to the experiment illustrated in panel a (n=3 cultures). Activin: cells maintained in standard pluripotency-promoting culture conditions containing Activin and collected at the beginning of the experiment. SB: SB-431542. Z-scores indicate differential expression measured in number of standard deviations from the average across all time points. (c) RNA-seq analysis at selected time points from the samples shown in panel b (n=3 cultures). The heatmap depicts Z-scores for the top 5% differentially expressed genes (1789 genes as ranked by the Hotelling T2 statistic). Genes and samples were clustered based on their Euclidean distance, and the four major gene clusters are indicated (see the Supplementary Discussion). (d) Expression profiles of genes belonging to the clusters indicated in panel c. Selected results of gene enrichment analysis and representative genes for each cluster are reported (cluster 1: n=456 genes; cluster 2: n=471 genes; cluster 3: n=442 genes; cluster 4: n=392 genes; Fisher’s exact test followed by Benjamini-Hochberg correction for multiple comparisions). (e) Principal component analysis (PCA) of RNA-seq results described in panel c (n=3 cultures). The top 5% differentially expressed genes were considered for this analysis. For each of the two main principal components (PC1 and PC2), the fraction of inter-sample variance that they explain and their proposed biological meaning are reported. (f) Proportion of transcripts marked by at least one high-confidence m6A peak in transcripts significantly up- or downregulated following WTAP inducible knockdown in hESCs maintained in presence of Activin (left), or following Activin/Nodal inhibition for 2 hours with SB in control cells (right). Differential gene expression was calculated on n=3 cultures using the negative binomial test implemented in DEseq2 with a cutoff of p<0.05 and abs.FC>2. The number of genes in each group and the hypergeometric probabilities of the observed overlaps with m6A-marked transcripts are reported (n.s.: non-significant at 95% confidence interval).
Figure 1
Figure 1. Identification of the SMAD2/3 interactome.
(a) Experimental approach. (b) Interaction network from all known protein-protein interactions between selected SMAD2/3 partners identified in pluripotent and endoderm cells (n=3 co-IPs; one-tailed t-test: permutation-based FDR<0.05). Nodes describe: (1) the lineage in which the proteins were significantly enriched (shape); (2) significance of the enrichment (size is proportional to the maximum -log p-value); (3) function of the factors (colour). Complexes of interest are marked.
Figure 2
Figure 2. Activin/Nodal signalling promotes m6A deposition on specific regulators of pluripotency and differentiation.
(a-b) Western blots of SMAD2/3 (S2/3), METTL3 (M3), or control (IgG) immunoprecipitations (IPs) from nuclear extracts of hESCs (representative of three experiments). Input is 5% of the material used for IP. In b, IPs were performed from hESCs maintained in presence of Activin or treated for 1h with SB-431542 (SB; Activin/Nodal inhibitor). For gel source data, see Supplementary Figure 1. (c) Proximity ligation assays (PLA) for SMAD2/3 and WTAP in hESCs maintained in presence of Activin or SB (representative of two experiments). Scale bars: 10μm. DAPI: nuclei. (d) PLA quantification; the known SMAD2/3 cofactor NANOG was used as positive control. Mean ± SEM, n=4 PLA. 2-way ANOVA with post-hoc Holm-Sidak comparisons: **=p<0.01, and ***=p<0.001. (e) Representative results of nuclear-enriched m6A methylated RNA immunoprecipitation followed by deep-sequencing (m6A NeMeRIP-seq; n=3 cultures, replicates combined for visualization). Signal represents read enrichment normalized by million mapped reads and library size. GENCODE gene annotations (red: coding exons; white: untranslated exons; all potential exons are shown and overlaid), and SMAD2/3 binding sites from ChIP-seq data are shown. (f-g) RNA immunoprecipitation (RIP) experiments for WTAP, SMAD2/3, or IgG control in hESCs maintained in presence of Activin or treated with SB. RPLP0 and PBGD were used as negative controls as they present no m6A. f: mean ± SEM, n=3 cultures. 2-way ANOVA with post-hoc Holm-Sidak comparisons: *=p<0.05, and **=p<0.01. g: mean, n=2 cultures. (h) Model for the mechanism by which SMAD2/3 promotes m6A deposition. P: phosphorylation; W: WTAP; M14: METTL14.
Figure 3
Figure 3. The m6A methyltransferase complex antagonizes Activin/Nodal signalling in hPSCs to promote timely exit from pluripotency.
(a) Immunofluorescence for neural marker SOX1 following neuroectoderm differentiation of tetracycline (TET)-inducible knockdown (iKD) hESCs (representative of two experiments). CTR: no TET; DAPI: nuclei. Scale bars: 100μm. (b) qPCR analyses in WTAP iKD hESCs subjected to Activin/Nodal signalling inhibition with SB for the indicated time. Act: Activin. Mean ± SEM, n=3 cultures. 2-way ANOVA with post-hoc Holm-Sidak comparisons: **=p<0.01, and ***=p<0.001. (c) Western blot validation of multiple inducible knockdown (MiKD) hESCs for WTAP, METTL3 (M3), and METTL14 (M14). Cells expressing three copies of the scrambled shRNA (SCR3x) were used as negative control. (d) qPCR analyses in undifferentiated MiKD hESCs, or following their neuroectoderm differentiation. Mean ± SEM, n=3 cultures. Two-tailed t-test: **=p<0.01, and ***=p<0.001.

Comment in

  • m6A deposition: a boost from TGFβ.
    Lasman L, Hanna JH. Lasman L, et al. Cell Res. 2018 May;28(5):505-506. doi: 10.1038/s41422-018-0037-3. Cell Res. 2018. PMID: 29679051 Free PMC article. No abstract available.

References

    1. Wu MY, Hill CS. Tgf-beta superfamily signaling in embryonic development and homeostasis. Dev Cell. 2009;16:329–43. - PubMed
    1. Oshimori N, Fuchs E. The harmonies played by TGF-β in stem cell biology. Cell Stem Cell. 2012;11:751–64. - PMC - PubMed
    1. Gaarenstroom T, Hill CS. TGF-β signaling to chromatin: How Smads regulate transcription during self-renewal and differentiation. Semin Cell Dev Biol. 2014;32:107–8. - PubMed
    1. Heyn H, Esteller M. An Adenine Code for DNA: A Second Life for N6-Methyladenine. Cell. 2015;7:710–3. - PubMed
    1. Pickup M, Novitskiy S, Moses HL. The roles of TGFβ in the tumour microenvironment. Nat Rev Cancer. 2013;13:788–799. - PMC - PubMed

Publication types

MeSH terms