. 2018 Mar 8;555(7695):251-255.
doi: 10.1038/nature25786. Epub 2018 Feb 28.

Regeneration of the lung alveolus by an evolutionarily conserved epithelial progenitor

Affiliations

Regeneration of the lung alveolus by an evolutionarily conserved epithelial progenitor

William J Zacharias et al. Nature. .

Abstract

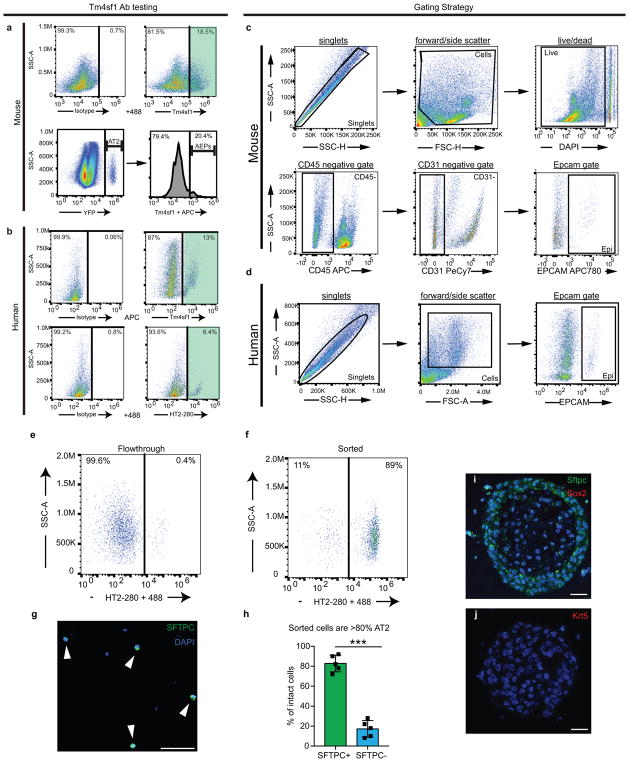
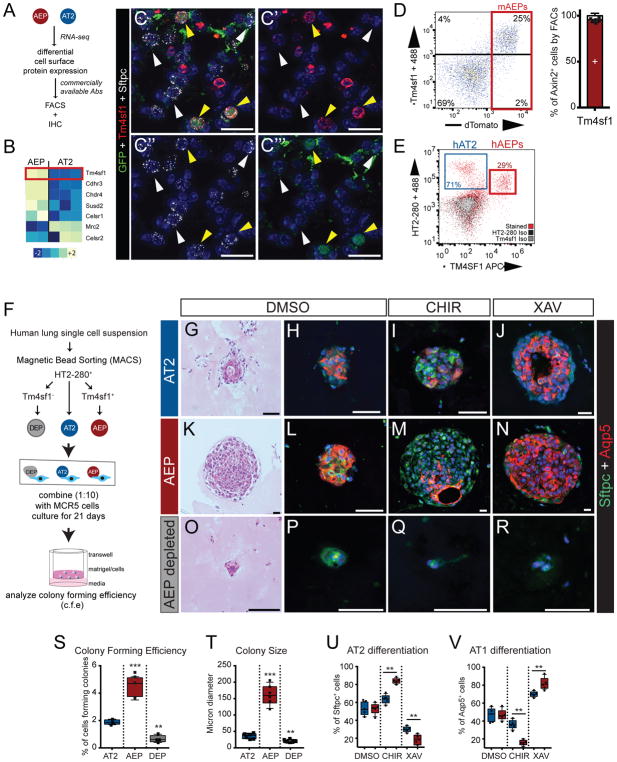
Functional tissue regeneration is required for the restoration of normal organ homeostasis after severe injury. Some organs, such as the intestine, harbour active stem cells throughout homeostasis and regeneration; more quiescent organs, such as the lung, often contain facultative progenitor cells that are recruited after injury to participate in regeneration. Here we show that a Wnt-responsive alveolar epithelial progenitor (AEP) lineage within the alveolar type 2 cell population acts as a major facultative progenitor cell in the distal lung. AEPs are a stable lineage during alveolar homeostasis but expand rapidly to regenerate a large proportion of the alveolar epithelium after acute lung injury. AEPs exhibit a distinct transcriptome, epigenome and functional phenotype and respond specifically to Wnt and Fgf signalling. In contrast to other proposed lung progenitor cells, human AEPs can be directly isolated by expression of the conserved cell surface marker TM4SF1, and act as functional human alveolar epithelial progenitor cells in 3D organoids. Our results identify the AEP lineage as an evolutionarily conserved alveolar progenitor that represents a new target for human lung regeneration strategies.


Conflict of interest statement

The authors declare no competing financial interests.

Figures

Extended Data Figure 1
Extended Data Figure 1. Location of Axin2+ epithelial cells within the adult mouse lung
(A) Low power view of the lung showing that E-cadherin+ Axin2+ epithelial cells are found only in the alveolar region and not the airway of the lung. (B–C) IHC for ciliated (B) and secretory (C) markers shows no evidence of Axin2-lineaged labeled cells co-expressing either of these markers. (D–E) Quantification of the location of Axin2+ epithelial cell distribution in the lung. (F) QPCR showing that Axin2+ AEPs and AT2 cells express similar levels of AT2 markers and other lung epithelial cell markers. AEPs express slightly higher levels of Abca3. (G) AEPs express increased levels of Wnt signaling pathway components and targets by QPCR. (H–J) Cytopsins and quantification demonstrating that the majority of sorted Axin2+ epithelial cells are Sftpc+. (K–L) FACS analysis of Axin2tdTomato+/HopxEYFP animals demonstrating that few Axin2+ epithelial cells express Hopx, consistent with the IHC data shown in Figure 1. Data in this figure represent N=3 (K–L), N=4 (E–G) N=4 (D, H–J), or N=10 (all other data) animals from 3 individual experiments. Statistics are representative of all biological replicates. All data is shown as centered on mean with bars indicating standard deviation. *=p<0.05, **=p<0.01, ***=p<0.001, ****=p<0.0001 by two-tailed T-test (F–G) or ANOVA with preplanned pairwise comparisons and adjustment for multiple comparison testing (D). Scale bars A–C 100μm, H–I 25μm.
Extended Data Figure 2
Extended Data Figure 2. Characterization of Axin2+ Wnt responsive cells in the adult lung
(A) 3 month lineage tracing shows a stable population of AEPs and progeny in the alveolar epithelium. (B–C) Quantification of AT1 and AT2 cells labeled by the AEP lineage mark at homeostasis. 7d lineage tracing data is re-plotted here for comparison to later time points. (D–I) Lower power (D–F) and higher power (G–I) images showing expansion of AEPs in a regional fashion 1 month after influenza injury. Dotted white line in F shows the edge of a Krt5+ pod, with a dearth of AEP-lineage labeled cells. G–I show additional channels of the same fields as Fig 1IJ. (J) Representative FACS plot showing expansion of AEP-lineage labeled epithelial cells following influenza. Quantification found in Fig 1N. (K–O) Comparison of AT2 and AEP Ki67+ expression following influenza. Ki67+ AEPs re-enter the cell cycle almost exclusively compared to AT2s in areas of regeneration. Data shown in this figure represent N=5 (J–O), N=6 (A–C), or N=10 (D–I) independent animals from 3 individual experiments, except for the 9 month lineage tracing which was performed in two separate experiments. Statistics are representative of all biological replicates. All data is shown as centered on mean with bars indicating standard deviation. *=p<0.05, **=p<0.01, ***=p<0.001, ****=p<0.0001 by ANOVA with preplanned pairwise comparisons and adjustment for multiple comparison testing. Scale bar=50μm.
Extended Data Figure 3
Extended Data Figure 3. In contrast to adult lung homeostasis, the Wnt response in the alveolar epithelium during alveologenesis is dynamic
(A) Schematic of lineage labeling procedure to assess Wnt-responsive epithelium during alveologenesis. (B) Epithelial cells were identified by FACS as Epcam+ CD45 CD31. Cells were then gated for TdTomato and EYFP expression as shown. (C) Quantification of Wnt responsiveness in the alveolar epithelium over a 1 day or 3 week lineage trace. (D) Model of directionality and magnitude of AT2 and AEP transitions. During alveologenesis, AT2 and AEP fates are somewhat fluid, though the AEP population narrows during this period of lung development. During adult homeostasis, few if any AT2 cells take on the AEP fate (see Figure 2). After injury, AEPs expand to create AT2 cells, but even after injury very few AT2 cells adopt the AEP fate. Data shown in this figure represents N=3 animals. Statistics are representative of all biological replicates. C is centered on mean with bars indicating standard error of the mean.
Extended Data Figure 4
Extended Data Figure 4. AEPs are a distinct lineage compared to Sox2-derived Krt5+ cells and are capable of generating AT1 cells
(A–D) AEPs and Krt5+ cells inhabit distinct regions of the regenerating mouse lung. (A) Overview of a region surrounding a Krt5+ pod. (B) In regions of mild injury AEPs and AEP lineage marked AT2 cells predominate, with no Krt5+ cells seen. (C) At the border of Zone 4 areas of alveolar destruction, AEPs are observed regenerating AT2 cells. (D) Krt5+ cells are distinct from AEPs and never bear the AEP lineage mark. (E) AEP-lineage cells do not expression Krt5+ or Sox2+ protein at baseline, in distinction to previously reported lineages. Arrows represent probable AEPs by morphology. (F) Krt5+ cells predominate in Zone 4 regions, while AEPs are not present in these regions. (G) Quantification demonstrating that Krt5+ cells are never marked with the AEP lineage mark. (H) AT2 populations expand dramatically after influenza injury except in Zone 4. (I) Krt5+ cells rarely express Sftpc in Zone 4 regions. (J–L). One month after influenza injury, AEPs give rise to a small number of Hopx+ AT1 cells, predominantly in Zone 2 of mild injury. Zone 3 (L) has very few AEP derived Hopx+ cells, which may be due to a lag in AT1 regeneration from AEPs in this more severely affected region. Data shown in this figure represent N=6 (A–G,I) or N=10 (H, J–K) independent animals across 3 individual experiments. Statistics are representative of all biological replicates. All data is shown as centered on mean with bars indicating standard deviation. **=p<0.01, ***=p<0.001, by ANOVA with preplanned pairwise comparisons and adjustment for multiple comparison testing. Scale bars: A=200μm, B–D,J–L,=50μm.
Extended Data Figure 5
Extended Data Figure 5. Wnt signaling in the alveolar epithelium is largely stable following influenza infection and AEP lineage labeling is not affected by tamoxifen perdurance
(A) FACS gating strategy used for all post-influenza FACS experiments in Figure 1, Extended Data Figure 2, and this figure. (B–C) FACS analysis demonstrates that Axin2tdTom intensity is mildly decreased in the epithelium at 7d and 14d time points following influenza infection. (D) In regions of more mild lung injury, most lineage labeled AT2 cells are EYFP+ and tdTomato-, suggesting these are progeny of AEPs. (E) In Zone 3, we detect a mix of EYFP+/tdTomato+ AEPs (red arrowheads) and EYFP+/tdTomato- AEP progeny (yellow arrowheads) among the AT2 cell population. (F) Experimental design of lineage tracing experiment in the second half of this figure, with longer incubation time following tamoxifen treatment than the data presented in A–E and the main Figures. (G–H) Confocal imaging demonstrating lineage labeling of AT2 cells with AEP lineage mark 28d after influenza-mediated injury. (I) Quantification of lineage labeled AT2 cells in multiple regions of lung injury. Representative 7d lineage data for comparison is reproduced from Figure 2. Data shown in this figure represent N=4 (A–C) or N=5 (D–I) independent animals across 2 different experiments. Statistics are representative of all biological replicates. All data is was analyzed with ANOVA followed by preplanned pairwise comparisons and adjustment for multiple comparison testing and shown centered on mean with bars indicating standard deviation with **=p<0.01. Scale bars = 50μm.
Extended Data Figure 6
Extended Data Figure 6. Transcriptome analysis of AEPs versus AT2s and activation of cell cycle genes in AEPs after influenza injury
(A) Volcano plot of 14,618 genes tested using a linear model using the R package limma showing the distinct differences in gene expression in AEPs versus AT2s. Notable lung progenitor developmental signaling and transcription factors are indicated. (B) GO analysis of top 500 most differentially expressed genes showing the enrichment of categories related to lung development and morphogenesis in AEPs. (C) Heatmaps of two of the AEP-enriched GO categories with important regulators of lung progenitor cell biology indicated. (D) QPCR confirming up-regulation of a subset of important regulators of lung progenitor biology in AEPs. (E) AT2 and AEP open chromatin is found near a distinct sets of genes involved in the cell cycle. (F) Schematic of analysis of changes in expression of AEP primed genes after influenza infection. (G) A subset of primed cell cycle regulators in AEPs show expression changes following influenza infection. QPCR data is from N=4 animals from 2 separate infections. All data is shown as centered on mean with bars indicating standard deviation. Statistics are representative of all biological replicates. *= p<0.05, **=p<0.01 by two-tailed T-test.
Extended Data Figure 7
Extended Data Figure 7. ATAC-seq reveals distinct differences in open chromatin architecture in AEPs versus AT2s
(A) ATAC-seq peaks in both AT2 and AEP cells are similar to previously described mouse lung genome wide DNase hypersensitivity profiling. (B) AT2 and AEP ATAC peaks are distributed similarly, predominantly within intergenic regions and introns. (C) GO enrichment analysis of nearest neighbor genes near AT2 vs AEP vs common peaks shows that common peaks are enriched for general cellular housekeeping roles while AT2 open chromatin is enriched near genes associated with exocytosis and cell differentiation. In contrast, AEP peaks are enriched near genes associated with lung development processes. (D–E) Examination of the genes associated with open chromatin in AEPs reveals a strong enrichment for lung endoderm progenitor cell associated transcription factors including members of the Klf, Six, Sox, Nkx2, and Elf/Ets families in AEPs. In contrast, AT2 cell open chromatin is associated with a unique set of transcriptional regulators including members of the NfI and Cebp families which are known to regulate AT2 cell surfactant genes. Detailed methods for ATAC analysis are reported in the Materials and Methods.
Extended Data Figure 8
Extended Data Figure 8. The combination of HT2-280 and TM4SF1 antibodies are capable of identifying AEPs in human lung
(A) Top of panel shows isotype and active antibody gates for Sheep anti-mouse Tm4sf1 FACS. The lower panel shows that the Tm4sf1 antibody detects approximately 20% of SftpcCreER;EYFP labeled AT2 cells. (B) Isotype and active antibody gates for human HT2-280 (AT2 marker) antibody and TM4SF1 antibody. (C–D) An example of the FACS gating strategy used to generate the data shown in Figure 3. (E–F) Selection for HT2-280 strongly enriches for hAT2 cells. (G–H) The majority of isolated HT2-280 cells express SFTPC protein by cytospin. (I–J) Human AEPs in organoid culture do not express KRT5 or SOX2 protein at detectable levels. Each FACS panel shown in A–F shows gates from one individual animal or patient and is representative of N=6 independent animals across 2 individual experiments or N=4 human patients. Isotype staining was done 3 times to confirm specificity. Statistics are representative of all biological replicates. Statistics in H are calculated with two-tailed T-test and displayed as mean with bars showing standard deviation. Scale bars = 25μm (D) or 50μm (I–J).
Extended Data Figure 9
Extended Data Figure 9. Mouse AEPs generate more alveolar organoids which are restricted from AT1 cell differentiation by Wnt signaling
(A) Schematic of mouse alveolar organoid culture method. Sftpc+ mAT2s (B–D, H–J) and mAEPs (E–G, K–M) were isolated from the indicated mouse lines and cultured in alveolar organoid assays. AT2s (B) and AEPs (E) both form alveolar organoids, while AEPs generating more and larger organoids. Activation of Wnt signaling using CHIR99021 does not increase the organoid forming efficiency of either AT2s (C) or AEPs (F) but does increase the number of Sftpc+ cells in treated organoids (I, L, O). Inhibition of Wnt signaling using XAV939 increases the number and size of alveolar organoids (D, G, N, Q), decreases the number of Sftpc+ AT2 cells, and increases the number of Aqp5+ AT1 cells (J, M, P). For all parameters tests, AEPs respond more dramatically to Wnt modulation than AT2s. Data shown in this figure represent N=12 wells across from N=4 individual animals in each group across 3 individual experiments. Quantitative counting shown for cell differentiation (O,P) represents counting of N>400 organoids from N=4 animals. All data was analyzed with ANOVA followed by preplanned pairwise comparisons and adjustment for multiple comparison testing and shown centered on mean with bars indicating standard deviation with *=p<0.05, **=p<0.01, ***=p<0.001, ****=p<0.0001. Statistics are representative of all biological replicates. Scale bars: H–M=50μm.
Extended Data Figure 10
Extended Data Figure 10. Combination ATAC-seq and RNA-seq emphasizes the Wnt- and FGF-responsive nature of AEPs and identifies several novel AEP-enriched direct Wnt target genes
(A) Schematic representation of the design of the human RNA-seq experiments. (B) GO Term analysis of the top 300 hAEP enriched genes shows enrichment of several categories associated with lung progenitor cell function, similar to what was observed in mAEP. (C) Evaluation of the chromatin accessibility in the mouse genome near common AEP enriched genes demonstrates a significant overrepresentation of Tcf binding sites, particularly in 5kb immediate upstream putative regulatory regions. Full details of enrichment analysis are found in the Methods. (D) Schematic depiction of areas of AEP-enriched open chromatin near selected AEP-enriched genes. Peak height represents coverage of the indicated genomic region in the ATAC library, while the number indicates the fold enrichment in the indicated peak. (E) ChIP QPCR on AEP vs AT2 chromatin demonstrates Ctnnb1 antibody binding at the differentially accessible genomic regions near Etv4, Sftpa, Lamp3, and Gpr116 in AEP cells, indicating that these genes are direct Wnt targets. Data is shown as mean with individual data points showing summary data from 2 independent ChIP experiments with multiple technical replicates. (F–J) Fgfr2 activation in mAEPs drives increased proliferation and formation of larger organoids. Quantification in (E). Correlate to Figure 4. (K) RNAscope showing enriched expression of Fgfr2 (red) in lineage labeled AEPs. (L–Q) Similar to Fgf7, Fgf10 treatment drives increased colony forming efficiency in both mAEP (L–P) and hAEP (Q). Data shown in F–J,L–Q represent a minimum of N=12 wells across 2 individual experiments. Statistics are representative of all biological replicates. Data was analyzed with ANOVA followed by preplanned pairwise comparisons and adjustment for multiple comparison testing and shown centered on mean with bars indicating standard deviation with *=p<0.05, **=p<0.01, ***=p<0.001, ****=p<0.0001.
Figure 1
Figure 1. Identification of an Axin2+ alveolar epithelial progenitor (AEP) in the adult lung that regenerates a substantial percentage of the alveolar epithelium
(A) Schematic of Axin2creERT2:TdT:R26REYFP mice. EYFP is detected by an anti-GFP antibody. Lineage tracing experimental design is as indicated. (B–D) Axin2 marks a subset of AT2 cells. Unmarked = white arrowheads. AEP-marked = yellow arrowheads. D shows orthogonal view of C. (E) Hopx+ AT1 cells are not marked by EYFP. (F) Approximately 20% of AT2 cells express Axin2. (G–H) Epithelial Wnt responsiveness is stable for up to 9 months. The majority of the AEP lineage remains Axin2TdTomato+, while some AEP progeny lose Axin2TdTomato+ expression. Very few Sftpc+/Axin2 cells gain Axin2TdTomato+ expression. Red arrow indicates an Axin2+ mesenchymal cell. (I) Influenza-induced lung injury results in regionalized alveolar damage: minimal (Zone 1), mild (Zone 2), severe (Zone 3), or complete (Zone 4). (J–L) AEP-generated Sftpc+ cells (J–K) and Hopx+ AT1 cells (L) expand in Zones 2 and 3. (M) Ki67+ AEPs preferentially re-enter the cell cycle in areas of regeneration. (N) AEPs can self-renew (YFP+/RFP+) while regenerating a significant number of AT2 cells (YFP+/RFP), but very few non-AEP cells acquire Axin2 expression (YFP/RFP+). (O) A region of regenerated lung epithelium near a persistent Krt5+ pod. Black line shows border of Krt5+ pod. Yellow dotted line indicates region of regeneration. (P–Q) A large number of new AEP-derived AT1 and AT2 cells are found within 3 alveolar units (regenerated Zone 3) of Krt5+ pods. N=5 (M,N), N=6 (F–H, O–P), or N=10 (others) animals from 2 (G–H, O–P) or 3 (others) individual experiments. Statistics are representative of all biological replicates. Plots are centered on mean with bars indicating SD. *=p<0.05, **=p<0.01, ***=p<0.001, ****=p<0.0001 by two-tailed T-test (E, P–Q) or ANOVA with adjustment for multiple comparison testing (others). Scale bars: B=100μm, C–E, G, J, O=50μm.
Figure 2
Figure 2. AEPs possess a distinct transcriptome and chromatin architecture enriched for cell cycle and progenitor cell pathways
(A) RNA-seq and ATAC-seq was performed on AEPs and AT2s. PCA plot of the top 500 most variable genes showing that AEPs segregate into a distinct population from AT2. By ATAC-seq, more than 40% of the genome was differentially accessible in AEPs (16.2%) or AT2 cells (24.1%). (B) ATAC-seq heatmap showing genome wide regions of differential open chromatin peaks in AT2s versus AEPs. (C) AEP-enriched ATAC-seq peaks compared to RNA-seq expression shows that a majority of genes associated with AEP open chromatin are not differentially expressed but primed for rapid activation. (D) A subset of these primed genes are associated with cell cycle activation. Full details on the experimental design and statistical methods for these analyses are available in the Methods.
Figure 3
Figure 3. Identification of Tm4sf1 as an AEP-specific cell surface marker capable of isolating functional human AEPs
(A and B) AEP enriched cell surface proteins with an available antibody. Tm4sf1 is highlighted. (C) Tm4sf1 is expressed in mAEPs. (D) FACS analysis (of N=6 individual animals, see Extended Data Fig. 8) demonstrating that Tm4sf1 correlates strongly with Axin2TdTomato expression. (E) A human anti-TM4SF1 antibody marks a subset of human HTII-280+ AT2s, which are putative human AEPs (hAEPs). (F) Schematic diagram of human lung alveolar organoid assay using either total hAT2 cells (HTII-280+), hAEPs (HTII-280+/TM4SF1+), or AEP-depleted hAT2 cells (HTII-280+/TM4SF1). Indicated cultures were treated with CHIR or XAV to modulate Wnt signaling. (G–J) The complete hAT2 population generates alveolar organoids and responds to Wnt activation by increasing AT2 cell differentiation or to Wnt inhibition by increasing AT1 cell differentiation. (K–N) hAEPs generate more and larger organoids that respond more robustly to Wnt modulation. (O–R) Depletion (DEP) of TM4SF1+ cells from hAT2s results in a loss of alveolar organoid formation and Wnt responsiveness. (S–V) Quantification of colony forming efficiency (S), colony size (T), AT2 (U) and AT1 (V) cell differentiation. N=4 individual human organoid experiments. Statistics are inclusive of all biological replicates. **=p<0.01, ***=p<0.001 by ANOVA with adjustment for multiple comparison testing. Plots are centered on mean with bars indicating SD. Scale bar C=50μm, F–Q=25μm.
Figure 4
Figure 4. AEPs display an evolutionarily conserved response to Wnt and Fgf signaling
(A) hAEPs exhibit a distinct transcriptome enriched for Wnt responsiveness. (B) More than one-third of hAEP-enriched genes are shared with mAEPs. (C) Volcano plot of 15,628 genes tested using limma shows extensive overlap between up-regulated genes in mAEPs and hAEPs. FGFR2 is indicated. (D–W) Alveolar organoid assays show mAEPs (D–M) and hAEPs (N–W) display a significant increase in colony formation and size upon FGF7 treatment. Additional data is shown in Extended Data Fig 10. N=4 individual organoid experiments. Statistics are inclusive of all biological replicates. **=p<0.01, ***=p<0.001 by ANOVA with adjustment for multiple comparison testing. Plots are centered on mean with bars indicating SD. Scale bars=25μm.

Comment in

References

    1. Beumer J, Clevers H. Regulation and plasticity of intestinal stem cells during homeostasis and regeneration. Development. 2016;143:3639–3649. doi: 10.1242/dev.133132. - DOI - PubMed
    1. Stanger BZ. Probing hepatocyte heterogeneity. Cell Res. 2015;25:1181–1182. doi: 10.1038/cr.2015.117. - DOI - PMC - PubMed
    1. Afelik S, Rovira M. Pancreatic beta-cell regeneration: Facultative or dedicated progenitors? Mol Cell Endocrinol. 2017;445:85–94. doi: 10.1016/j.mce.2016.11.008. - DOI - PubMed
    1. Frank DB, et al. Emergence of a Wave of Wnt Signaling that Regulates Lung Alveologenesis by Controlling Epithelial Self-Renewal and Differentiation. Cell Rep. 2016;17:2312–2325. doi: 10.1016/j.celrep.2016.11.001. - DOI - PMC - PubMed
    1. Töpfer L, et al. Influenza A (H1N1) vs non-H1N1 ARDS: analysis of clinical course. J Crit Care. 2014;29:340–346. papers3://publication/doi/10.1016/j.jcrc.2013.12.013. - DOI - PubMed

Publication types

MeSH terms