. 2018 Mar 15;555(7696):371-376.
doi: 10.1038/nature25795. Epub 2018 Feb 28.

Pan-cancer genome and transcriptome analyses of 1,699 paediatric leukaemias and solid tumours

Affiliations

Pan-cancer genome and transcriptome analyses of 1,699 paediatric leukaemias and solid tumours

Xiaotu Ma et al. Nature. .

Abstract

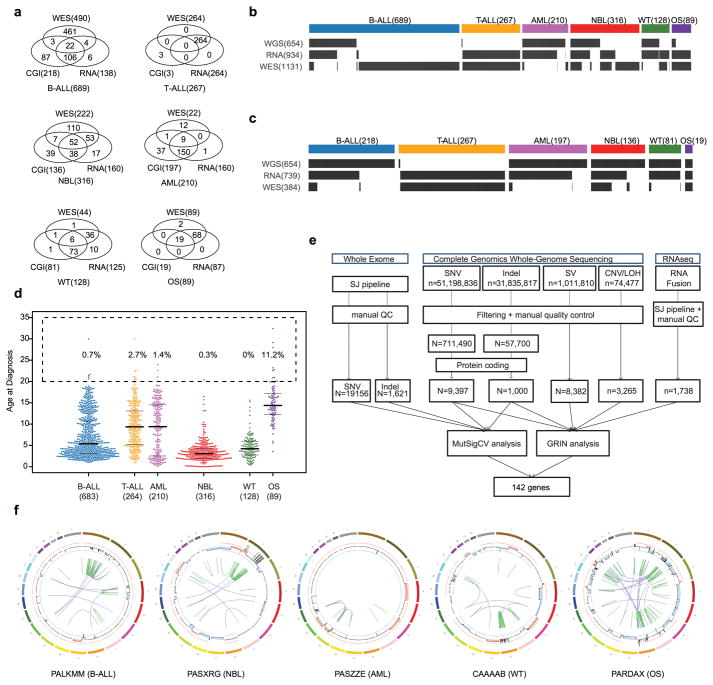
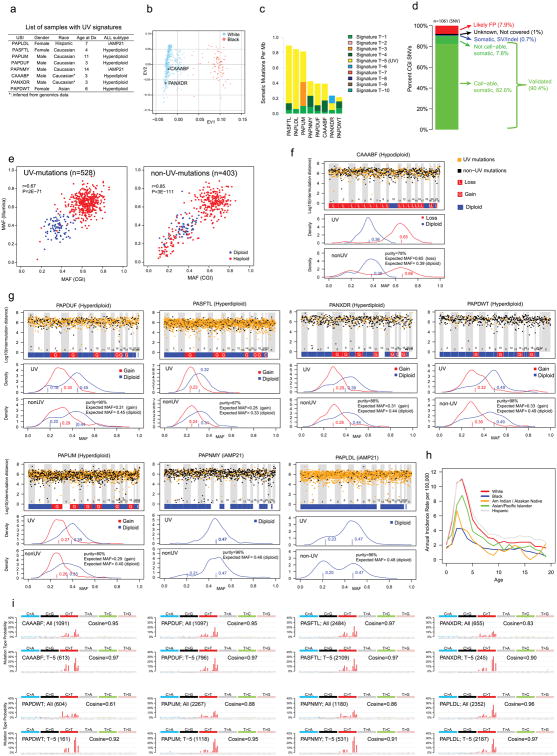
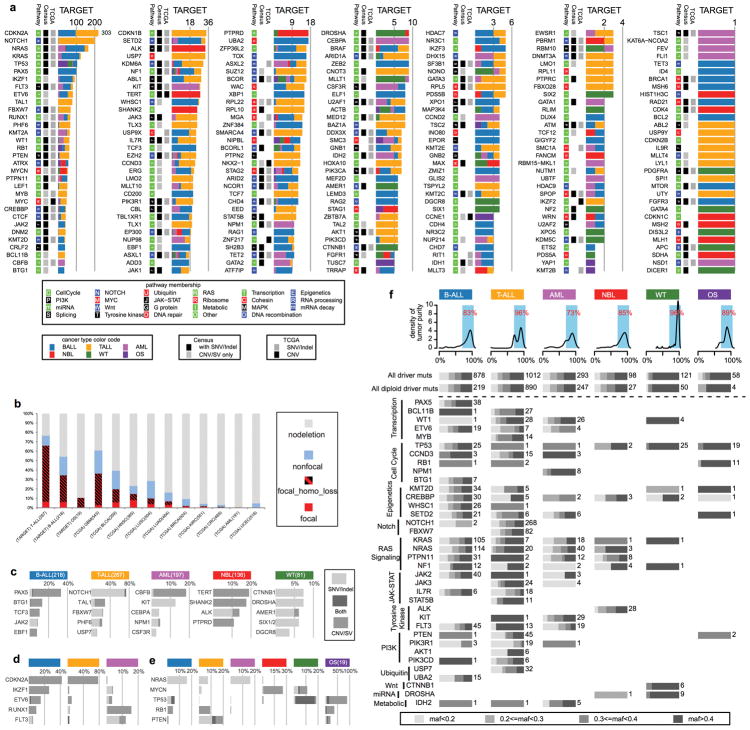
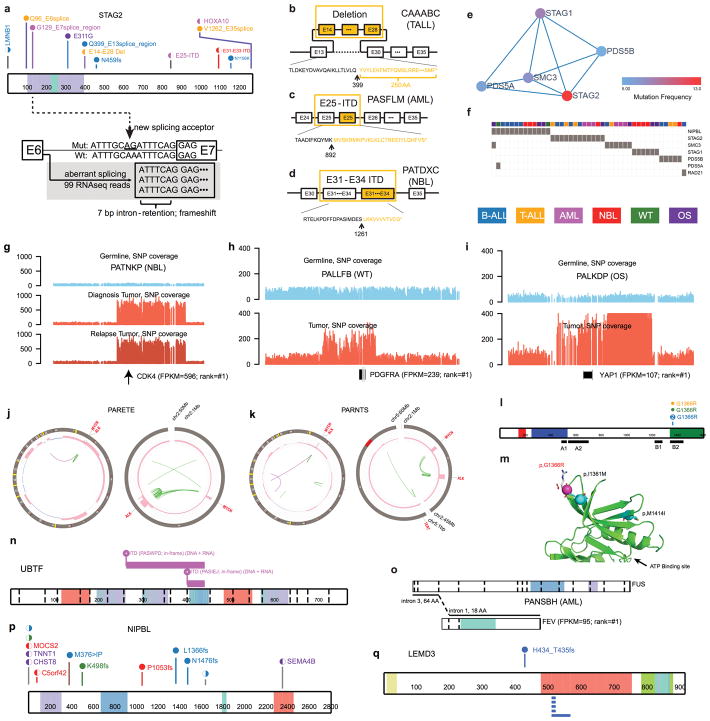
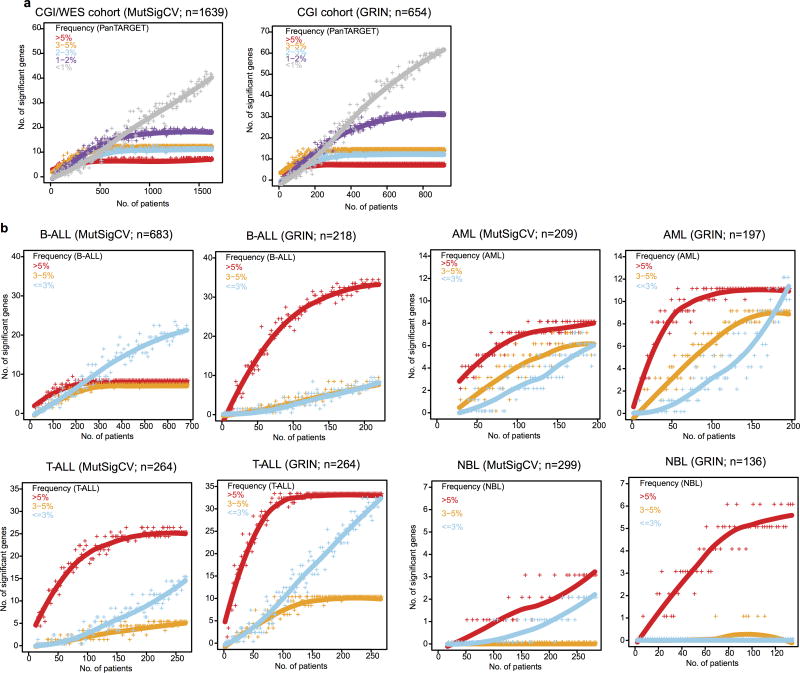
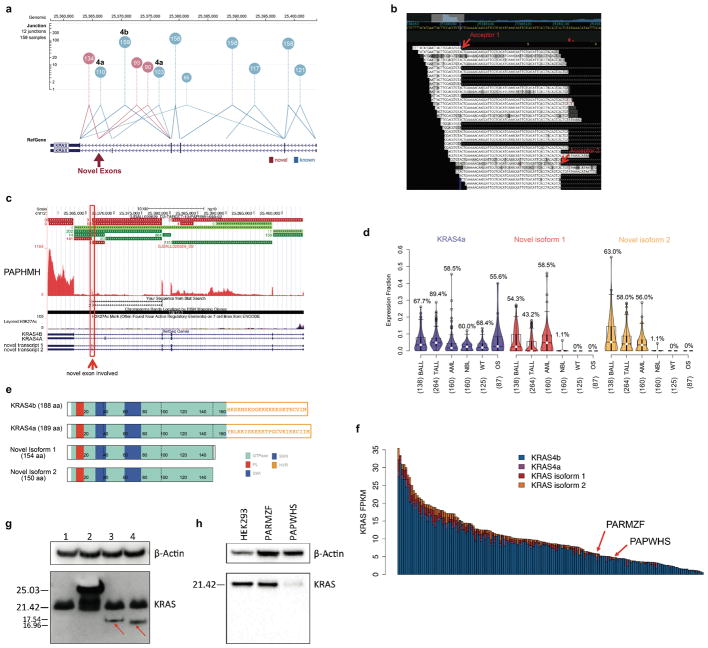
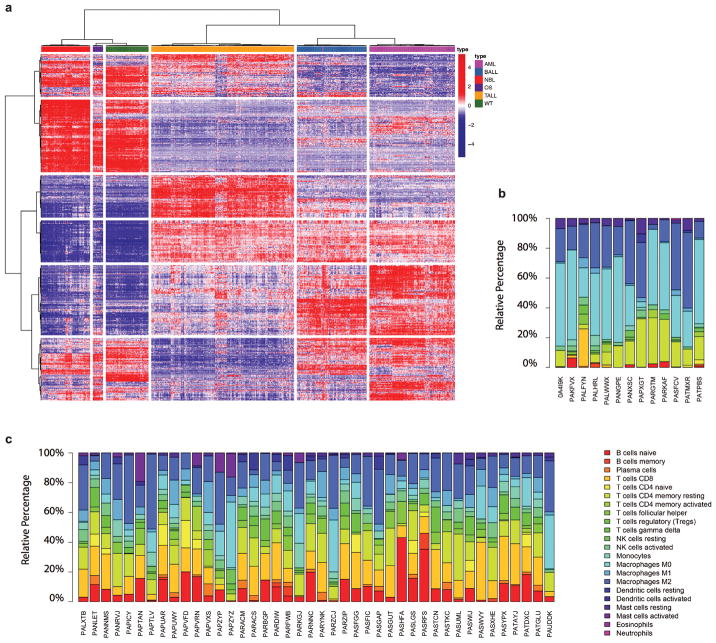
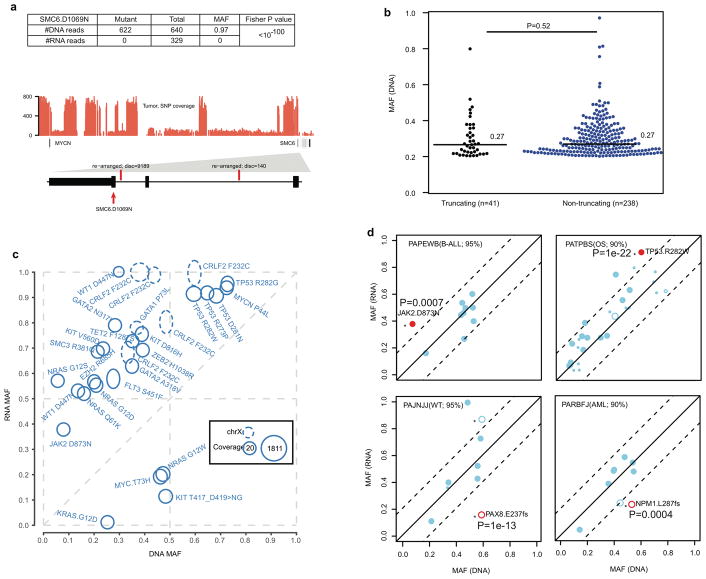
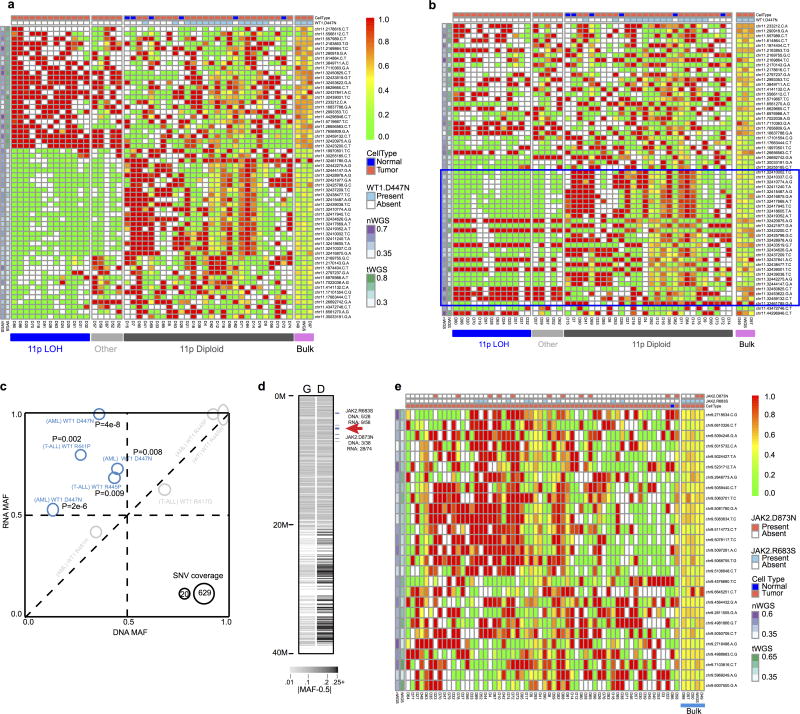
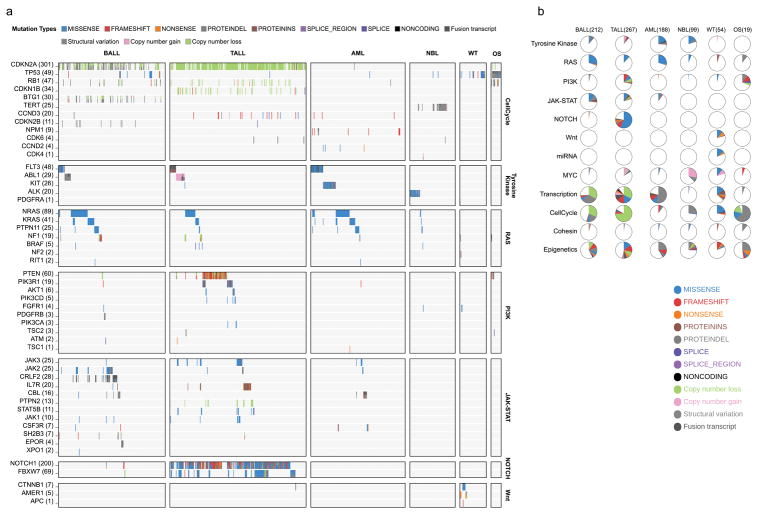
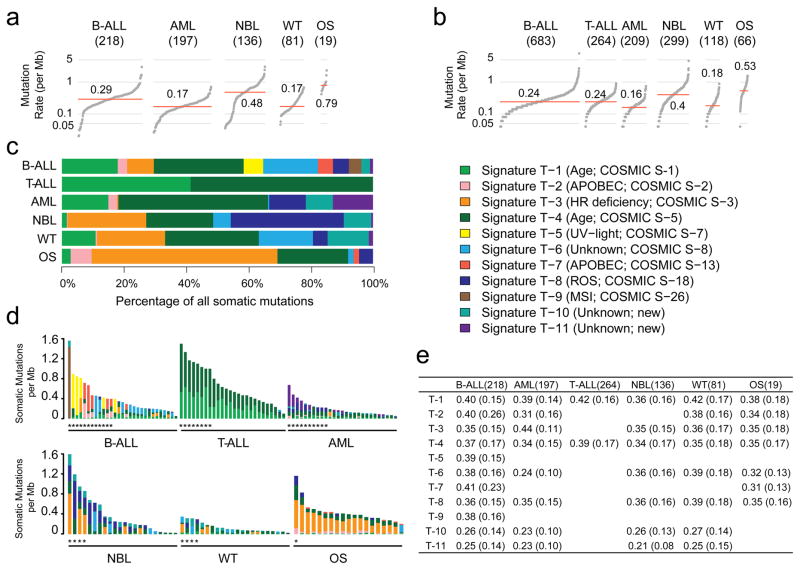
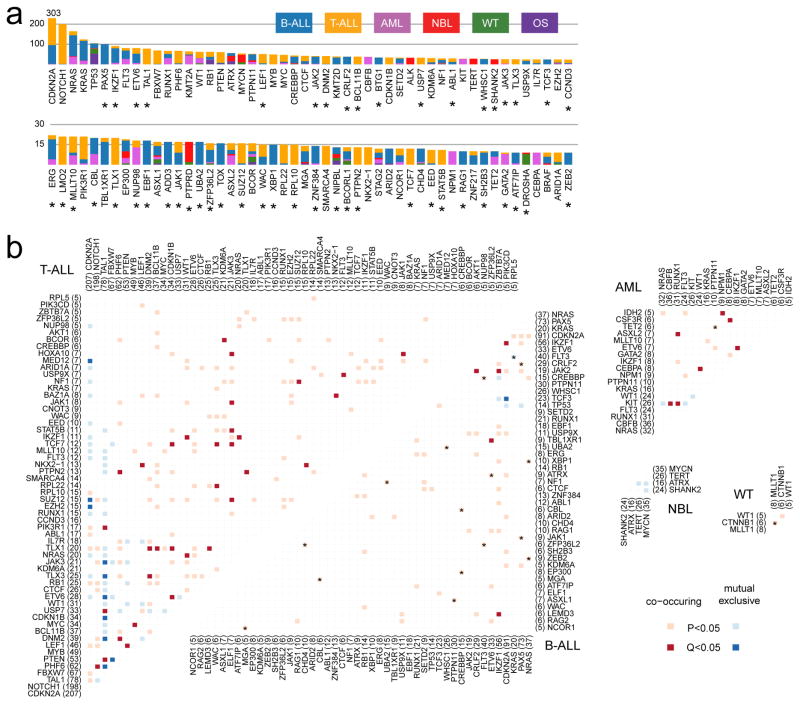
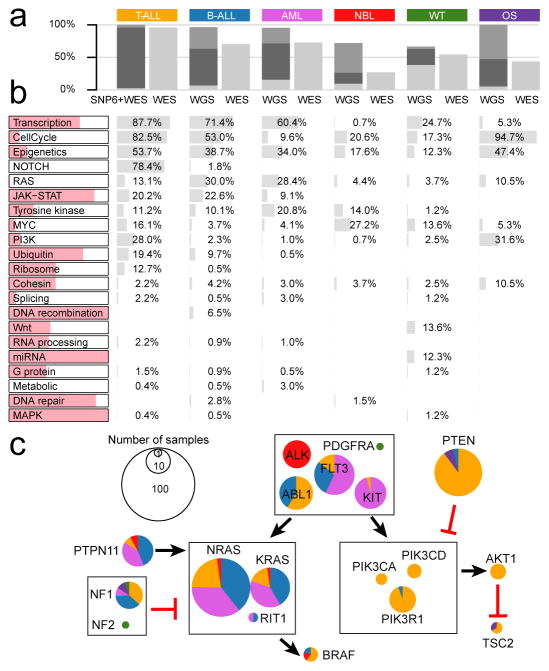
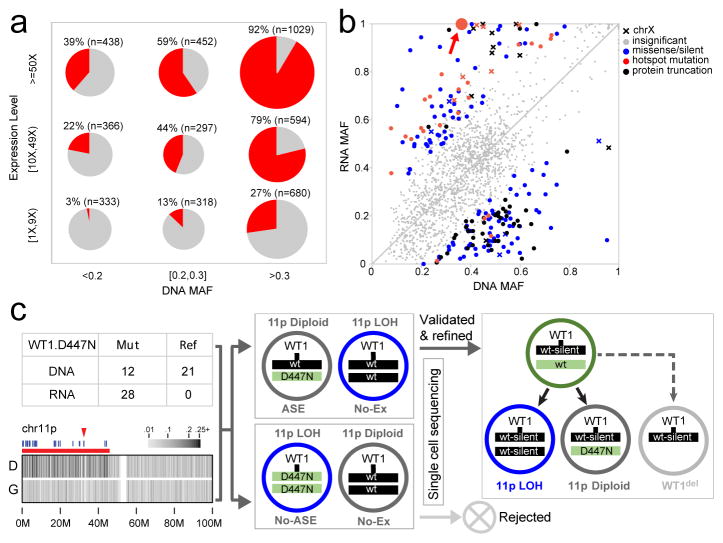
Analysis of molecular aberrations across multiple cancer types, known as pan-cancer analysis, identifies commonalities and differences in key biological processes that are dysregulated in cancer cells from diverse lineages. Pan-cancer analyses have been performed for adult but not paediatric cancers, which commonly occur in developing mesodermic rather than adult epithelial tissues. Here we present a pan-cancer study of somatic alterations, including single nucleotide variants, small insertions or deletions, structural variations, copy number alterations, gene fusions and internal tandem duplications in 1,699 paediatric leukaemias and solid tumours across six histotypes, with whole-genome, whole-exome and transcriptome sequencing data processed under a uniform analytical framework. We report 142 driver genes in paediatric cancers, of which only 45% match those found in adult pan-cancer studies; copy number alterations and structural variants constituted the majority (62%) of events. Eleven genome-wide mutational signatures were identified, including one attributed to ultraviolet-light exposure in eight aneuploid leukaemias. Transcription of the mutant allele was detectable for 34% of protein-coding mutations, and 20% exhibited allele-specific expression. These data provide a comprehensive genomic architecture for paediatric cancers and emphasize the need for paediatric cancer-specific development of precision therapies.


Conflict of interest statement

The authors declare no competing financial interests.

Figures

Extended Data Figure 1
Extended Data Figure 1. Cohort description and workflow
a, Venn diagram of samples analyzed by whole-exome (WES), whole genome (CGI) and whole transcriptome (RNA-seq) sequencing in this cohort. b, c, Sample-level sequencing status of the entire cohort (b) and those with WGS data (c, SNP6 for T-ALL). d, Age distribution for each histotype. Median, first and third quartiles are indicated by horizontal bars. Sample sizes are indicated in parenthesis. Percentage of cases with age >20 years are indicated. e, Analytical workflow. The tumour/normal bam files of WES data were analyzed by our in-house pipeline followed by manual quality control. The mutation annotation format files generated by CGI were downloaded from TARGET Data Matrix (Methods) and analyzed by a pipeline developed for this dataset, including SNVs, Indels and SVs. CNA/LOH were analyzed by using read counts of germline SNPs in the mutation annotation format files. Manual quality control was also performed. For RNAseq data, the fastq files were re-mapped and fusions and internal tandem duplications (ITDs) were analyzed with CICERO. The resultant mutations were analyzed by GRIN (SNV/Indel/CNA/SV/Fusion) and MutSigCV (SNV/Indel) to discover 142 recurrently mutated genes. f, One representative sample with chromothripsis for each histotype. CNAs are shown in the inner circle, orange indicates copy gain and blue indicates copy loss. Intra- and inter-chromosomal rearrangements are shown by green and purple curves, respectively.
Extended Data Figure 2
Extended Data Figure 2. Eight B-ALL samples with signatures of UV exposure
a, List of samples with UV signatures detected. b, Inference of ethnicity for cases CAAABF and PANXDR from 654 TARGET CGI samples by principle component analysis (Supplementary Note 10). c, Total spectrum of mutational signatures of the eight UV-mutation samples. d, SNVs of case CAAABF have a cross-validation rate of 90.4% with Illumina WGS data. e, High concordance of MAF values of SNVs derived from CGI and Illumina WGS, categorized by UV- and non-UV-mutations. Listed are Pearson’s correlation coefficient (r) and P value derived from linear regression. Numbers of SNVs are indicated in parenthesis. f, Inter-chromosomal distance and density plots for UV- and non-UV mutations in case CAAABF. Top panel: inter-mutational distance (log10 scale) of UV- (orange dots) and non-UV- (black dots) mutations. Chromosomal level gain and loss statuses are indicated. The results indicate uniform distribution of mutations with or without UV signature across the genome. Middle and bottom panel are density plots of UV- and non-UV-mutations, respectively, categorized by chromosomal loss (red) and diploid (blue) status in corresponding tumour sample. Estimated cluster centers are indicated by corresponding colors. The expected MAFs for clonal mutations at given purity and chromosomal ploidy status of corresponding tumour are listed in bottom panel. The density plots show that mutations with UV-signatures are clonal after adjusting for ploidy. g, Inter-chromosomal distance and density plots for the other seven cases (legend shown in f). h, ALL incidence by ethnicity obtained from the most recent registry (1973–2014) of Surveillance, Epidemiology, and End Results (SEER) Program Research Data (Supplementary Note 11). i, Mutation spectrum for all SNVs (All) and for UV SNVs (T-5) for each of eight cases. Total number of SNVs and Cosine similarity with COSMIC Signature-7 were indicated in each panel.
Extended Data Figure 3
Extended Data Figure 3. Driver mutation landscape in pediatric cancers
a, The number of samples mutated in each histotype is shown with colors coded as in Fig. 2. The presence of each gene in the Cancer Gene Census (Census) and prior pan-cancer studies of The Cancer Genome Atlas (TCGA) project are indicated. Pathway membership is also labeled for each gene. Somatic alterations in T-ALL were based on coding SNVs/indels from WES and CNAs from SNP array. b, Percentage of samples with focal (≤2Mb) and non-focal (>2Mb) deletions in CDKN2A. In the focal deletion category, samples with a second hit (either a second CNA or a copy neutral LOH) were categorized as “focal_homo_loss”. For B-ALL, 27 of 218 (12%) non-focal samples had arm-level (such as hyperdiplod or hypodiploid B-ALL) CNAs on chr9. Nine of 218 (4%) B-ALL cases had homozygous CDKN2A deletions with size ranges from 2.1Mb to 7.2 Mb and were counted as non-focal. TCGA data (no ALL data available) were downloaded on Dec 2015. The number of samples are indicated for each histotype. c, Top five genes mutated exclusively in each histotype. d, Top five genes mutated in leukemias. e, Top five genes mutated in both leukemias and solid tumours. f, MAF distribution of point mutations in driver genes. Top panel: density plot of tumour purity for each histotype. Percentages of samples with tumour purity >70% are indicated. Bottom panel: MAF distribution of point mutations in driver genes. Aggregated distribution for all driver genes is shown at the top (“All driver muts”), as well as all driver genes in diploid regions (for CGI data, CNA |seg.mean|<0.2, |logRatio|<0.2, and LOH seg.mean<0.1; for T-ALL SNP array data, CNA |seg.mean|<0.2). For each biological process defined in Fig. 3, the MAF distribution is shown for the genes with the five highest mutation frequencies that are mutated in more than five samples. The number of mutations in each histotype is labeled.
Extended Data Figure 4
Extended Data Figure 4. Example driver mutations
a, Diverse mutation types of STAG2. Variants are colored by histotype as in Fig. 2. Circles and half-moons represent mutations and structural alterations, respectively. Bottom panel shows RNA-seq for a SNV at the −8 position of STAG2 exon 7 which created a de novo splice site resulting in an out-of-frame transcript. b, c, d, truncating mutations by deletion or internal tandem duplication, respectively. e, Cohesin complex detected by HotNet2 analysis. f, Samples with mutations in cohesion complex. Selected examples of singleton oncogenic activation caused by high level amplifications including CDK4 (g), PDGFRA (h), and YAP1 (i) with FPKM and histotype-wise ranks indicated, as well as recurrent co-amplification of MYCN-ALK in two NBL samples (j, k). l, Recurrent MAP3K4 mutation with structural model in N lobe (m). Location of the mutation p.G1366R is indicated by a magenta sphere and the alteration side chain is modeled as a stick. Known activating alterations (p.I1361M and p.M1415I) are shown as teal spheres. GADD45 binding (A1), kinase inhibitor (A2), and kinase domains (B1, B2) are indicated in panel l. n, Internal tandem duplication in UBTF, o, Fusion of FEV, p, q, Mutations in novel driver genes NIPBL and LEMD3.
Extended Data Figure 5
Extended Data Figure 5. Down-sampling analysis of gene discovery
The analysis was performed on point mutations with MutSigCV and on SNV/Indel/SV/CNA/Fusion variants with GRIN (Methods). The resulting candidate driver genes were categorized into five frequency bins indicated by different colors. Each dot (“+”) represent a random subset of the pan-cancer cohort. Line is a smoothed fit. a, Analysis performed on entire CGI/WES cohort with MutSigCV (left panel) and CGI cohort with GRIN (right panel). b, Analysis performed with MutSigCV and GRIN for each histotype. Candidate driver genes were assigned to three frequency bins (according to corresponding histotypes). Sample sizes are indicated in parenthesis in each panel.
Extended Data Figure 6
Extended Data Figure 6. Expression of novel KRAS isoforms
a, KRAS RNA-seq reads spanning splice junction in AML samples. Each junction is shown as a circle labeled by counts of detected samples, with lines connecting the splice sites. The circle’s y-axis position represents the median supporting read count. Canonical junctions are colored blue and novel junctions in red. b, RNA-seq reads in the last intron of KRAS illustrate the two novel exons detected in a B-ALL sample (PAPHMH). Novel splicing acceptor sites are indicated by red arrows. c, Junction reads for KRAS in the same B-ALL sample. Canonical KRAS exons are shown as green horizontal bars while novel exons are shown in red (top panel) and the RNA-seq coverage at the KRAS gene locus is shown below. The two novel exons are indicated with red arrows. d, Expression of two novel isoforms with KRAS4a as a control. Percentage of samples expressing these isoforms are indicated. Median, first and third quartiles are indicated by horizontal bars. Sample sizes are indicated in parenthesis. e, Protein domains for KRAS4a, KRAS4b and two novel isoforms. f, KRAS expression (FPKM) in AML samples analyzed in this study, categorized by the four isoforms. g, Western blot for KRAS in 293T cells. Cells were transfected with empty vector (lane 1), tagged wild type KRAS (lane 2), novel isoform 1 (lane 3) and 2 (lane 4). Protein products of the two novel KRAS isoforms were indicated by red arrow. h, Western blot for KRAS in two patient tumour samples (PARMZF and PAPWHS). Protein products of the two novel isoforms were not detected in these two samples. For panels g and h, the experiments were performed in duplicate and similar results were observed (see Supplementary Figure 1 for gel source data).
Extended Data Figure 7
Extended Data Figure 7. Clustering analysis of tumour RNA-seq data and immune cell infiltration analysis
a, Clustering analysis was carried out for 739 primary tumours with RNA-seq data available. Top 1000 most variable expressed genes were clustered with Ward’s minimum variance method. Each disease is annotated shown in the first row with color indicated in the legend. b, c, Immune cell infiltration in OS and NBL. Macrophage M0 and M2 were the dominant immune cell populations observed in OS tumours (b). T- and B- cell infiltration, followed by macrophages, were the major immune cell types observed in NBL tumours (c).
Extended Data Figure 8
Extended Data Figure 8. Analysis of allele specific expression
a, Mutant allele and total read count for SMC6 D1069N in DNA and RNA of NBL case PAPZYP. This is to illustrate variants with suppressed mutant allele expression despite high DNA MAF and high-level of gene expression in RNA-seq. P value is calculated using two-sided Fisher’s Exact test. DNA coverage of the MYCN and SMC6 region indicating multiple segments with high amplification (estimated at 26 copies). Details of the last three exons (E26, E27 and E28) of SMC6 are shown with DNA SVs highlighted by vertical red bars. The mutation SMC6 D1069N is present in a region disrupted by SVs which dissociate the last three exons from the rest of SMC6. The high DNA MAF was therefore within a gene fragment that could not be transcribed and the expressed reference allele was from the intact gene. b, Non-expressed truncating (black) and non-truncating (blue) mutations showed a similar (P=0.52, Wilcoxon rank sum test, two-sided) median MAF (horizontal black lines). Number of SNVs in each category are shown in parenthesis. c, Hot spot mutations exhibited elevated mutant allele expression. Each mutation is shown as an oval positioned by its DNA MAF (x-axis) and RNA MAF (y-axis). The read count in DNA and RNA is depicted by the radius in x-axis and y-axis direction, respectively. Mutations on chromosome X are shown as dotted ovals. Read counts from CGI and WES were combined whenever possible. d, Within-sample analysis to evaluate the effect of normal cell contamination on ASE. Shown are two samples with hotspot SNVs (red dots in cases PAPEWB and PATPBS) and two samples with truncating mutations (red circles in cases PAJNJJ and PARBFJ), which had a sufficient number of expressed coding mutations. Purity of each tumour is indicated. Dots represent SNVs and circles represent indels. Smaller-sized symbols indicate presence of CNA or LOH. An asterisk indicates a significant difference of MAFs between DNA (x-axis) and RNA (y-axis), which requires a minimum MAF difference of 0.2 (dashed lines) and a two-sided Fisher’s exact test P<0.01 (exact P values indicated in each panel). A dot in case PAJNJJ with DNA MAF of 0.5 and RNA MAF of 1.0 is not significant due to low coverage (2×) in RNAseq. In all four cases, within-sample concordance of DNA and RNA MAF for all except the ASE mutation suggest that normal cell contamination has a negligible effect on ASE
Extended Data Figure 9
Extended Data Figure 9. Allele specific expression in WT1 and JAK2
Hierarchical clustering of single cell sequencing data for AML case PAPWIU, in which rows were ordered by clustering (a) or by position (b). Each row represents one germline SNP and each column is a single cell. Three clusters (11pLOH, Other, and 11p Diploid) were detected according to variant allele frequency, ranging from 0.0 (green) to 1.0 (red). The top two rows indicate the cell type (tumour or normal) and WT1 D447N mutation status. b, Variants within WT1 locus are highlighted with a blue box. The cluster “Other” matches the 11pLOH cluster within the WT1 locus as the samples in this cluster had mono-allelic genotypes at WT1, likely caused by a focal deletion. The cluster “Other” could also be caused by chimeric cells. However, as all cells in this cluster has the same pattern matching the 11pLOH cluster within the WT1 gene (the blue box in b represents the genomic location of chr11:32,410,002-32,461,785 and WT1 is located at chr11:32,409,322-32,457,081). A WT1 focal deletion better explains the profile in “Other”. c, All nine missense WT1 mutations with DNA and RNA data. The lowest RNA coverage is 16 for WT1 R445P in AML case PABLDZ. Five mutations exhibiting allele-specific expression mutations (Two-sided Fisher’s Exact test P<0.01; exact P values also listed for each mutation) are highlighted in blue (gray for P≥0.01). AML case PABLDZ had LOH at WT1 locus; LOH was present in the predominant clone at the diagnosis and may mask the presence of ASE in a subclone. d, e, Two JAK2 mutations R683S and D873N were detected in B-ALL case PAPEWB, in which D873N showed ASE (DNA MAF is 3/38, RNA MAF is 28/74, Fisher’s Exact test P<0.01). A single-cell sequencing experiment was designed to investigate whether the ASE could be attributed to subclonal CNA undetectable in the bulk tumour. d, The 27 germline SNPs in JAK2 locus were selected along with the two somatic JAK2 mutations and other 46 somatic variants. e, Heatmap of genotype clusters generated from the 64 assays (4 bulk and 60 single cells) passing single-cell sequencing quality control and the original CGI genotype data. The absence of a cluster of mono-allelic genotypes indicates the absence of 9p LOH, which in turn confirms ASE of D873N.
Extended Data Figure 10
Extended Data Figure 10. Pathway centric overview of mutational landscape in pediatric cancers
a, Heatmap of somatic mutations in selected pathways across six histotypes. b, Pie-chart of mutation frequency in selected pathways. Number of samples in calculation was indicated for each histotype. An interactive version of the data is available at the ProteinPaint portal (https://pecan.stjude.org/proteinpaint/study/pan-target)
Figure 1
Figure 1. Somatic mutation rate and signature
Sample size of each histotype is shown in parenthesis. Mutation rate using non-coding SNVs from WGS (a) and coding SNVs from WGS/WES (b). Red line: median. Panel a and b are scaled to the total number of samples with WGS (n=651), WGS or WES (1,639), respectively. c, Mutational signatures identified from WGS and T-ALL WES data and their contribution in each histotype. d, Mutation spectrum of representative samples in each histotype. Hypermutators (three standard deviations above mean rate of corresponding histotype) are labeled with an asterisk (*). e, Mean and standard deviation (s.d) of MAF of each signature in each histotype.
Figure 2
Figure 2. Candidate driver genes in pediatric cancer
a, Top 100 recurrently mutated genes: case count for each histotype is shown in the same color as the legend. An asterisk (*) indicates gene not reported in prior adult pan-cancer analyses. b, Statistically significant pairwise relationships (P<0.05; two-sided Fisher’s Exact test) for co-occurrence (red color) or exclusivity (blue color) in each histotype. Gene pairs with Q<0.05 are colored dark red (co-occurring) or dark blue (exclusive) to account for false discovery rate. Significance detected only in WGS+WES samples is marked with an asterisk (*). Number of mutated samples are labeled in parenthesis.
Figure 3
Figure 3. Biological processes with somatic alterations in pediatric cancer
a, Percentage of tumors with at least one driver alteration were shown for each histotype. WGS-analyzed tumors may have point mutation (light gray), CNA/SV (dark gray), or both (black). For T-ALL, CNAs were derived from SNP array. b, Percentage of tumors within each histotype having somatic alterations in 21 biological pathways; histotype ordering is as in a. The colored portion of each pathway indicates percentage of variants in genes that are absent in three TCGA pan-cancer studies. c, Mutation occurrence by histotype in RAS, tyrosine kinase, and PI3K pathways.
Figure 4
Figure 4. Mutant allele expression
a, Percentage of expressed mutations (red) categorized by DNA MAF (x-axis) and expression level (y-axis). Circle size is proportional to mutation counts. b, Detection of ASE in expressed mutations by comparing DNA and RNA MAF in 443 samples (solid colors: statistically significant (Two-sided Fisher’s Exact test Q<0.01 and effect size>0.2); gray: insignificant). c, Confirming ASE for WT1 D447N (red arrow in b) by single-cell sequencing. Presence of subclonal 11p LOH leads to two possible outcomes: the mutant allele is in either non-LOH subclone (top) or LOH subclone (bottom): the former suggests ASE and the latter rejects ASE due to homozygosity. No-Ex: WT1 not expressed.

Comment in

References

    1. Kandoth C, et al. Mutational landscape and significance across 12 major cancer types. Nature. 2013;502:333–339. doi: 10.1038/nature12634. - DOI - PMC - PubMed
    1. Lawrence MS, et al. Discovery and saturation analysis of cancer genes across 21 tumour types. Nature. 2014;505:495–501. doi: 10.1038/nature12912. - DOI - PMC - PubMed
    1. Leiserson MD, et al. Pan-cancer network analysis identifies combinations of rare somatic mutations across pathways and protein complexes. Nature genetics. 2015;47:106–114. doi: 10.1038/ng.3168. - DOI - PMC - PubMed
    1. Zack TI, et al. Pan-cancer patterns of somatic copy number alteration. Nature genetics. 2013;45:1134–1140. doi: 10.1038/ng.2760. - DOI - PMC - PubMed
    1. Downing JR, et al. The Pediatric Cancer Genome Project. Nature genetics. 2012;44:619–622. doi: 10.1038/ng.2287. - DOI - PMC - PubMed

Publication types