. 2018 Aug 1;34(15):2614-2624.
doi: 10.1093/bioinformatics/bty114.

A global network of biomedical relationships derived from text

Affiliations

A global network of biomedical relationships derived from text

Bethany Percha et al. Bioinformatics. .

Abstract

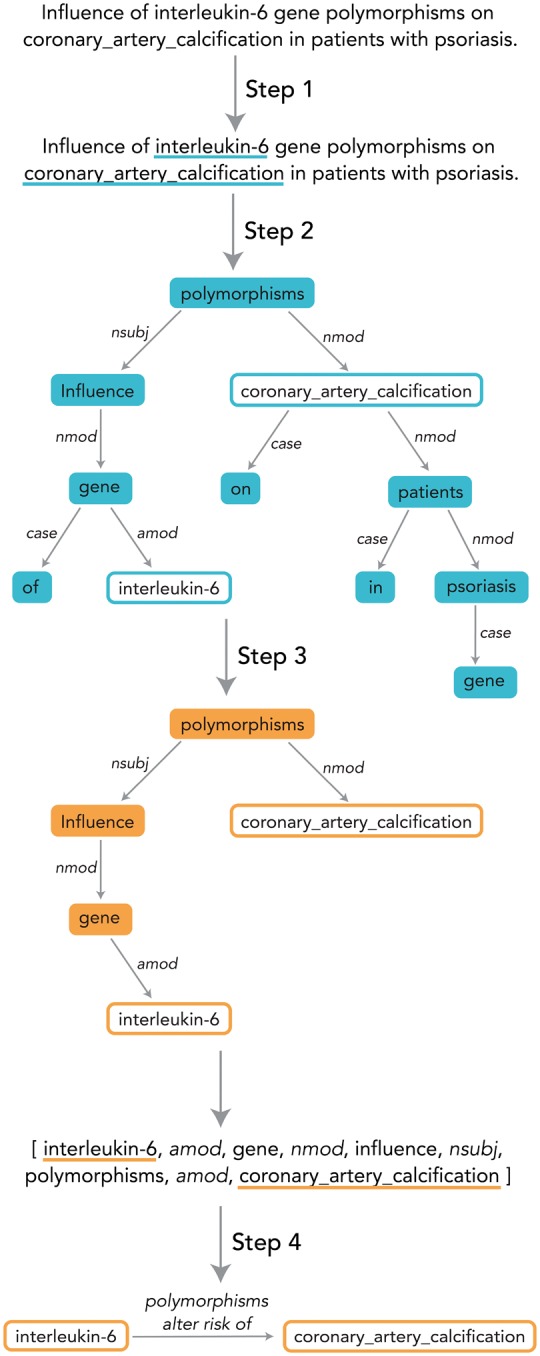
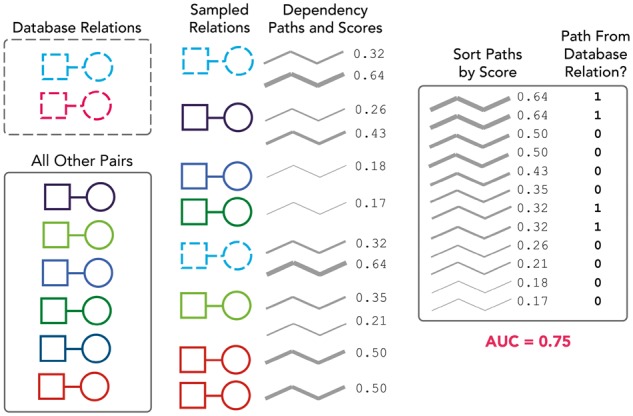
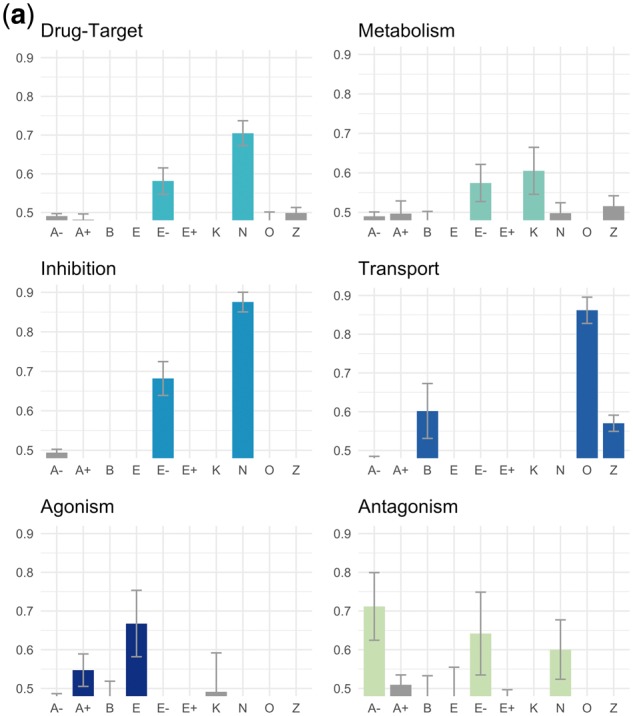
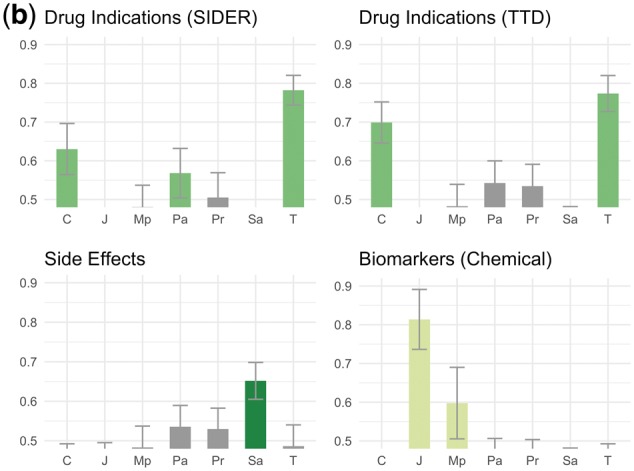
Motivation: The biomedical community's collective understanding of how chemicals, genes and phenotypes interact is distributed across the text of over 24 million research articles. These interactions offer insights into the mechanisms behind higher order biochemical phenomena, such as drug-drug interactions and variations in drug response across individuals. To assist their curation at scale, we must understand what relationship types are possible and map unstructured natural language descriptions onto these structured classes. We used NCBI's PubTator annotations to identify instances of chemical, gene and disease names in Medline abstracts and applied the Stanford dependency parser to find connecting dependency paths between pairs of entities in single sentences. We combined a published ensemble biclustering algorithm (EBC) with hierarchical clustering to group the dependency paths into semantically-related categories, which we annotated with labels, or 'themes' ('inhibition' and 'activation', for example). We evaluated our theme assignments against six human-curated databases: DrugBank, Reactome, SIDER, the Therapeutic Target Database, OMIM and PharmGKB.

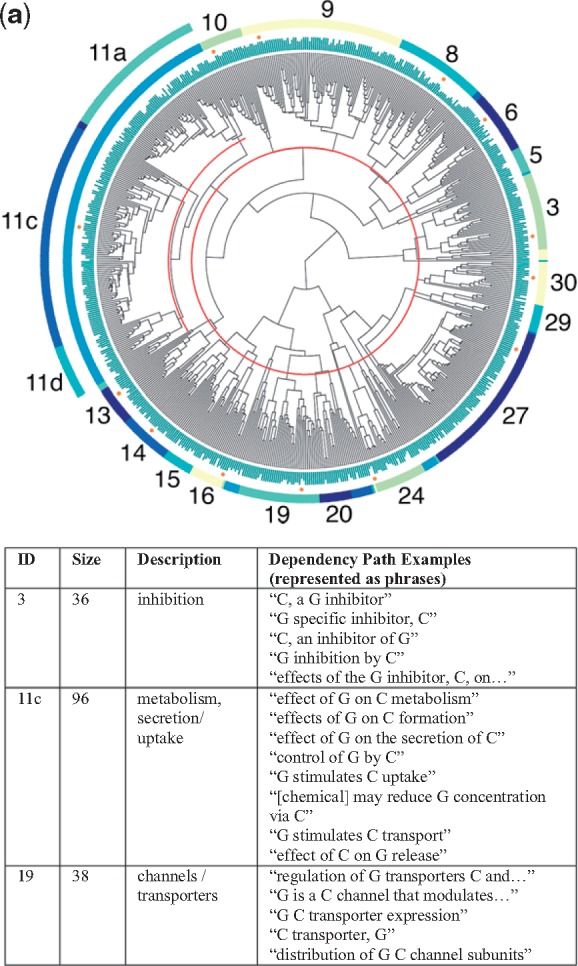
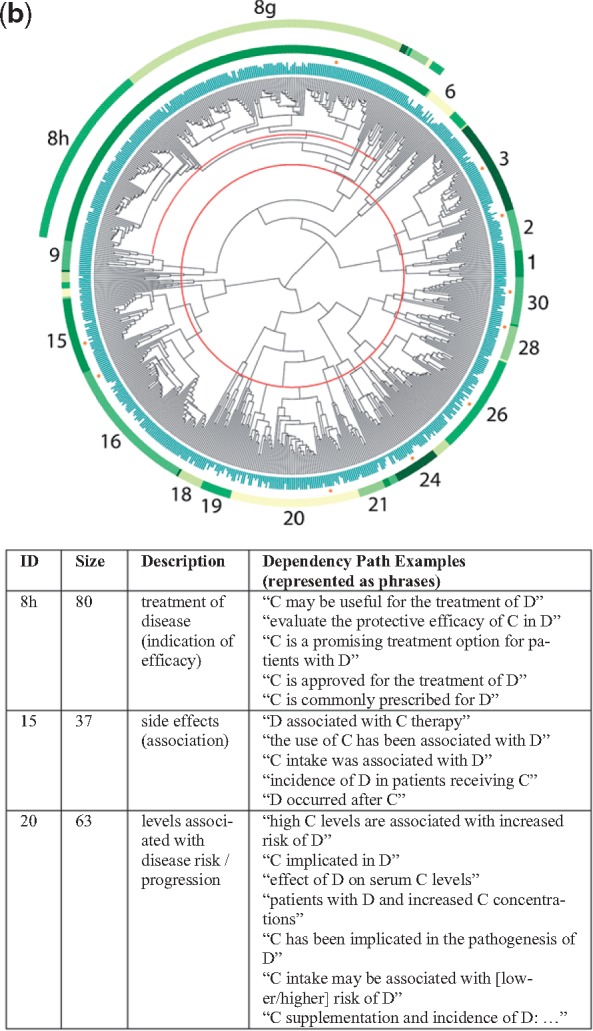
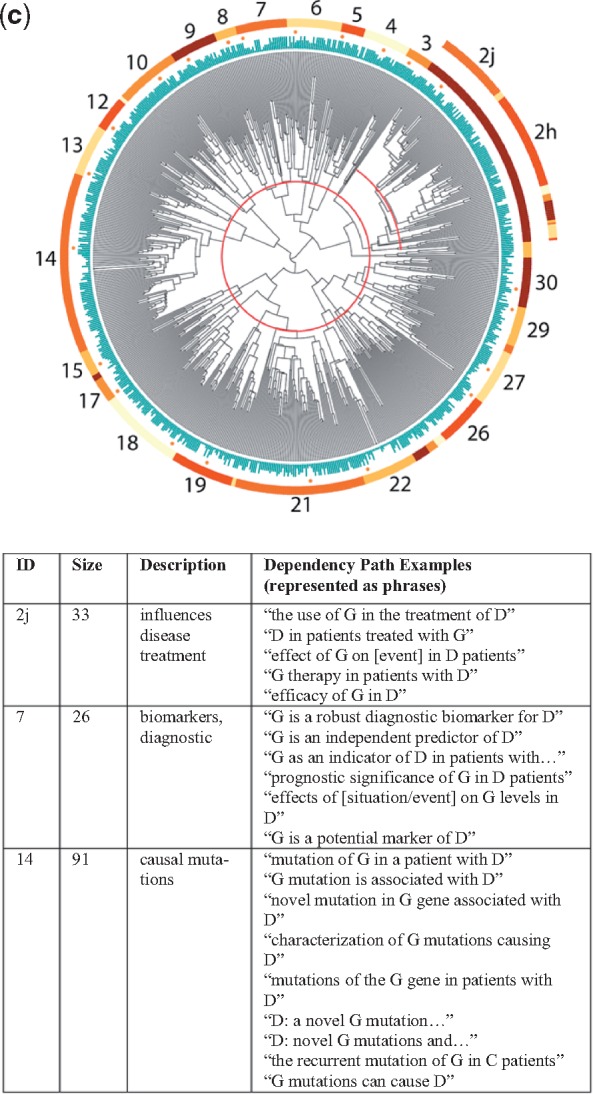
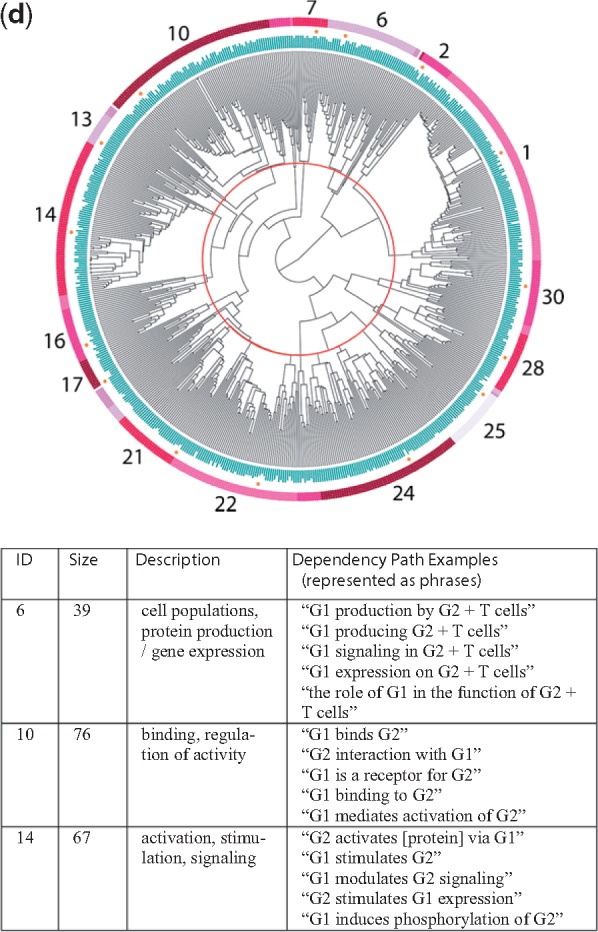
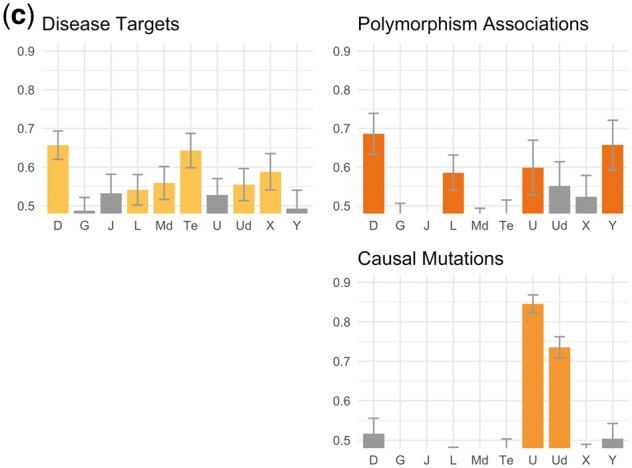
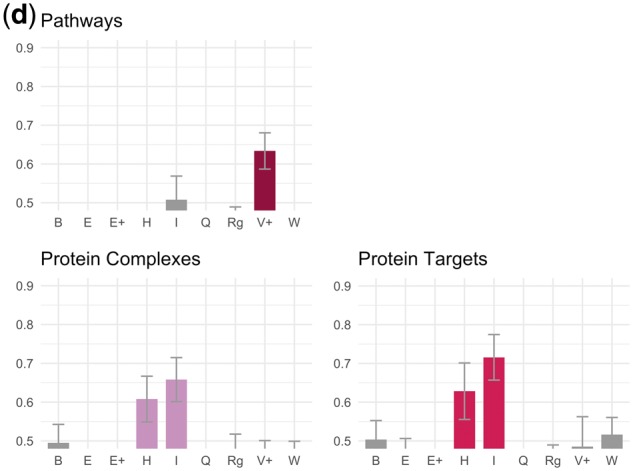
Results: Clustering revealed 10 broad themes for chemical-gene relationships, 7 for chemical-disease, 10 for gene-disease and 9 for gene-gene. In most cases, enriched themes corresponded directly to known database relationships. Our final dataset, represented as a network, contained 37 491 thematically-labeled chemical-gene edges, 2 021 192 chemical-disease edges, 136 206 gene-disease edges and 41 418 gene-gene edges, each representing a single-sentence description of an interaction from somewhere in the literature.

Availability and implementation: The complete network is available on Zenodo (https://zenodo.org/record/1035500). We have also provided the full set of dependency paths connecting biomedical entities in Medline abstracts, with associated sentences, for future use by the biomedical research community.

Supplementary information: Supplementary data are available at Bioinformatics online.


Figures

Fig. 1.
Fig. 1.
Process of converting a sentence to a structured relationship. Step 1: Named entity recognition. Step 2: Dependency parsing to produce dependency graph. Step 3: Dependency path extraction from dependency graph. Step 4: Mapping of dependency path to relationship data structure, which consists of the two entities, a direction and a structured ‘theme’ that reflects the nature of the relationship between the two entities. The methods in this paper focus on Step 4
Fig. 2.
Fig. 2.
Evaluation against known database relations. In this example, the squares represent diseases, the circles represent genes and we are evaluating one particular gene-disease theme. The database contains two relations (gene-disease pairs) that also appear in our dataset (i.e. co-occurred in a sentence at least once, connected by a dependency path to which theme supports could be assigned). There are also six other gene-disease pairs in our dataset that are not found in the database; these serve as our negative ‘background’. We create 100 bootstrap samples by sampling with replacement from both the database and background sets (only a single sample is shown here). We rank all dependency paths that connect our sampled entity pairs based on their supports for the theme. Note that the scores here are fractions and not the raw supports because we normalize the supports across all themes (by dividing by the total support across all themes) so as not to disadvantage less common dependency paths. We then calculate an AUC for the ranking against labels representing whether the entity pair connected by the path was a known database relation (1) or not (0). We repeat this process across all 100 samples and calculate a mean and standard deviation for the AUC
Fig. 3.
Fig. 3.
(a) Chemical-gene dendrogram. Each leaf node represents one dependency path. In the example patterns above, C represents the chemical and G the gene/protein
Fig. 3.
Fig. 3.
(b) Chemical-disease dendrogram. Each leaf node represents one dependency path. In the example patterns above, C represents the chemical and D the disease/phenotype
Fig. 3.
Fig. 3.
(c) Gene-disease dendrogram. Each leaf node represents one dependency path. In the example patterns above, G represents the gene/protein and D the disease/phenotype
Fig. 3.
Fig. 3.
(d) Gene–gene dendrogram. Each leaf node represents one dependency path. In the example patterns above, G1 represents the first gene/protein and G2 the second gene/protein
Fig. 4.
Fig. 4.
(a) Chemical-gene theme evaluations. This caption refers to (a)–(d). In all cases, the y-axis refers to AUC for ranking dependency paths connecting known database relations against others using scores based on their supports for a given theme (Fig. 2). Descriptions of the theme symbols are in Table 3. Error bars are one standard deviation of AUC across 100 bootstrap replicates. A bar is colored if the mean AUC is >1 SD above 0.5. Some themes led to AUCs <0.5 (i.e. database relations were depleted for these themes instead of enriched) and were cut off because the y-axis starts at 0.5
Fig. 4.
Fig. 4.
(b) Chemical-disease theme evaluations. See caption (a)
Fig. 4.
Fig. 4.
(c) Gene-disease theme evaluations. See caption in (a)
Fig. 4.
Fig. 4.
(d) Gene–gene theme evaluations. See caption in (a)

References

    1. Alex B. et al. (2008) Assisted curation: does text mining really help? In: Pacific Symposium on Biocomputing, 13, 556–567. - PubMed
    1. Baker L.D., McCallum A.K. (1998) Distributional clustering of words for text classification. In: Proceedings of the 21st Annual International ACM SIGIR Conference on Research and Development in Information Retrieval, pp. 96–103. ACM.
    1. Bien J., Tibshirani R. (2011) Hierarchical clustering with prototypes via minimax linkage. J. Am. Stat. Assoc., 106, 1075–1084. - PMC - PubMed
    1. Bollegala D.T. et al. (2010) Relational duality: unsupervised extraction of semantic relations between entities on the web. In: Proceedings of the 19th International Conference on WWW, pp. 151–160.
    1. Buyko E. et al. (2012) The extraction of pharmacogenetic and pharmacogenomic relations––a case study using PharmGKB. In: Pacific Symposium on Biocomputing, pp. 376–387. - PubMed

Publication types