. 2018 Feb 27;22(9):2395-2407.
doi: 10.1016/j.celrep.2018.02.024.

Aspirin Recapitulates Features of Caloric Restriction

Affiliations

Aspirin Recapitulates Features of Caloric Restriction

Federico Pietrocola et al. Cell Rep. .

Abstract

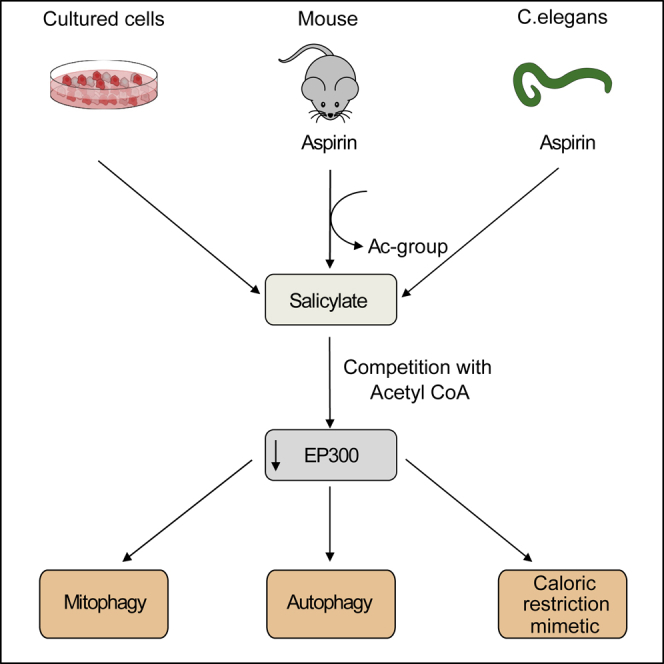
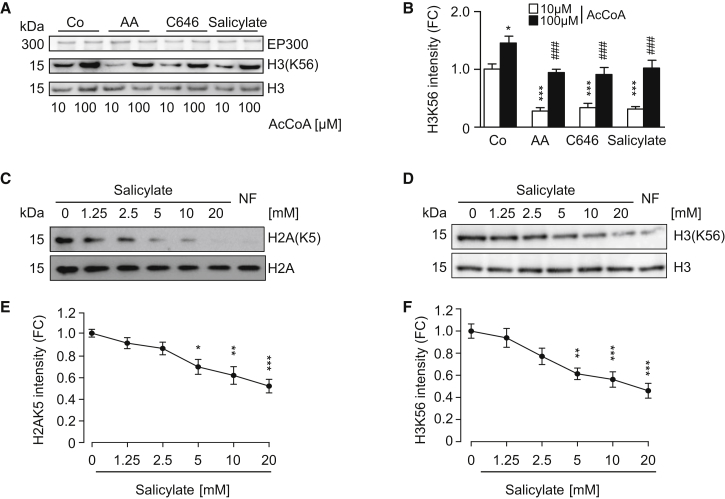
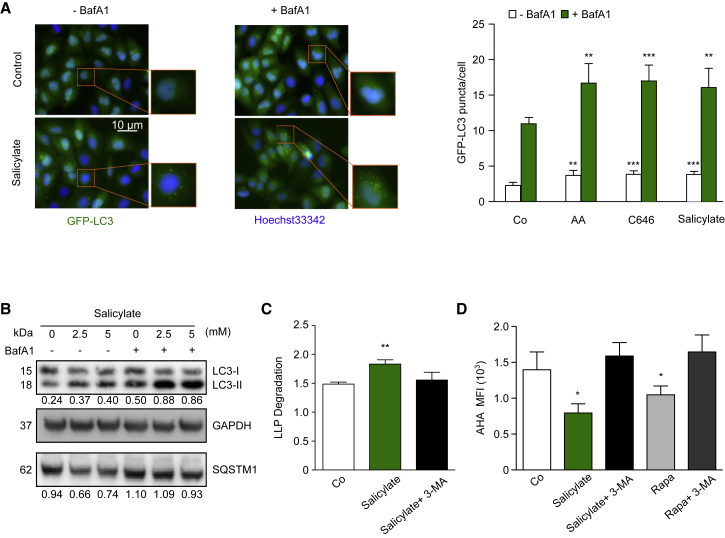
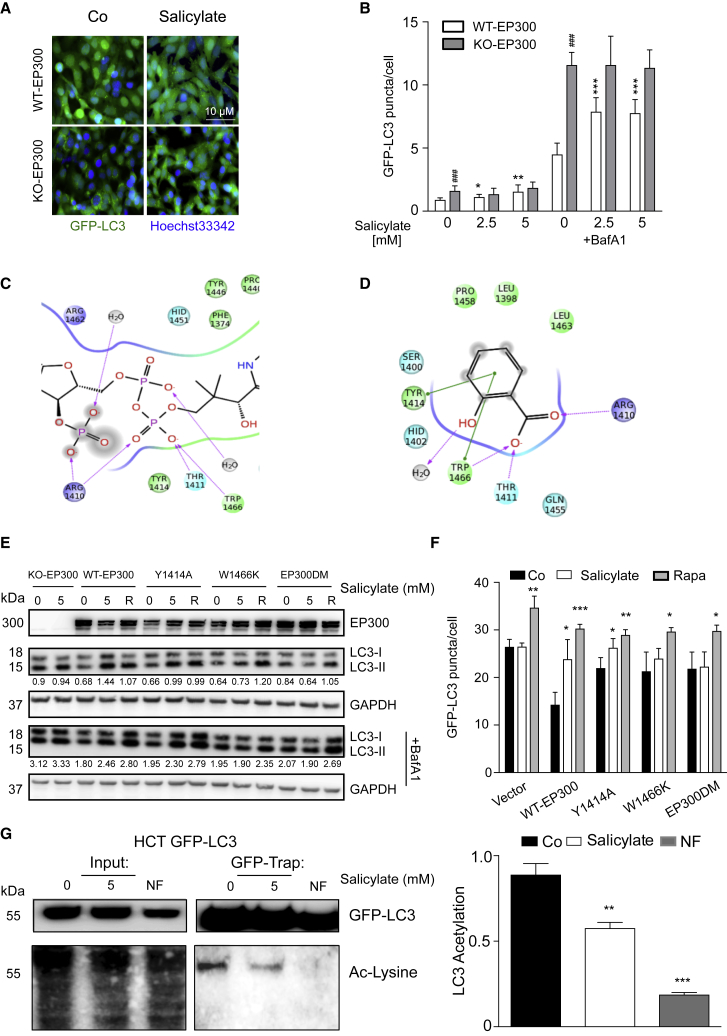
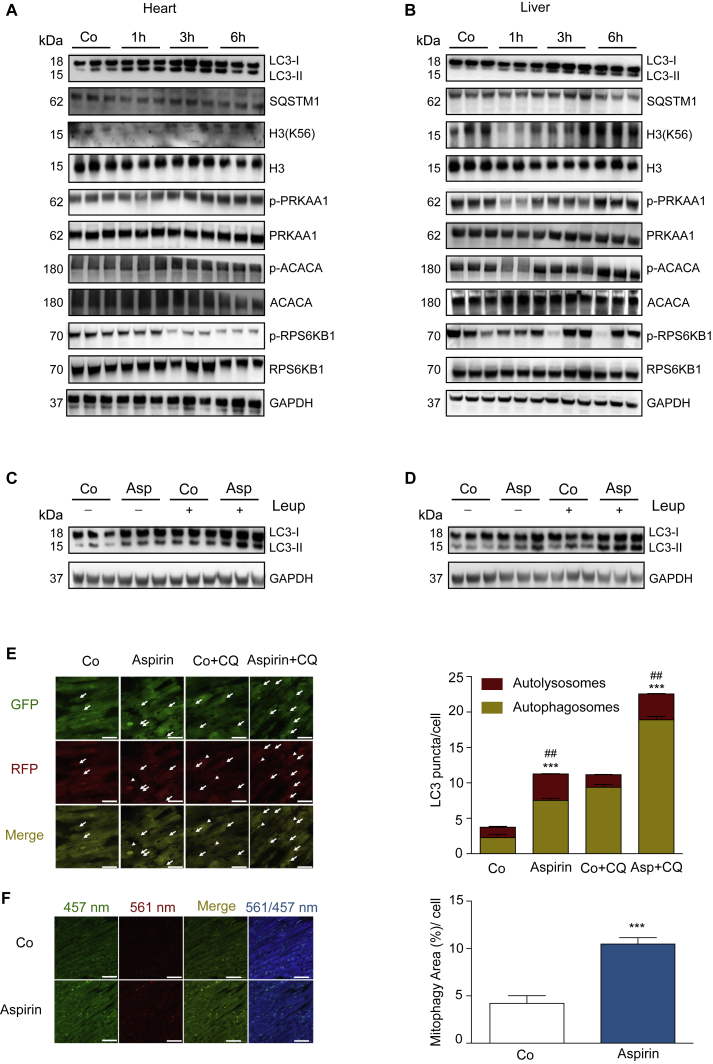
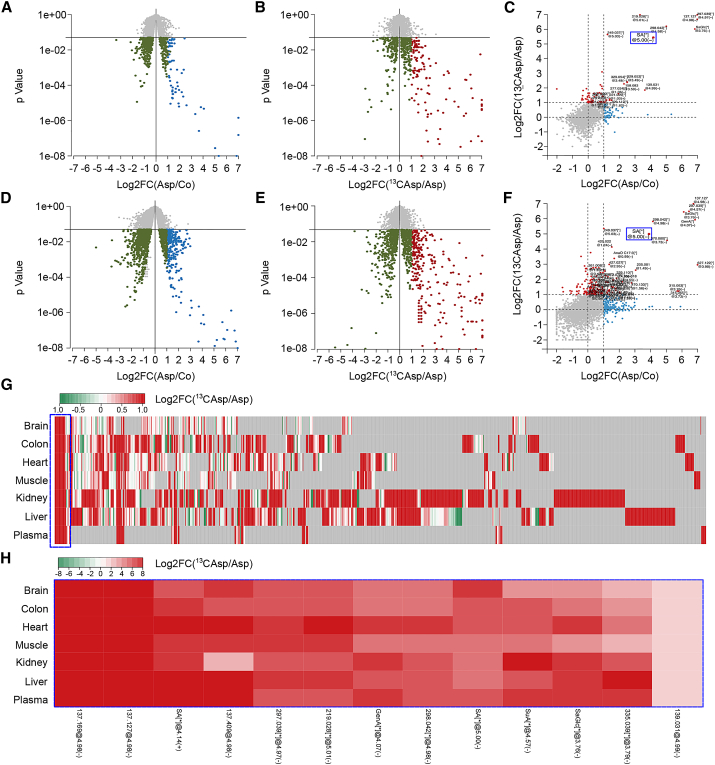
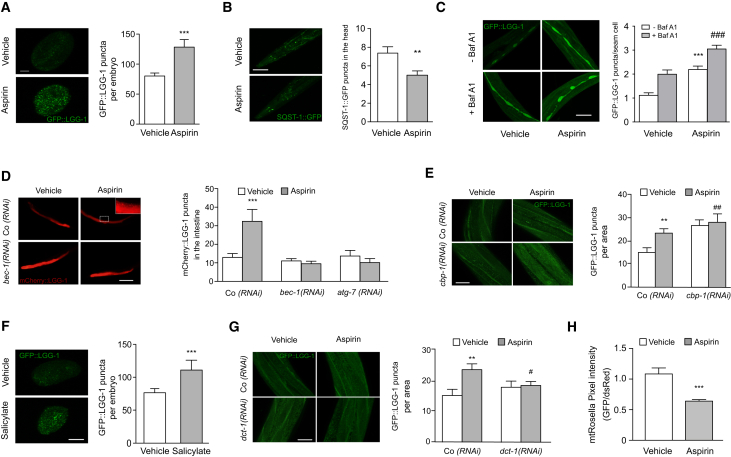
The age-associated deterioration in cellular and organismal functions associates with dysregulation of nutrient-sensing pathways and disabled autophagy. The reactivation of autophagic flux may prevent or ameliorate age-related metabolic dysfunctions. Non-toxic compounds endowed with the capacity to reduce the overall levels of protein acetylation and to induce autophagy have been categorized as caloric restriction mimetics (CRMs). Here, we show that aspirin or its active metabolite salicylate induce autophagy by virtue of their capacity to inhibit the acetyltransferase activity of EP300. While salicylate readily stimulates autophagic flux in control cells, it fails to further increase autophagy levels in EP300-deficient cells, as well as in cells in which endogenous EP300 has been replaced by salicylate-resistant EP300 mutants. Accordingly, the pro-autophagic activity of aspirin and salicylate on the nematode Caenorhabditis elegans is lost when the expression of the EP300 ortholog cpb-1 is reduced. Altogether, these findings identify aspirin as an evolutionary conserved CRM.

Keywords: EP300; acetylation; aging; autophagy; longevity; metabolome; salicylate.


Figures

None
Graphical abstract
Figure 1
Figure 1
Salicylate Inhibits EP300 Acetyltransferase by Competing with AcCoA (A and B) Direct inhibition of EP300 acetyltransferase activity by salicylate. Recombinant EP300 protein was incubated with its substrate histone H3 in the presence of AcCoA, salicylate (5 mM), anacardic acid (AA, 50 μM), or C646 (10 μM), followed by immunoblotting to detect H3 acetylation on lysine 56 (A) and quantification (B) of 4 independent experiments (means ± SEM; p < 0.05 and ∗∗∗p < 0.001, one-way ANOVA compared to 10 μM AcCoA control group; ###p < 0.001, one-way ANOVA compared to 100 μM AcCoA; FC, fold change). (C and D) Salicylate inhibits EP300 activity toward its natural substrates. Human colorectal cancer HCT116 (C) and human osteosarcoma U2OS cells (D) were incubated for 16 hr with the indicated concentration of sodium salicylate and subjected to immunoblotting to evaluate H2A acetylation on lysine 5 (C) and H3 acetylation on lysine 56 (D) (quantified in E and F). Nutrient-free (NF) medium was used as a negative control of acetylation. Representative images of one experiment are shown. (E and F) Quantification of data depicted in (C) and (D) (means ± SEM; p < 0.05, ∗∗p < 0.01, and ∗∗∗p < 0.001, one-way ANOVA compared to control group).
Figure 2
Figure 2
Aspirin Stimulates Autophagic Flux in Cultured Cells (A and B) In vitro effects of the aspirin metabolite salicylate. (A) U2OS cells expressing GFP-LC3 were treated with salicylate (5 mM), anacardic acid (AA, 50 μM), or C646 (10 μM) in the presence or absence of the lysosomal inhibitor bafilomycin A1 (Baf A1), followed by quantitation of GFP-LC3-positive puncta. Representative images (left panel) and quantitation (right panel) of the number of GFP-LC3 puncta per cell are depicted (∗∗p < 0.01 and ∗∗∗p < 0.001, unpaired t test compared with respective control condition). Data represent means ± SD from one representative experiment (n = 3). (B) HCT116 cells were incubated for 16 hr in the presence of growing concentrations of salicylate. Representative immunoblots of 4 independent experiments show the LC3I-to-LC3II conversion (in the presence or absence of BafA1) and depletion of SQSTM1/p62. (C and D) Analysis of autophagy-dependent long-lived protein (LLP) degradation upon treatment with salicylate. (C) 3-methyladenine (3-MA)-sensitive degradation of [14C]-valine-labeled long-lived proteins was determined in HCT116 cells upon treatment with salicylate. Values indicate means ± SD from one representative experiment (n = 3; ∗∗p < 0.01, unpaired t test compared to control condition). (D) Autophagy-mediated degradation of L-azidohomoalanine (L-AHA)-labeled proteins was assessed in U2OS cells after treatment with salicylate or Rapamycin (Rapa) in the presence or absence of 3-methyladenine. Maximum fluorescence intensity (MFI) values represent means ± SD from one representative experiment (n = 3; p < 0.05, unpaired t test compared to Co group).
Figure 3
Figure 3
EP300 Inhibition Is Epistatic to Salicylate-Induced Autophagy (A and B) Administration of increasing doses of salicylate to human HCT116 colorectal cancer cells stably expressing GFP-LC3 induces autophagy in wild-type (WT), yet it fails to further stimulate autophagy in EP300 knockout (KO-EP300) cells. Representative images (A, from Co versus 5-mM salicylate dose in the presence of bafilomycin A1) and quantitation of the number of GFP-LC3 puncta (B) are reported. Results (means ± SD) are from one representative experiment (p < 0.05, unpaired t test compared with respective control conditions; ∗∗p < 0.01, unpaired t test compared with respective control conditions; ∗∗∗p < 0.001, unpaired t test compared with respective control conditions; ###p < 0.001, unpaired t test compared with WT control cells). (C and D) Computational docking model of the interactions between the CoA-binding site of EP300 with Lys-CoA (C) or salicylate (D). Two amino acid residues suggested to be important for the interaction with salicylate, but not for that with AcCoA, were mutated (Y1414A and W1466K), as described in the corresponding Experimental Procedures. (E and F) HCT116 KO-EP300 cells, untagged (E) or stably expressing GFP-LC3 (F), were transfected with a vector carrying wild-type (WT), Y1414A, W1466K, or double-mutated (DM) forms of EP300. In EP300-KO HCT116 cells transfected with the W1466K or EP300 DM forms, salicylate-induced autophagy is partially or completely abrogated, respectively, as measured by following the LC3I-to-LC3II conversion by immunoblotting (E) and the formation of GFP-LC3 positive puncta (in the presence or absence of BafA1) (F). Representative immunoblots (E) and automated videomicroscopy-based quantitation of the number of GFP-LC3 puncta/cell (F) are depicted. Rapamycin (R) was used as a positive control of autophagy induction (means ± SD). One representative experiment is shown (n = 3; p < 0.05, ∗∗p < 0.01, and ∗∗∗p < 0.001, unpaired t test compared with respective control group). (G) Salicylate reduces the EP300-dependent acetylation of autophagic protein LC3. HCT116 cells stably expressing GFP-LC3 were incubated for 16 hr with the indicated concentration of salicylate followed by GFP-Trap-based immunoprecipitation. NF medium was used as a negative control of LC3 acetylation. Acetylation status of GFP-LC3 immunoprecipitate was assessed by means of an antibody recognizing acetylated residues on proteins (left panel) and quantified (right panel). Values represent means ± SEM from three independent experiments (normalized on immunoprecipitated GFP levels) (∗∗∗p < 0.001 and ∗∗p < 0.01, one-way ANOVA).
Figure 4
Figure 4
Induction of Autophagy by Acetylsalicylic Acid In Vivo (A and B) Representative immunoblots (n = 3 mice per condition, n = 3 experiments) showing LC3I-to-LC3II conversion and depletion of the autophagic substrate SQSTM1/p62 in the heart (A) and in the liver (B) (1, 3, and 6 hr after intraperitoneal (i.p.) injection of 100 mg/kg aspirin). Autophagy induction in vivo is paralleled by a transient decrease in H3K56 acetylation, precedes PRKAA activation (as monitored by upstream kinase-dependent phosphorylation on Thr172 and an increase in PRKAA-mediated ACACA phosphorylation on Ser79), and it is accompanied by a reduction in the mTORC1 substrate PRS6K1. GAPDH levels were monitored to ensure equal protein content. Quantification of (A) and (B) are shown in Figures S3A–S3F and S4A–S4F, respectively. (C and D) Representative immunoblots (n = 2 experiments, n = 3 mice per group) showing LC3I-to-LC3II conversion in the presence or absence of the protease inhibitor leupeptin (Leup) in the heart (C) and liver (D) 6 hr after aspirin treatment. Quantifications are presented in Figures S3G and S4G, respectively. (E and F) Long-term aspirin treatment enhances autophagic flux in the heart and stimulates mitophagy. (E) Transgenic mice expressing the tandem-fluorescent mRFP-GFP-LC3 (Tg-tf-LC3) were treated for 2 weeks with 25 mg/kg aspirin by oral gavage, and autophagic flux was assessed by the injection of chloroquine (10 mg/kg) 4 hr prior to euthanasia. Representative images of fluorescent GFP-LC3 puncta and mRFP-puncta are shown in the left panel. Arrows, autophagosomes; arrowheads, autolysosomes. Values in the right panel represent mean number of autophagosomes (yellow bars) and autolysosomes (red bars) per cell ± SD from one representative experiment (∗∗∗p < 0.001 and ##p < 0.01, one-way ANOVA compared to respective control conditions). (F) Evaluation of mitochondrial autophagy by transgenic Mito-Keima mice. 2-month-old C57BL/6J mouse hearts were examined in the control versus aspirin-treated group (n = 3 mice/group). Representative images of Mito-Keima green (457 nm), Mito-Keima red (561 nm), the merged image, and a ratiometric image of red-to-green Mito-Keima (561/457 nm) indicating mitophagy are shown (left panel) and quantified (right panel). Values represent means ± SD from one representative experiment (∗∗∗p < 0.001, unpaired t test compared to control group). Scale bar, 50 μm.
Figure 5
Figure 5
Metabolomics Analysis of Aspirin-Derived Metabolites The 6-week old C57BL/6 mice were injected with unlabeled aspirin (Asp) or [13C]-labeled aspirin (13CAsp) (100 mg/kg, i.p.), followed by mass spectrometry. (A and D) Volcano plots relative to metabolites detected in the heart (A) and in the liver (D) after unlabeled aspirin injection. Log2FC of Asp/Co-downregulated (green) or -upregulated (blue) metabolites with p value < 0.05 is represented. (B and E) Volcano plots relative to metabolites detected in the heart (B) and in the liver (E) after [13C]-labeled aspirin injection. Log2FC of 13CAsp/Asp-downregulated (green) or -upregulated (red) metabolites with p value < 0.05 is depicted. (C and F) Comparison between 13CAsp/Asp (red) and Asp/Co (blue). Log2FC significantly changed (p value < 0.05) in the heart (C) and in the liver (F) is graphed. The blue box highlights salicylate, which represents a commonly upregulated metabolite in all organs assessed. (G and H) Heatmap (Log2FC) of 13CAsp/Asp metabolites in different organs (G) is shown. [13C]-Aspirin administration allows the identification of bona fide aspirin-derived metabolites, which are distributed in an organ-specific fashion. Common upregulated metabolites are highlighted with a blue box. Magnification is shown in (H). Pre-annotated metabolites are as follows: SA[]@4.14, salicylic acid, positive mode; GenA[]@4.07(-), gentisic/2-pyrocatechuic acid; SA[]@5.00(-), salicylic acid, negative mode; SuA[]@4.57(-), salicyluric acid; and SaGlc[]@3.76(-), salicylate glucuronide. Details are available in Table S2.
Figure 6
Figure 6
Aspirin Activates Autophagy in C. elegans and Reduces Aging in an Autophagy Gene-Dependent Manner (A) Representative confocal images (left panel) of GFP::LGG-1-expressing embryos treated with 1 mM aspirin compared to vehicle and quantification of GFP::LGG-1 puncta per embryo (right panel). Scale bar, 10 μm. Data represent means ± SEM of at least 15 images obtained across 2 independent experiments (∗∗∗p < 0.001, unpaired t test compared to vehicle-treated nematodes). (B) Aspirin administration promotes proficient autophagic flux, as monitored by the reduction in levels of SQST-1/p62 autophagic substrate in the pharyngeal region of SQST-1::GFP transgenic animals at day 1 of adulthood. Representative images (left panel) and quantification (right panel) are shown. Scale bar, 20 μm. Data represent means ± SEM of n = 52 worms per group, pooled from three independent experiments (∗∗p < 0.01, unpaired t test). (C) Aspirin stimulates autophagic flux. Representative confocal images (left panel) and quantification (right panel) of GFP::LGG-1 puncta in the hypodermal seam cells of L3–L4 larvae treated or not from the L4 stage of the first generation with 1 mM aspirin in the absence or in the presence of bafilomycin A1 (100 μg/mL). Scale bar, 10 μm. Data represent means ± SEM of n = 196–329 seam cells, pooled from two independent experiments (∗∗∗p < 0.001, one-way ANOVA compared to vehicle – BafA1 treatment; ###p < 0.001, one-way ANOVA compared to vehicle + BafA1 treatment). (D) Administration of aspirin induces the autophagy-dependent increase of pnhx-2mCherry::LGG-1 puncta in the intestine of 2-day-old adults, which is lost upon siRNA-mediated depletion of BEC-1 and ATG-7. Epifluorescence images are depicted in the left panel (magnification indicates mCherry::LGG-1 puncta as detected in aspirin-treated worms) and quantified in the right panel. Scale bar, 100 μm. Data represent means ± SEM of n = 15–28 worms per group, pooled from two independent experiments (∗∗∗p < 0.001, one-way ANOVA compared to vehicle Co RNAi). (E) CBP-1 depletion is epistatic to aspirin-induced autophagy. RNAi-driven elimination of cbp-1 in transgenic animals expressing the GFP::LGG-1 reporter leads to an increase in the number of GFP::LGG-1 puncta, which are not further increased by aspirin administration. Representative confocal images (left panel) and corresponding quantification (right panel) are shown. Scale bar, 10 μm. Data represent means ± SEM (##p < 0.005 and ∗∗p < 0.01, unpaired t test compared to Co RNAi-vehicle condition). (F) Salicylate induces autophagy in C. elegans. Representative confocal images (left panel) and corresponding quantification (right panel) of GFP::LGG-1 puncta in transgenic embryos treated with vehicle or salicylate (1 mM). Vehicle bar is shared with experiments depicted in (A) as assays were conducted in parallel. Data represent means ± SEM of at least 15 images obtained in 2 independent experiments (∗∗∗p < 0.001, unpaired t test compared to vehicle-treated nematodes). (G) Knockdown of dct-1, a putative ortholog to the mammalian NIX/BNIP3L and BNIP3, reduces the number of GFP::LGG-1-positive foci in the epidermis of aspirin-treated young adult wild-type animals. Representative confocal images (left panel) and corresponding quantification (right panel) are depicted. Scale bar, 10 μm. Values represent means ± SEM (∗∗p < 0.01, unpaired t test compared with Co RNAi vehicle; #p < 0.05, unpaired t test compared with Co RNAi aspirin). Co RNAi vehicle and aspirin bars are shared with data depicted in (E), as assays were conducted in parallel. (H) Mitophagy is induced in nematodes treated with aspirin. Transgenic animals expressing the mt-Rosella biosensor in the body wall muscle cells were treated with 1 mM aspirin or vehicle control. Mitophagy induction is signified by the reduction of the ratio between pH-sensitive GFP to pH-insensitive DsRed. Data represent means ± SEM of n = 22–33 worms per group, pooled from two independent experiments (∗∗∗p < 0.001, unpaired t test).

Comment in

  • Aspirin-another caloric-restriction mimetic.
    Pietrocola F, Castoldi F, Maiuri MC, Kroemer G. Pietrocola F, et al. Autophagy. 2018;14(7):1162-1163. doi: 10.1080/15548627.2018.1454810. Epub 2018 Jul 18. Autophagy. 2018. PMID: 29929449 Free PMC article.

References

    1. Ali B., Kaur S. Mammalian tissue acetylsalicylic acid esterase(s): identification, distribution and discrimination from other esterases. J. Pharmacol. Exp. Ther. 1983;226:589–594. - PubMed
    1. Baron J.A., Cole B.F., Sandler R.S., Haile R.W., Ahnen D., Bresalier R., McKeown-Eyssen G., Summers R.W., Rothstein R., Burke C.A. A randomized trial of aspirin to prevent colorectal adenomas. N. Engl. J. Med. 2003;348:891–899. - PubMed
    1. Bauvy C., Meijer A.J., Codogno P. Assaying of autophagic protein degradation. Methods Enzymol. 2009;452:47–61. - PubMed
    1. Bowers E.M., Yan G., Mukherjee C., Orry A., Wang L., Holbert M.A., Crump N.T., Hazzalin C.A., Liszczak G., Yuan H. Virtual ligand screening of the p300/CBP histone acetyltransferase: identification of a selective small molecule inhibitor. Chem. Biol. 2010;17:471–482. - PMC - PubMed
    1. Cantó C., Houtkooper R.H., Pirinen E., Youn D.Y., Oosterveer M.H., Cen Y., Fernandez-Marcos P.J., Yamamoto H., Andreux P.A., Cettour-Rose P. The NAD(+) precursor nicotinamide riboside enhances oxidative metabolism and protects against high-fat diet-induced obesity. Cell Metab. 2012;15:838–847. - PMC - PubMed

Publication types