. 2018 Feb 27;22(9):2469-2481.
doi: 10.1016/j.celrep.2018.02.028.

PHLDA1 Mediates Drug Resistance in Receptor Tyrosine Kinase-Driven Cancer

Affiliations

PHLDA1 Mediates Drug Resistance in Receptor Tyrosine Kinase-Driven Cancer

Abbie E Fearon et al. Cell Rep. .

Abstract

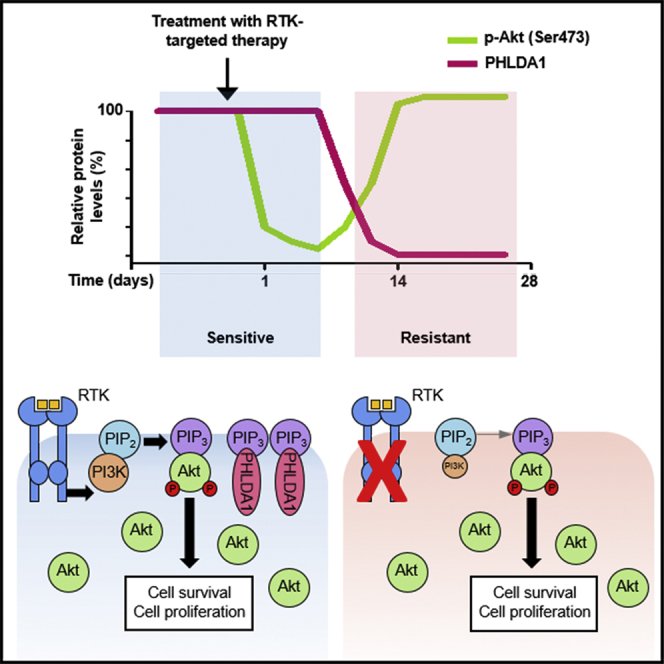
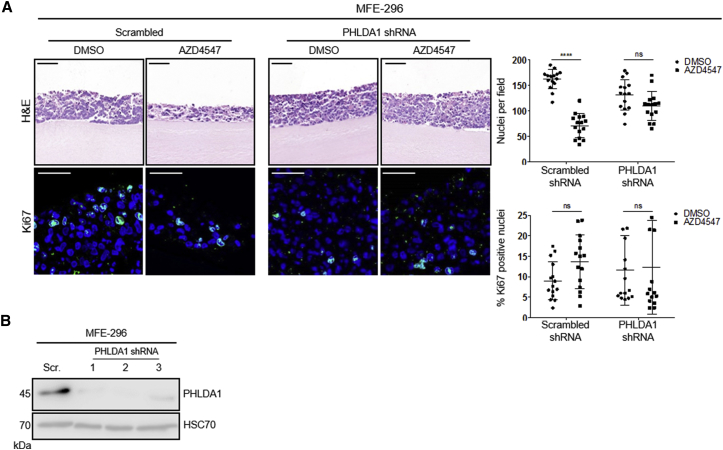
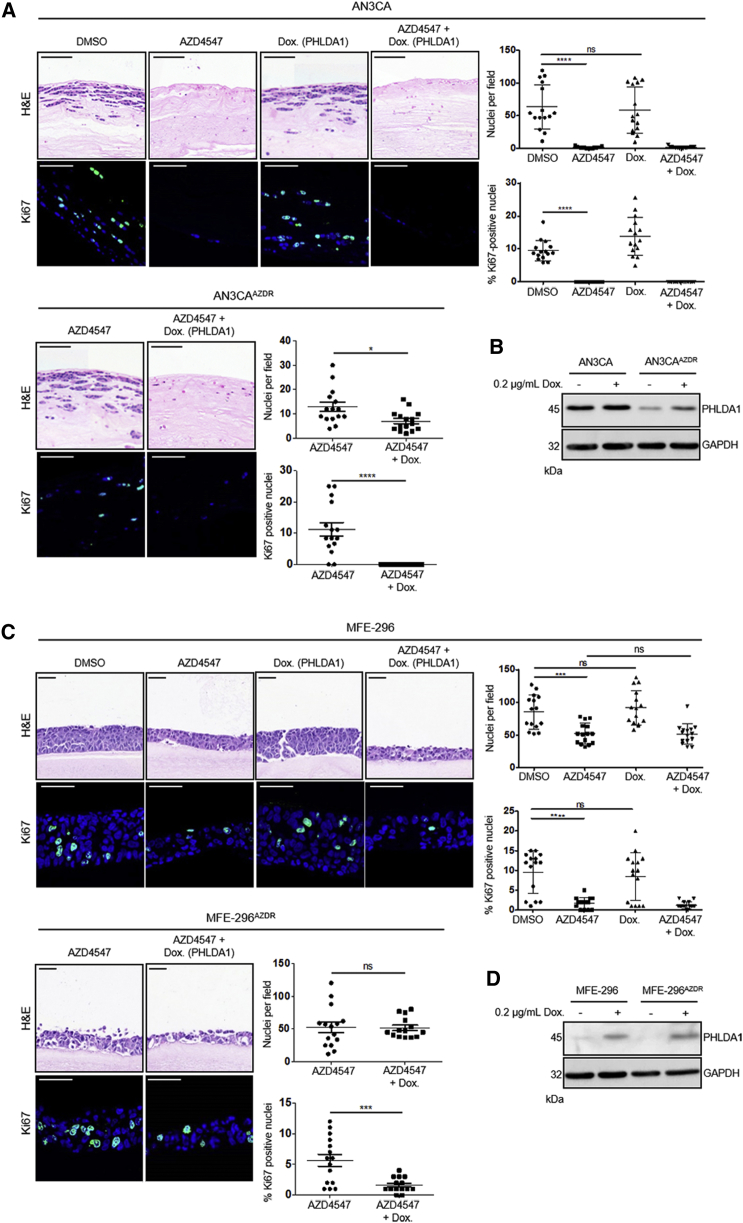
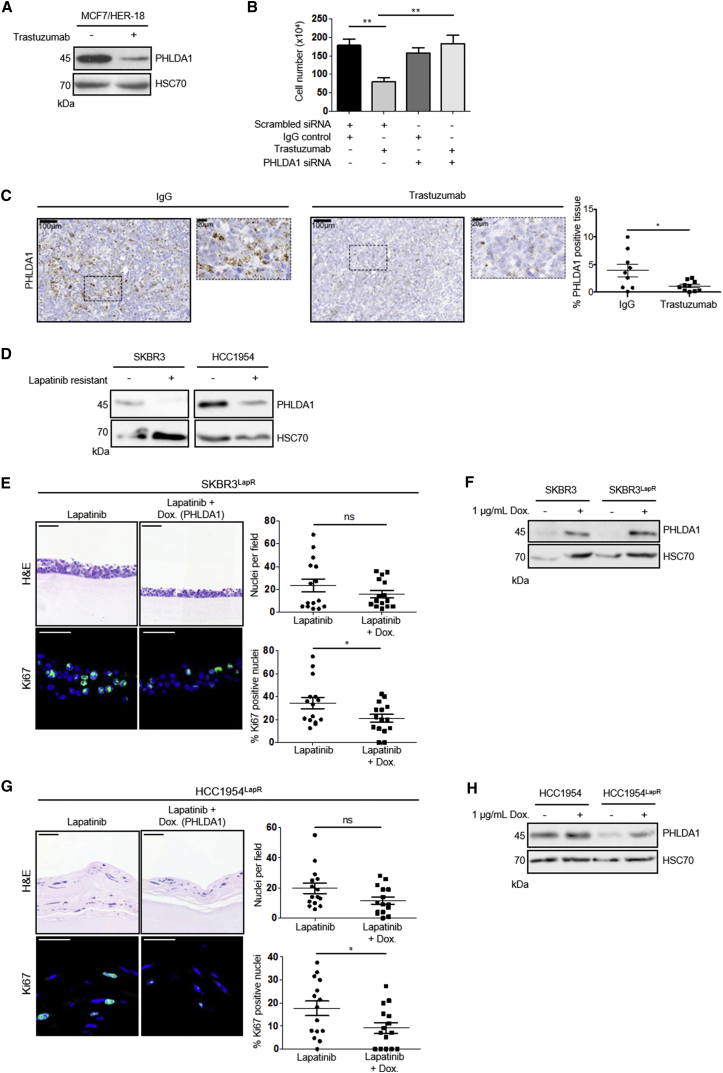
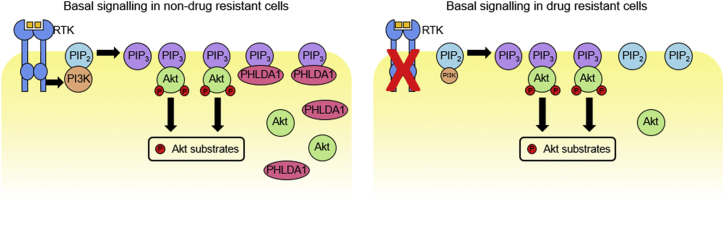
Development of resistance causes failure of drugs targeting receptor tyrosine kinase (RTK) networks and represents a critical challenge for precision medicine. Here, we show that PHLDA1 downregulation is critical to acquisition and maintenance of drug resistance in RTK-driven cancer. Using fibroblast growth factor receptor (FGFR) inhibition in endometrial cancer cells, we identify an Akt-driven compensatory mechanism underpinned by downregulation of PHLDA1. We demonstrate broad clinical relevance of our findings, showing that PHLDA1 downregulation also occurs in response to RTK-targeted therapy in breast and renal cancer patients, as well as following trastuzumab treatment in HER2+ breast cancer cells. Crucially, knockdown of PHLDA1 alone was sufficient to confer de novo resistance to RTK inhibitors and induction of PHLDA1 expression re-sensitized drug-resistant cancer cells to targeted therapies, identifying PHLDA1 as a biomarker for drug response and highlighting the potential of PHLDA1 reactivation as a means of circumventing drug resistance.

Keywords: Akt; FGF; cancer; drug resistance; targeted therapy; tyrosine kinase inhibitor.


Figures

None
Graphical abstract
Figure 1
Figure 1
Generation of FGFR Inhibitor-Resistant Endometrial Cancer Cell Populations In Vitro (A) Western blot analysis of FGFR2 and phosphorylated FRS2α (Tyr436) in serum-starved MFE-296, AN3CA, and Ishikawa cells. Data are representative of three independent experiments. (B–D) Upper: H&E staining of MFE-296 (B), AN3CA (C), and Ishikawa (D) cells grown in organotypic cultures for 14 days with or without 1 μM PD173074. Lower: Ki67 staining with nuclei counterstained by DAPI. Right: quantitation of cell number and Ki67 positive nuclei per field of view. Data are presented as mean ± SEM. Images are representative of at least three independent experiments. H&E image scale bar, 100 μm; Ki67 image scale bar, 50 μm. ∗∗∗p ≤ 0.001, compared with DMSO controls. H&E images are automatically spliced composites.
Figure 2
Figure 2
Phosphoproteomic Analysis of Endometrial Cancer Cell Lines Identifies a Pivotal Role for Akt Signaling in FGFR Inhibitor Resistance (A) Dendrogram of the hierarchical clustering (Pearson correlation distance metric) of phosphoproteomic signatures obtained through mass spectrometry of MFE-296 cells treated with DMSO, 1 μM PD173074 (PD), or untreated (UT) over 1, 7, and 14 days. (B) Representation of changes in the phosphoproteome of MFE-296 cells treated with 1 μM PD173074 compared to DMSO controls at 1, 7, and 14 days. (C) Western blot showing changes in pAkt (Ser473) induced by treatment of MFE-296 cells with 1 μM PD173074 over 14 days. Data are representative of three independent experiments. (D) Left: H&E staining and Ki67 staining of MFE-296PDR cells (upper) and Ishikawa cells (lower) grown in organotypic cultures for 7 days. Cells were cultured in 1 μM PD173074 with or without 1 μM MK2206. Right: quantitation of cell number and Ki67 positive nuclei. Data are presented as mean ± SEM. Images are representative of at least three independent experiments. H&E images scale bar, 100 μm; Ki67 images scale bar, 50 μm. ∗∗∗p ≤ 0.001, ∗∗p ≤ 0.01. H&E images are automatically spliced composites.
Figure 3
Figure 3
PHLDA1 Negatively Regulates Akt and Is Downregulated in FGFR Inhibitor-Resistant Endometrial Cancer Cell Lines (A) Top ten downregulated genes in MFE-296PDR cells (left) and MFE-296AZDR cells (right) compared to parental controls, identified by microarray analysis. (B–D) Western blot showing downregulation of PHLDA1 levels in parental MFE-296 (B) and AN3CA (C) cells following treatment with 1 μM AZD4547 for 24 hr and persistent downregulation of PHLDA1 in MFE-296AZDR and AN3CAAZDR cells following removal of 1 μM AZD4547 for 24 hr. PHLDA1 levels in Ishikawa cells (D) were unaffected by FGFR inhibitor treatment. (E) Left: western blot showing reduced p-Akt (pSer473) in HCC1954 cells following transfection with GFP-PHLDA1. Right: quantitation of p-Akt (Ser473), normalized to total Akt and GAPDH. Data are presented as mean fold change ±SEM in p-Akt (Ser473) ∗∗∗p ≤ 0.001. (F) MFE-296 cells were transfected with constructs encoding GFP-PHLDA1, GFP-mtPHLDA1, or GFP-PH-Akt for 48 hr prior to fixation. Nuclei were labeled with DAPI, and F-actin was visualized using Alexa Fluor 546 Phalloidin (red). Scale bar, 50 μm. (G) Domain organization of PHLDA1. PH domain, pleckstrin homology domain; QQ, polyglutamine tract; P-Q, proline-glutamine rich tract; P-H, proline-histidine rich tract. Residues deleted in mtPHLDA1 are indicated in red.
Figure 4
Figure 4
PHLDA1 Downregulation Confers De Novo Resistance to FGFR Inhibitors (A) Upper: H&E staining of MFE-296 cells expressing either scrambled or PHLDA1 shRNA, grown in mini-organotypic cultures for 14 days with or without 1 μM AZD4547. Lower: Ki67 staining with nuclei counterstained by DAPI. Images are representative of three independent experiments conducted with three distinct shRNA sequences. Right: quantitation of cell number and percentage of Ki67 positive nuclei. Data are presented as mean ± SEM. H&E image scale bar, 100 μm; Ki67 image scale bar, 50 μm. ∗∗∗p ≤ 0.001. H&E images are automatically spliced composites. (B) Western blot analysis of PHLDA1 levels in MFE-296 expressing either scrambled or PHLDA1 shRNA.
Figure 5
Figure 5
Recovery of PHLDA1 Expression Re-sensitizes Resistant Cells to FGFR Inhibitors (A and C) Upper: H&E staining of parental and AZD4547-resistant AN3CA (A) and MFE-296 cells (C) containing a doxycycline-inducible PHLDA1 expression construct. Cells were grown in mini-organotypic cultures for 7 days with or without 1 μM AZD4547 and 0.2 μg/mL doxycycline. Lower: Ki67 staining with nuclei counterstained by DAPI. Right: quantitation of cell number and percentage of Ki67 positive nuclei. Data are presented as mean ± SEM. Images are representative of at least three independent experiments. H&E image scale bar, 100 μm; Ki67 image scale bar, 50 μm. ∗∗∗p ≤ 0.001. H&E images are automatically spliced composites. (B and D) Western blot showing PHLDA1 levels in parental and resistant AN3CA cells (B) and MFE-296 cells (D) following doxycycline treatment. Data are representative of three independent experiments.
Figure 6
Figure 6
PHLDA1 Levels Regulate Sensitivity to Trastuzumab and Lapatinib Treatment (A) Western blot analysis of PHLDA1 levels in MCF7/HER2-18 cells cultured with 1 μM trastuzumab or IgG control for 72 hr. (B) MCF7/HER2-18 cell number following 3-day treatment with 1 μM trastuzumab preceded by 48-hr siRNA knockdown of PHLDA1 or scrambled control. (C) In situ hybridization for PHLDA1 expression in MCF7/HER2-18 xenograft tumors. Four-week-old tumors from mice treated with an IgG control showed strong PHLDA1 mRNA expression (brown), whereas treatment with trastuzumab resulted in significantly weaker staining, as shown in graph on right. Sections were counterstained with hematoxylin, and dotted boxes represent zoomed-in areas. Data are presented as mean ± SEM from at least eight mice for each condition. p ≤ 0.05, ∗∗p ≤ 0.01, compared with IgG controls. (D) Western blot showing PHLDA1 levels in parental and lapatinib-resistant SKBR3 and HCC1954 cells treated with 2 μM lapatinib or DMSO control for 48 hr. (E and G). Upper: H&E staining of SKBR3LapR (E) and HCC1954LapR cells (G) containing a doxycycline-inducible PHLDA1 expression construct. Cells were grown in mini-organotypic cultures for 7 days with or without 2 μM lapatinib and 1 μg/mL doxycycline. Lower: Ki67 staining with nuclei counterstained by DAPI. Right: quantitation of cell number and Ki67-positive nuclei. Data are presented as mean ± SEM. Images are representative of at least three independent experiments. H&E image scale bar, 100 μm; Ki67 image scale bar, 50 μm. ∗∗∗p ≤ 0.001. H&E images are automatically spliced composites. (F and H) Western blot showing PHLDA1 levels in parental and resistant SKBR3 cells (F) and HCC1954 cells (H) following treatment with doxycycline.
Figure 7
Figure 7
Model for PHLDA1 Silencing as a Mechanism of Acquired Drug Resistance In normal growth conditions (left), strong PI3K activity results in generation of ample PIP3 at the cell membrane. This enables the recruitment of Akt and PDK1 (not shown), resulting in Akt phosphorylation and subsequent activation. PHLDA1 can buffer this signaling by competing for free PIP3. When RTK activity is blocked by pharmacological inhibition (right), PI3K activity is reduced, leading to a reduction in free PIP3. This results in decreased Akt signaling, and reduced cell division/survival. Cells can establish resistance by silencing PHLDA1 expression, thus removing the competition for free PIP3 binding. This would allow Akt signaling to recover, even in the absence of a strong RTK driver.

References

    1. Alcolea M.P., Casado P., Rodríguez-Prados J.C., Vanhaesebroeck B., Cutillas P.R. Phosphoproteomic analysis of leukemia cells under basal and drug-treated conditions identifies markers of kinase pathway activation and mechanisms of resistance. Mol. Cell. Proteomics. 2012;11:453–466. - PMC - PubMed
    1. Bonatto N., Carlini M.J., De Bessa Garcia S.A., Nagai M.A. PHLDA1 (pleckstrin homology-like domain, family A, member 1) knockdown promotes migration and invasion of MCF10A breast epithelial cells. Cell Adh Migr. 2017;12:37–46. - PMC - PubMed
    1. Byron S.A., Gartside M.G., Wellens C.L., Mallon M.A., Keenan J.B., Powell M.A., Goodfellow P.J., Pollock P.M. Inhibition of activated fibroblast growth factor receptor 2 in endometrial cancer cells induces cell death despite PTEN abrogation. Cancer Res. 2008;68:6902–6907. - PubMed
    1. Byron S.A., Loch D.C., Pollock P.M. Fibroblast growth factor receptor inhibition synergizes with Paclitaxel and Doxorubicin in endometrial cancer cells. Int. J. Gynecol. Cancer. 2012;22:1517–1526. - PubMed
    1. Byron S.A., Chen H., Wortmann A., Loch D., Gartside M.G., Dehkhoda F., Blais S.P., Neubert T.A., Mohammadi M., Pollock P.M. The N550K/H mutations in FGFR2 confer differential resistance to PD173074, dovitinib, and ponatinib ATP-competitive inhibitors. Neoplasia. 2013;15:975–988. - PMC - PubMed

Publication types

MeSH terms