Understanding Costs of Care in the Operating Room
- PMID: 29490366
- PMCID: PMC5875376
- DOI: 10.1001/jamasurg.2017.6233
Understanding Costs of Care in the Operating Room
Abstract
Importance: Increasing value requires improving quality or decreasing costs. In surgery, estimates for the cost of 1 minute of operating room (OR) time vary widely. No benchmark exists for the cost of OR time, nor has there been a comprehensive assessment of what contributes to OR cost.
Objectives: To calculate the cost of 1 minute of OR time, assess cost by setting and facility characteristics, and ascertain the proportion of costs that are direct and indirect.
Design, setting, and participants: This cross-sectional and longitudinal analysis examined annual financial disclosure documents from all comparable short-term general and specialty care hospitals in California from fiscal year (FY) 2005 to FY2014 (N = 3044; FY2014, n = 302). The analysis focused on 2 revenue centers: (1) surgery and recovery and (2) ambulatory surgery.
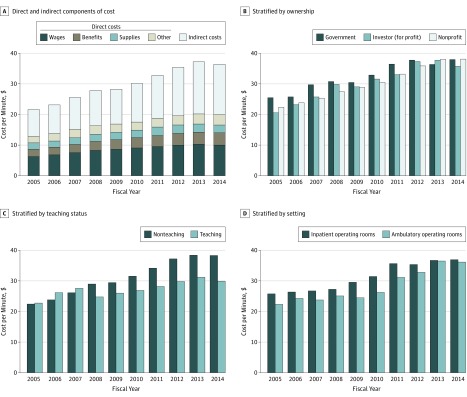
Main outcomes and measures: Mean cost of 1 minute of OR time, stratified by setting (inpatient vs ambulatory), teaching status, and hospital ownership. The proportion of cost attributable to indirect and direct expenses was identified; direct expenses were further divided into salary, benefits, supplies, and other direct expenses.
Results: In FY2014, a total of 175 of 302 facilities (57.9%) were not for profit, 78 (25.8%) were for profit, and 49 (16.2%) were government owned. Thirty facilities (9.9%) were teaching hospitals. The mean (SD) cost for 1 minute of OR time across California hospitals was $37.45 ($16.04) in the inpatient setting and $36.14 ($19.53) in the ambulatory setting (P = .65). There were no differences in mean expenditures when stratifying by ownership or teaching status except that teaching hospitals had lower mean (SD) expenditures than nonteaching hospitals in the inpatient setting ($29.88 [$9.06] vs $38.29 [$16.43]; P = .006). Direct expenses accounted for 54.6% of total expenses ($20.40 of $37.37) in the inpatient setting and 59.1% of total expenses ($20.90 of $35.39) in the ambulatory setting. Wages and benefits accounted for approximately two-thirds of direct expenses (inpatient, $14.00 of $20.40; ambulatory, $14.35 of $20.90), with nonbillable supplies accounting for less than 10% of total expenses (inpatient, $2.55 of $37.37; ambulatory, $3.33 of $35.39). From FY2005 to FY2014, expenses in the OR have increased faster than the consumer price index and medical consumer price index. Teaching hospitals had slower growth in costs than nonteaching hospitals. Over time, the proportion of expenses dedicated to indirect costs has increased, while the proportion attributable to salary and supplies has decreased.
Conclusions and relevance: The mean cost of OR time is $36 to $37 per minute, using financial data from California's short-term general and specialty hospitals in FY2014. These statewide data provide a generalizable benchmark for the value of OR time. Furthermore, understanding the composition of costs will allow those interested in value improvement to identify high-yield targets.
Conflict of interest statement
Figures
Comment in
-
How Should Surgeons Interpret Operating Room Costs?: Valuing Our Time.JAMA Surg. 2018 Apr 18;153(4):e176234. doi: 10.1001/jamasurg.2017.6234. Epub 2018 Apr 18. JAMA Surg. 2018. PMID: 29490354 No abstract available.
References
-
- Bai G, Anderson GF. Extreme markup: the fifty US hospitals with the highest charge-to-cost ratios. Health Aff (Millwood). 2015;34(6):922-928. - PubMed
-
- Nathan H, Dimick JB. Medicare’s shift to mandatory alternative payment models: why surgeons should care. JAMA Surg. 2017;152(2):125-126. - PubMed
-
- Gitelis M, Vigneswaran Y, Ujiki MB, et al. Educating surgeons on intraoperative disposable supply costs during laparoscopic cholecystectomy: a regional health system’s experience. Am J Surg. 2015;209(3):488-492. - PubMed
-
- Guzman MJ, Gitelis ME, Linn JG, et al. A Model of cost reduction and standardization: improved cost savings while maintaining the quality of care. Dis Colon Rectum. 2015;58(11):1104-1107. - PubMed
-
- Krpata DM, Haskins IN, Rosenblatt S, Grundfest S, Prabhu A, Rosen MJ. Development of a disease-based hernia program and the impact on cost for a hospital system. Ann Surg. 2018;267(2):370-374. - PubMed
Publication types
MeSH terms
Grants and funding
LinkOut - more resources
Full Text Sources
Other Literature Sources
Medical