

Mosquito net coverage in years between mass distributions: a case study of Tanzania, 2013
- PMID: 29490649
- PMCID: PMC5831856
- DOI: 10.1186/s12936-018-2247-z
Mosquito net coverage in years between mass distributions: a case study of Tanzania, 2013
Abstract
Background: The Government of Tanzania is the main source of long-lasting insecticidal nets (LLINs) for its population. Mosquito nets (treated and untreated) are also available in the commercial market. To sustain investments and health gains in the fight against malaria, it is important for the National Malaria Control Programme to monitor LLIN coverage especially in the years between mass distributions and to understand what households do if their free nets are deemed unusable. The aim of this paper was to assess standard LLIN indicators by wealth status in Tanzania in 2013, 2 years after the last mass campaign in 2011, and extend the analysis to untreated nets (UTNs) to investigate how households adapt when nets are not continuously distributed.
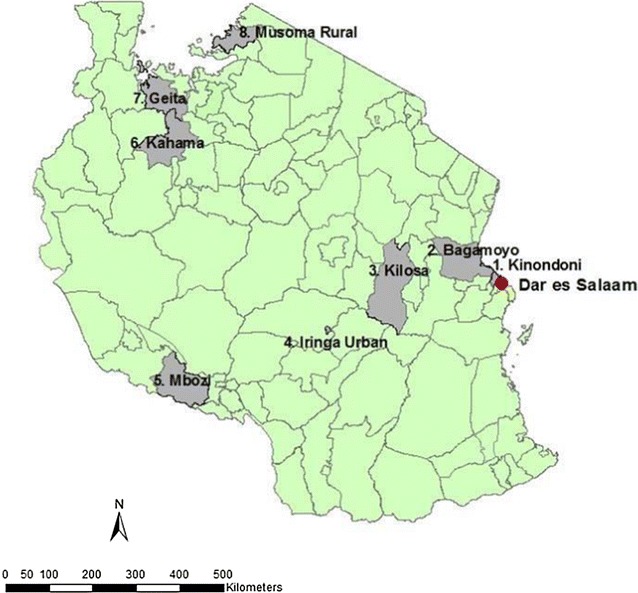
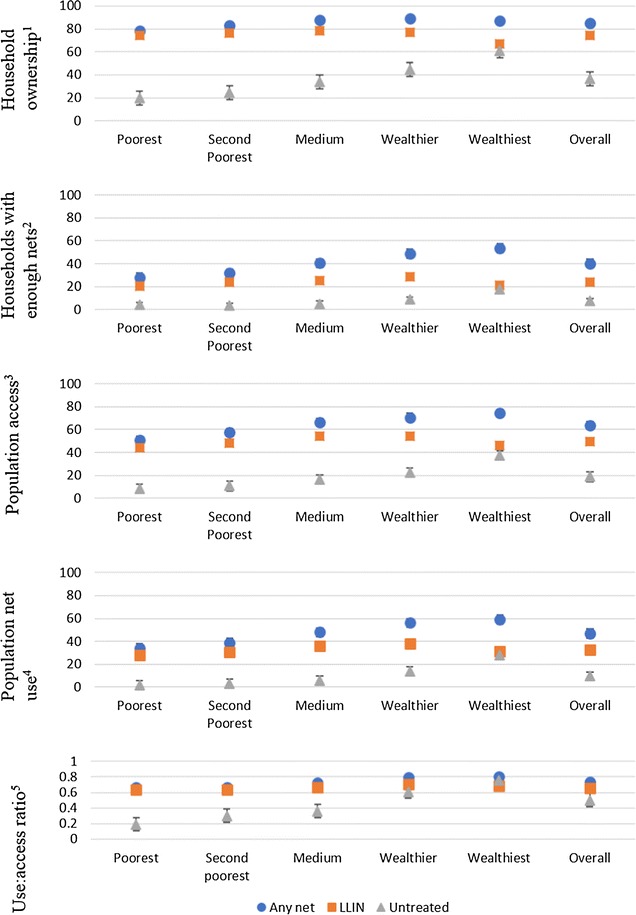
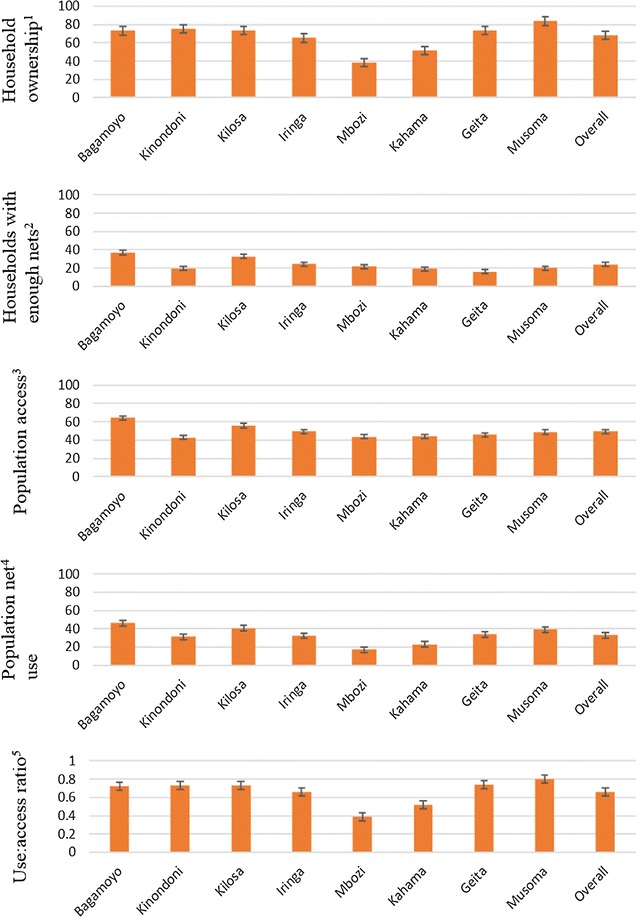
Methods: Between October-December 2013, a household survey was conducted in 3398 households in eight districts in Tanzania. Using the Roll Back Malaria indicators, the study analysed: (1) household net ownership; (2) access to nets; (3) population net use and (4) net use:access ratio. Outcomes were calculated for LLINs and UTNs. Results were analysed by socio-economic quintiles and by district.
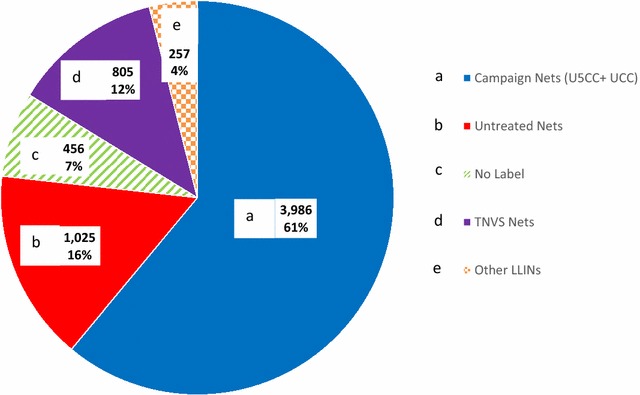
Results: Only three of the eight districts had household LLIN ownership of more than 80%. In 2013, less than a quarter of the households had one LLIN for every two people and only half of the population had access to an LLIN. Only the wealthier quintiles increased their net ownership and access to levels above 80% through the addition of UTNs. Overall net use of the population was low (LLINs: 32.8%; UTNs: 9.5%) and net use:access ratio was below target level (LLINs: 0.66; UTN: 0.50). Both measures varied significantly by district.
Conclusions: Two years after the last mass campaign, the percentage of households or population with access to LLINs was low. These findings indicate the average rate at which households in Tanzania lose their nets is higher than the rate at which they acquire new nets. The wealthiest households topped up their household net ownership with UTNs. Efforts to make LLINs available through commercial markets should be promoted, so those who can afford to buy nets purchase LLINs rather than UTNs. Net use was low around 40% and mostly explained by lack of access to nets. However, the use:access ratio was poor in Mbozi and Kahama districts warranting further investigations to understand other barriers to net use.
Keywords: Long-lasting insecticidal nets (LLINs); Net access; Net ownership; Net use; Tanzania; Universal coverage; Untreated nets.
Figures
References
-
- WHO . WHO recommendations for achieving universal coverage with long-lasting insecticidal nets in malaria control. Geneva: World Health Organization; 2014.
-
- Lyimo EO, Msuya FHM, Rwegoshora RT, Nicholson EA, Mnzava A, Lines JD, et al. Trial of pyrethroid impregnated bed-nets in an area of Tanzania holoendemic for malaria. Part 3. Effects of prevalence of malaria parasitemia and fever. Acta Trop. 1991;49:157–163. doi: 10.1016/0001-706X(91)90034-H. - DOI - PubMed
MeSH terms
Grants and funding
LinkOut - more resources
Full Text Sources
Other Literature Sources
Medical
Molecular Biology Databases
