. 2018 Mar 1;6(1):19.
doi: 10.1186/s40478-018-0524-2.

Integrated proteomics and network analysis identifies protein hubs and network alterations in Alzheimer's disease

Affiliations

Integrated proteomics and network analysis identifies protein hubs and network alterations in Alzheimer's disease

Qi Zhang et al. Acta Neuropathol Commun. .

Abstract

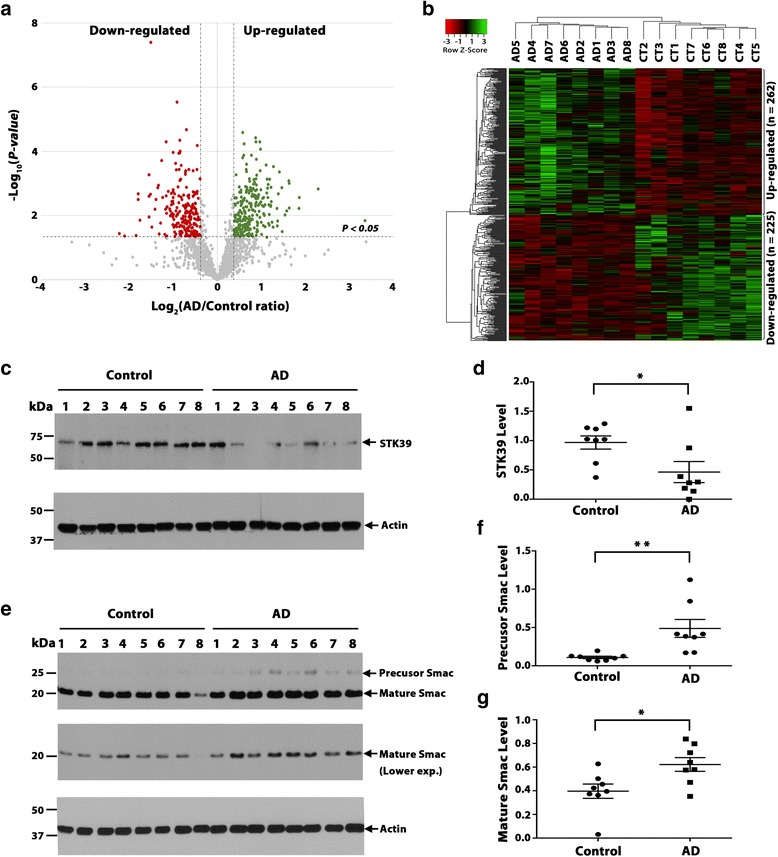
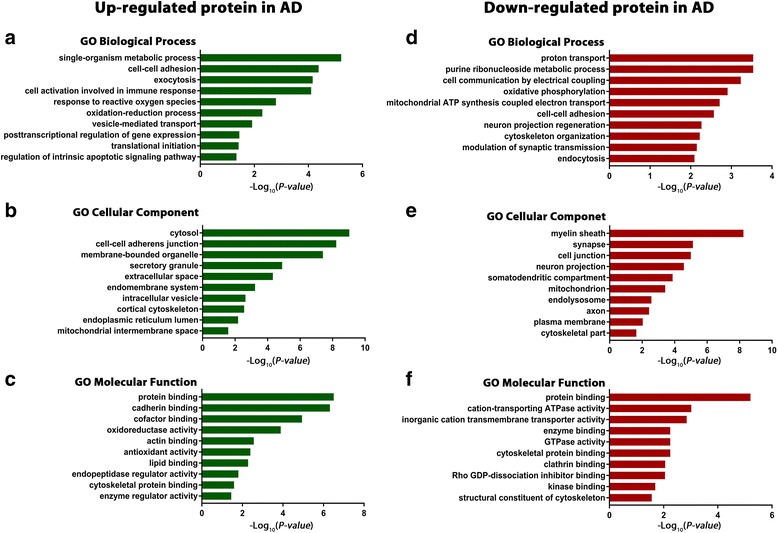
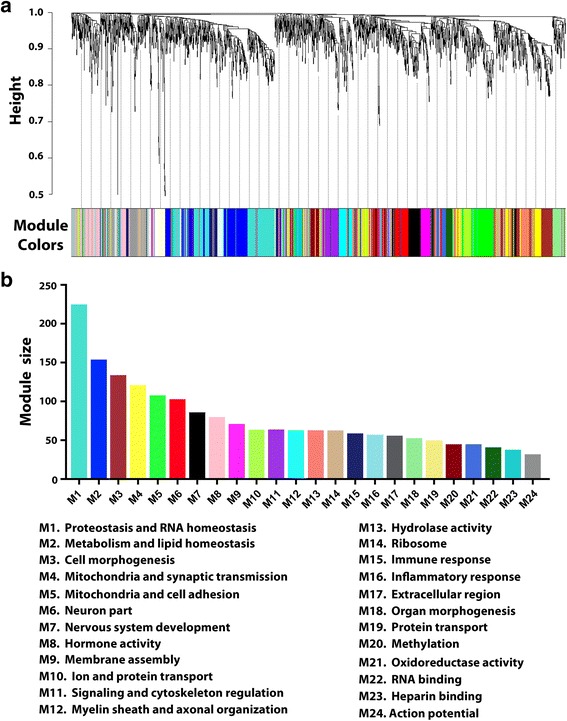
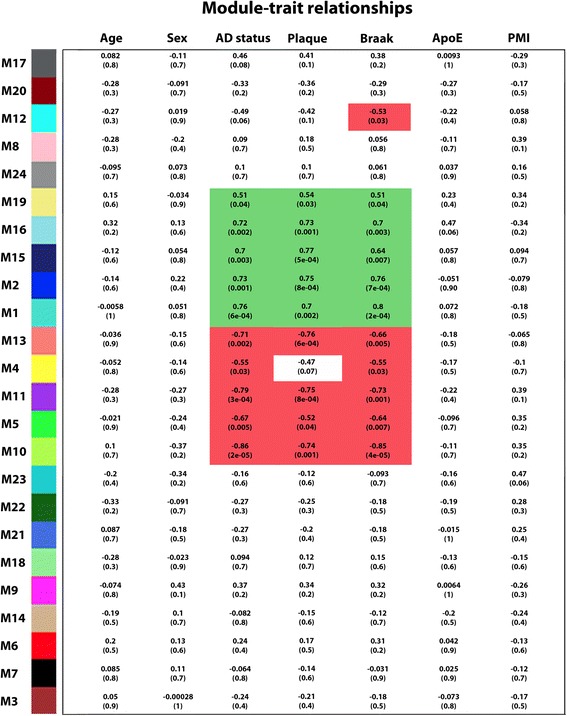
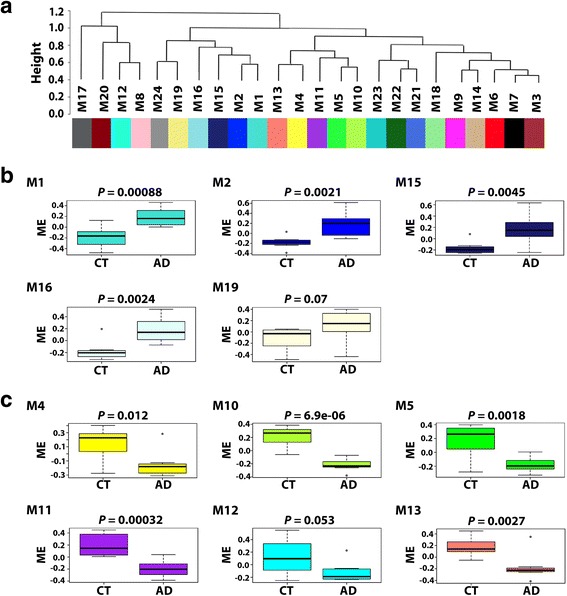
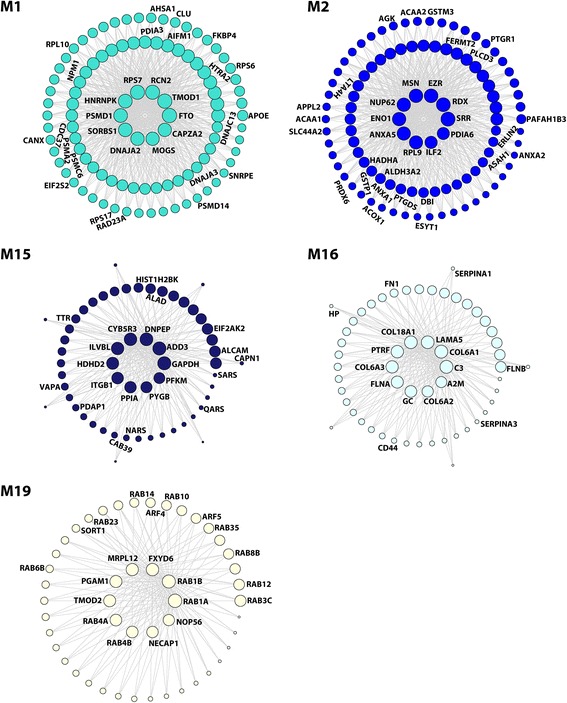
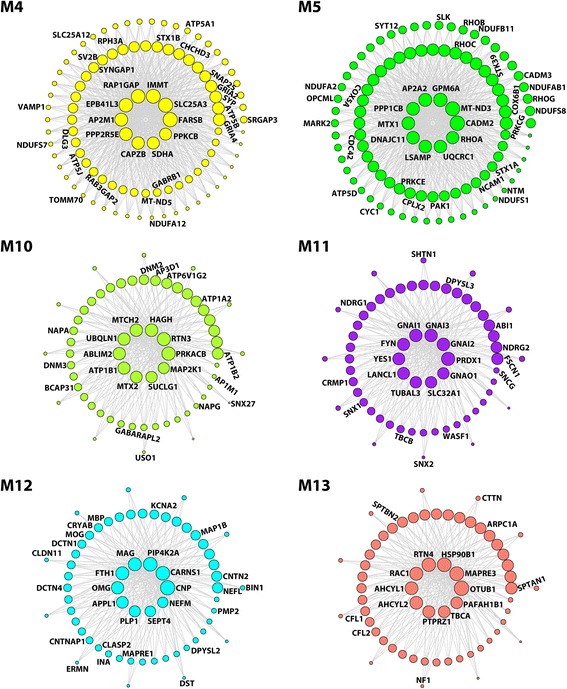
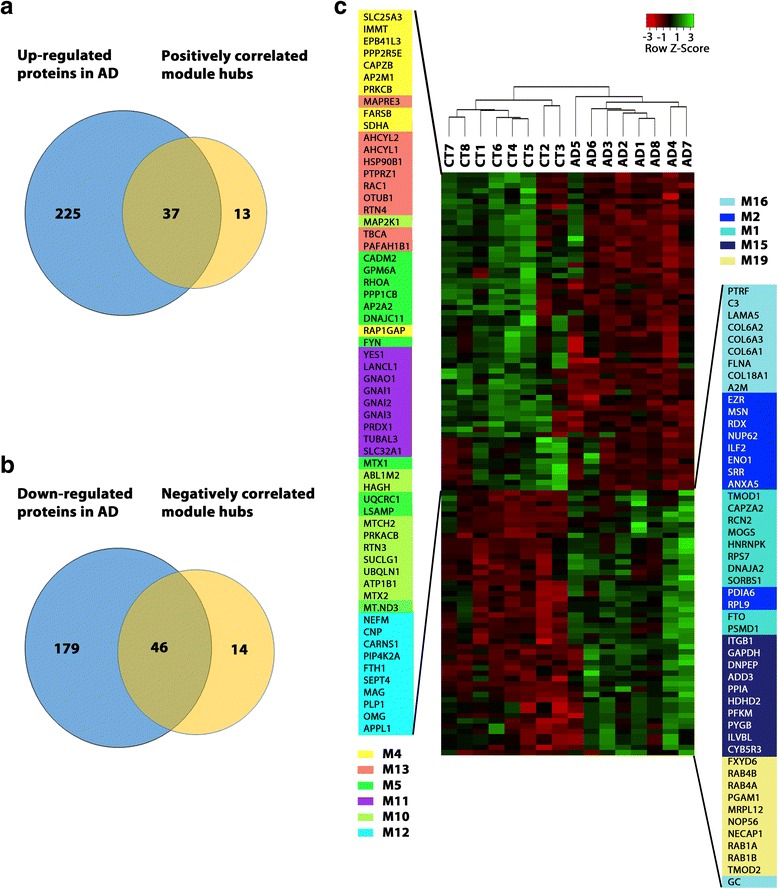
Although the genetic causes for several rare, familial forms of Alzheimer's disease (AD) have been identified, the etiology of the sporadic form of AD remains unclear. Here, we report a systems-level study of disease-associated proteome changes in human frontal cortex of sporadic AD patients using an integrated approach that combines mass spectrometry-based quantitative proteomics, differential expression analysis, and co-expression network analysis. Our analyses of 16 human brain tissues from AD patients and age-matched controls showed organization of the cortical proteome into a network of 24 biologically meaningful modules of co-expressed proteins. Of these, 5 modules are positively correlated to AD phenotypes with hub proteins that are up-regulated in AD, and 6 modules are negatively correlated to AD phenotypes with hub proteins that are down-regulated in AD. Our study generated a molecular blueprint of altered protein networks in AD brain and uncovered the dysregulation of multiple pathways and processes in AD brain, including altered proteostasis, RNA homeostasis, immune response, neuroinflammation, synaptic transmission, vesicular transport, cell signaling, cellular metabolism, lipid homeostasis, mitochondrial dynamics and function, cytoskeleton organization, and myelin-axon interactions. Our findings provide new insights into AD pathogenesis and suggest novel candidates for future diagnostic and therapeutic development.

Keywords: Alzheimer’s disease; Brain proteome; Differential expression analysis; Mass spectrometry; Network biology; Neurodegeneration; Protein co-expression network analysis; Quantitative proteomics.


Conflict of interest statement

Ethics approval and consent to participate

All research in this study was performed in accordance with the US National Institutions of Health guidelines for research involving human tissues and with the ethical standards and principles of the Declaration of Helsinki. All brain tissues were obtained from Emory Center for Neuro-degenerative Disease Brain Bank. Human postmortem brain tissues were acquired with Institutional Review Board (IRB) approval and informed consent from the subject or the family.

Consent for publication

Not applicable.

Competing interests

The authors declare that they have no competing interests.

Publisher’s Note

Springer Nature remains neutral with regard to jurisdictional claims in published maps and institutional affiliations.

Figures

Fig. 1
Fig. 1
AD-associated brain proteome changes revealed by label-free quantitative proteomics. a Volcano plot displaying the distribution of all proteins (n = 1968) with relative protein abundance (log2 AD/control ratio) plotted against its significance level (negative log10 P-value), showing significantly (P < 0.05) increased (AD/control ratio > 1.3; Green) and decreased (AD/control ratio < 0.77; Red) proteins in AD. b Heat map representation of 16 individual sample abundances for 487 significantly altered proteins after unsupervised hierarchical clustering, segregating samples into AD (left) and controls (CT; right) and proteins into up-regulated (top) and down-regulated (bottom) proteins in AD. c-g Western blot analysis (c, e) and quantification (d, f, g) confirm the decreased expression of STK39 (c, d) and increased expression of Smac proteins (e-f) in AD versus control. Data represent mean ± SEM (error bars; n = 8 biological repeats for AD or control group). *, P < 0.05; **, P < 0.01, unpaired two-tailed Student’s t test. Each experiment was repeated three times with similar results
Fig. 2
Fig. 2
Gene ontology enrichment analysis of differentially expressed proteins in AD brain. GO biological process, cellular component, and molecular function enrichment analyses of up-regulated (a-c) and down-regulated (d-f) proteins in AD were performed using MetaCore bioinformatics software. Significantly enriched GO terms are shown with Benjamini-Hochberg FDR-corrected P-values
Fig. 3
Fig. 3
Protein co-expression network analysis organizes the brain proteome into biologically meaningful modules. a WGCNA cluster dendrogram generated by unsupervised hierarchical clustering of all proteins in the entire proteomic data set on the basis of topological overlap followed by branch cutting reveals 24 network modules coded by different colors. b Protein co-expression modules were assigned M1 to M24 based on their module size. Representative functional categories enriched in these modules are indicated below the graph
Fig. 4
Fig. 4
Identification of disease-relevant protein modules associated with AD phenotypic traits. Module-trait relationships were determined by biweight midcorrelation between module eigenprotein expression and the indicated clinical or neuropathological feature. Correlation coefficients are indicated on the top with corresponding P-values in brackets below. Significant positive correlations (cor > 0.50, P < 0.05) are highlighted in Green, and significant negative correlations (cor < − 0.50, P < 0.05) are in Red. PMI, postmortem interval
Fig. 5
Fig. 5
Inter-modular relationships and module expression profiles of AD-related modules. a Module eigenprotein meta-network showing the inter-modular relationships of the identified 24 protein co-expression modules. b Box plots showing module eigenprotein (ME) values in AD and control (CT) cases for modules that are positively correlated with AD phenotypes. c Box plots showing ME values in AD and CT cases for modules that are negatively correlated with AD phenotypes. Box plots depict the mean (horizontal bars) and variance (25th to 75th percentiles), and significance (P-value) of differential ME expression in AD versus control was determined using unpaired two-tailed Student’s t test
Fig. 6
Fig. 6
Network depiction of protein co-expression modules that are positively correlated with AD pathology. Nodes represent proteins and edges (lines) indicate connections between the nodes, with a maximum of top 100 proteins and top 700 connections shown for each module. The size of the nodes corresponds to the intramodular connectivity as measured by kME. The top 10 highly connected hub proteins are shown in the center of each network plot. Proteins that are mentioned in the Results section are indicated. The complete list of proteins in each module and their kME values are provided in Additional file 5: Table S5
Fig. 7
Fig. 7
Network depiction of protein co-expression modules that are negatively correlated with AD pathology. Nodes represent proteins and edges represent connections, with a maximum of top 100 proteins and top 700 connections shown for each module. The size of the nodes corresponds to the intramodular connectivity as measured by kME. The top 10 highly connected hub proteins are shown in the middle of each network plot. Proteins that are mentioned in the Results section are indicated. The complete list of proteins in each module and their kME values are provided in Additional file 5: Table S5
Fig. 8
Fig. 8
Hub proteins of AD-related modules provide a molecular signature for differentiating AD and control cases. a Venn diagram showing the overlap between the identified up-regulated proteins in AD and top intramodular hub proteins of co-expression modules with positive correlation to AD phenotypes. b Venn diagram showing the overlap between the identified down-regulated proteins in AD and top intramodular hub proteins of co-expression modules with negative correlation to AD phenotypes. c Heat map representing the expression profiles of 110 highly connected intramodular hub proteins after unsupervised hierarchical clustering, showing clear separation of AD from control (CT) cases and positively correlated module hub proteins from negatively correlated module hub proteins

References

    1. Akram A, Schmeidler J, Katsel P, Hof PR, Haroutunian V (2012) Association of ApoE and LRP mRNA levels with dementia and AD neuropathology. Neurobiol Aging 33: 628 e621–628 e614. Doi 10.1016/j.neurobiolaging.2011.04.010 - PMC - PubMed
    1. Almaas E. Biological impacts and context of network theory. J Exp Biol. 2007;210:1548–1558. doi: 10.1242/jeb.003731. - DOI - PubMed
    1. Andreev VP, Petyuk VA, Brewer HM, Karpievitch YV, Xie F, Clarke J, Camp D, Smith RD, Lieberman AP, Albin RL, et al. Label-free quantitative LC-MS proteomics of Alzheimer's disease and normally aged human brains. J Proteome Res. 2012;11:3053–3067. doi: 10.1021/pr3001546. - DOI - PMC - PubMed
    1. Babicki S, Arndt D, Marcu A, Liang Y, Grant JR, Maciejewski A, Wishart DS. Heatmapper: web-enabled heat mapping for all. Nucleic Acids Res. 2016;44:W147–W153. doi: 10.1093/nar/gkw419. - DOI - PMC - PubMed
    1. Bamburg JR, Bernstein BW. Actin dynamics and cofilin-actin rods in alzheimer disease. Cytoskeleton (Hoboken) 2016;73:477–497. doi: 10.1002/cm.21282. - DOI - PMC - PubMed

Publication types