. 2018 Mar 13;115(11):2687-2692.
doi: 10.1073/pnas.1721627115. Epub 2018 Feb 28.

Strong control of Southern Ocean cloud reflectivity by ice-nucleating particles

Affiliations

Strong control of Southern Ocean cloud reflectivity by ice-nucleating particles

Jesús Vergara-Temprado et al. Proc Natl Acad Sci U S A. .

Abstract

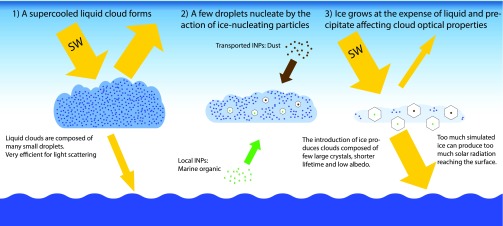
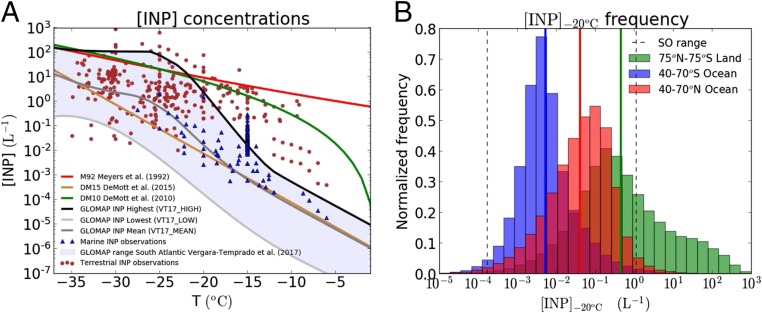
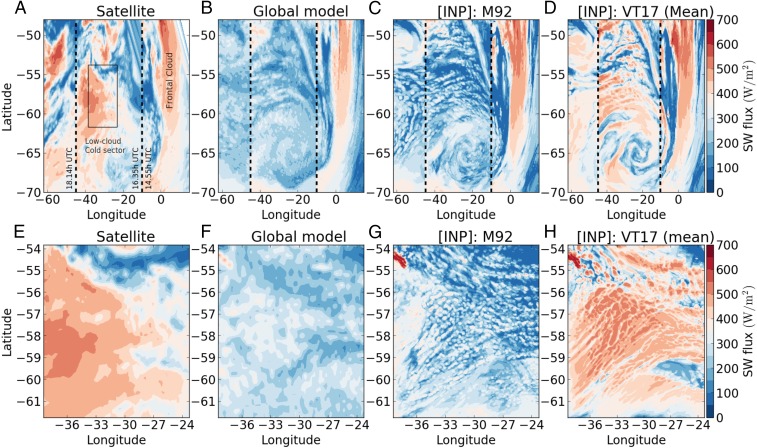
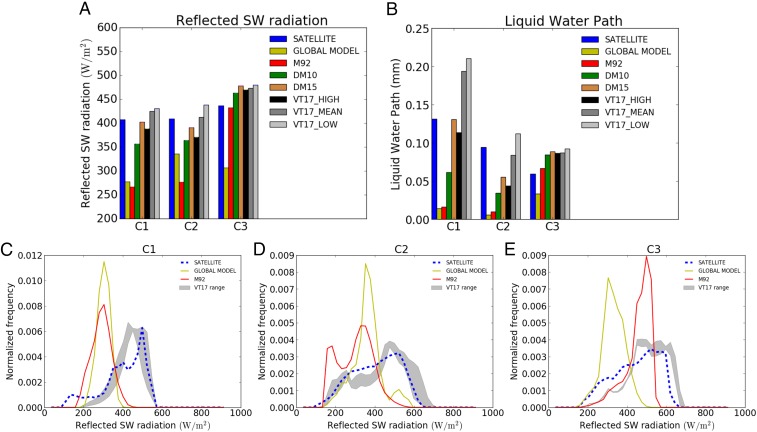
Large biases in climate model simulations of cloud radiative properties over the Southern Ocean cause large errors in modeled sea surface temperatures, atmospheric circulation, and climate sensitivity. Here, we combine cloud-resolving model simulations with estimates of the concentration of ice-nucleating particles in this region to show that our simulated Southern Ocean clouds reflect far more radiation than predicted by global models, in agreement with satellite observations. Specifically, we show that the clouds that are most sensitive to the concentration of ice-nucleating particles are low-level mixed-phase clouds in the cold sectors of extratropical cyclones, which have previously been identified as a main contributor to the Southern Ocean radiation bias. The very low ice-nucleating particle concentrations that prevail over the Southern Ocean strongly suppress cloud droplet freezing, reduce precipitation, and enhance cloud reflectivity. The results help explain why a strong radiation bias occurs mainly in this remote region away from major sources of ice-nucleating particles. The results present a substantial challenge to climate models to be able to simulate realistic ice-nucleating particle concentrations and their effects under specific meteorological conditions.

Keywords: Southern Ocean; clouds; ice nucleation; microphysics; mixed-phase.


Conflict of interest statement

The authors declare no conflict of interest.

Figures

Fig. 1.
Fig. 1.
Schematic representation of the effect of INPs on marine mixed-phase clouds. Variations on the concentrations of INP both transported and emitted locally can strongly modify the evolution of low-level clouds by affecting the number of ice nucleation events. Each cloud represents a different time in the evolution of the cloud system. The yellow arrows represent radiative fluxes, the green arrow represents INP sources from below cloud, and the brown arrow represents INP sources from the free troposphere.
Fig. 2.
Fig. 2.
INP concentrations. (A) Various parameterizations used in our simulations. The dataset used in the work by Vergara-Temprado et al. (24) is shown for comparison (marine and terrestrial INP) (Supporting Information). The points are divided between marine and terrestrial locations. (B) Frequency distribution of daily averaged INP concentrations at an activation temperature of −20 °C for mid- to high latitudes for ocean regions in the Northern Hemisphere and the Southern Hemisphere between 850 and 600 hPa. INP concentrations over land (whole globe from 75° N to 75° S at the same altitudes) are also shown for comparison. The solid vertical lines show the median values of the distributions. Note that the INP model is subject to low biases over continental regions (24), and therefore, the actual values over land are probably higher.
Fig. 3.
Fig. 3.
Top-of-atmosphere outgoing SW radiation for the observed and simulated clouds. Results show the first cloud system C1 with different representations of INP. AD show the 0.07° grid-spacing simulations of the whole cyclone collocated with the satellite observations (A). AD are divided by two black dashed lines into three areas, each corresponding to a different satellite retrieval. A box is drawn in the satellite image in A to show the position of the 2.2-km resolution domains (EH). A and E correspond to the satellite data (CERES). B and F show the output of the global model, and C, D, G, and H are for the high-resolution runs using the M92 INP scheme and the mean INP values simulated from VT17. Fig. S6 shows all of the cases studied.
Fig. 4.
Fig. 4.
Top-of-atmosphere outgoing SW radiation and cloud liquid water path for all studied cloud systems. A and B show the domain mean value of reflected SW radiation (A) and liquid water path (LWP) (B). CE show the distributions of low cloud- and midcloud-reflected SW radiation fluxes for the three clouds studied (C1–C3) for the simulations with the global model and the high-resolution simulations with M92 and the VT17 range of INP values. (More detailed versions of these plots are in Fig. S1.) Model grid boxes with a cloud-top temperature less than −35 °C and columns with an LWP less than 0.001 mm were removed from the calculations to exclude the effect of high clouds and cloud-free areas.
Fig. 5.
Fig. 5.
Relationship between cloud properties and INP concentrations. (A) Median-modeled in cloud-activated INP vs. liquid water path and (B) INP vs. reflected SW flux. The solid line error bars on the INP axis correspond to the 66% confidence intervals of the distribution of in cloud-activated INPs, and the dashed line error bars correspond to the 95% intervals. The colors of the points correspond to the different INP parameterizations, and they follow Fig. 3. A linear fit to the data points corresponding to each cloud is also shown with its corresponding coefficient of determination (R2). The linear regime ends for concentrations higher than about 1 L−1, and therefore, runs with higher values were not included in the linear fit.

References

    1. Trenberth KE, Fasullo JT. Simulation of present-day and twenty-first-century energy budgets of the Southern Oceans. J Clim. 2010;23:440–454.
    1. Bodas-Salcedo A, et al. Origins of the solar radiation biases over the Southern Ocean in CFMIP2 models. J Clim. 2014;27:41–56.
    1. Wang C, Zhang L, Lee S-K, Wu L, Mechoso CR. A global perspective on CMIP5 climate model biases. Nat Clim Chang. 2014;4:201–205.
    1. Ceppi P, Hwang YT, Frierson DMW, Hartmann DL. Southern Hemisphere jet latitude biases in CMIP5 models linked to shortwave cloud forcing. Geophys Res Lett. 2012;39:1–5.
    1. Hwang Y-T, Frierson DMW. Link between the double-Intertropical Convergence Zone problem and cloud biases over the Southern Ocean. Proc Natl Acad Sci USA. 2013;110:4935–4940. - PMC - PubMed

Publication types