. 2018 Jul 17;138(3):266-282.
doi: 10.1161/CIRCULATIONAHA.117.030856. Epub 2018 Feb 28.

Vascular Smooth Muscle-Specific Progerin Expression Accelerates Atherosclerosis and Death in a Mouse Model of Hutchinson-Gilford Progeria Syndrome

Affiliations

Vascular Smooth Muscle-Specific Progerin Expression Accelerates Atherosclerosis and Death in a Mouse Model of Hutchinson-Gilford Progeria Syndrome

Magda R Hamczyk et al. Circulation. .

Abstract

Background: Progerin, an aberrant protein that accumulates with age, causes the rare genetic disease Hutchinson-Gilford progeria syndrome (HGPS). Patients who have HGPS exhibit ubiquitous progerin expression, accelerated aging and atherosclerosis, and die in their early teens, mainly of myocardial infarction or stroke. The mechanisms underlying progerin-induced atherosclerosis remain unexplored, in part, because of the lack of appropriate animal models.

Methods: We generated an atherosclerosis-prone model of HGPS by crossing apolipoprotein E-deficient (Apoe-/-) mice with LmnaG609G/G609G mice ubiquitously expressing progerin. To induce progerin expression specifically in macrophages or vascular smooth muscle cells (VSMCs), we crossed Apoe-/-LmnaLCS/LCS mice with LysMCre and SM22αCre mice, respectively. Progerin expression was evaluated by polymerase chain reaction and immunofluorescence. Cardiovascular alterations were determined by immunofluorescence and histology in male mice fed normal chow or a high-fat diet. In vivo low-density lipoprotein retention was assessed by intravenous injection of fluorescently labeled human low-density lipoprotein. Cardiac electric defects were evaluated by electrocardiography.

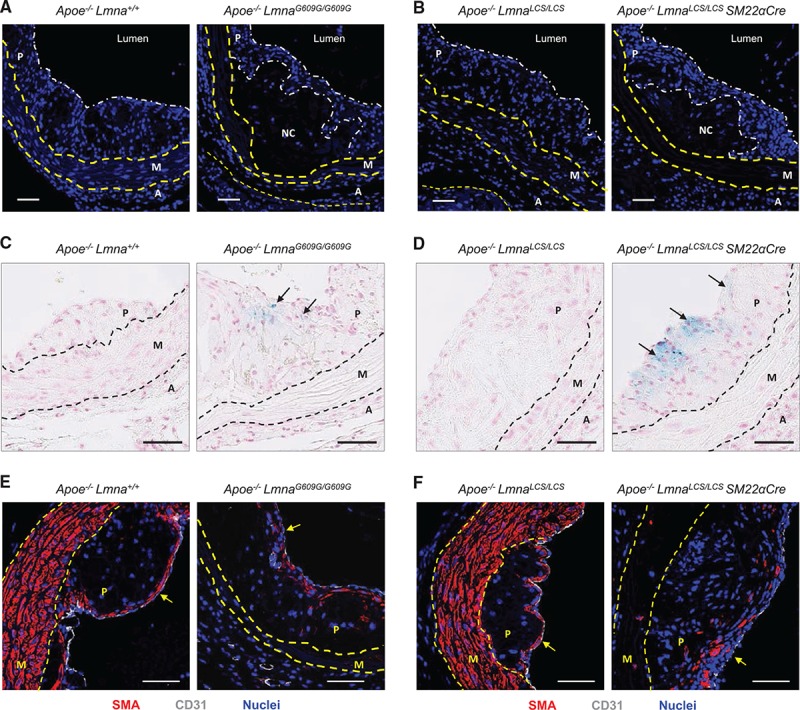
Results: Apoe-/-LmnaG609G/G609G mice with ubiquitous progerin expression exhibited a premature aging phenotype that included failure to thrive and shortened survival. In addition, high-fat diet-fed Apoe-/-LmnaG609G/G609G mice developed a severe vascular pathology, including medial VSMC loss and lipid retention, adventitial fibrosis, and accelerated atherosclerosis, thus resembling most aspects of cardiovascular disease observed in patients with HGPS. The same vascular alterations were also observed in Apoe-/-LmnaLCS/LCSSM22αCre mice expressing progerin specifically in VSMCs, but not in Apoe-/-LmnaLCS/LCSLysMCre mice with macrophage-specific progerin expression. Moreover, Apoe-/-LmnaLCS/LCSSM22αCre mice had a shortened lifespan despite the lack of any overt aging phenotype. Aortas of ubiquitously and VSMC-specific progerin-expressing mice exhibited increased retention of fluorescently labeled human low-density lipoprotein, and atheromata in both models showed vulnerable plaque features. Immunohistopathological examination indicated that Apoe-/-LmnaLCS/LCSSM22αCre mice, unlike Apoe-/-LmnaG609G/G609G mice, die of atherosclerosis-related causes.

Conclusions: We have generated the first mouse model of progerin-induced atherosclerosis acceleration, and demonstrate that restricting progerin expression to VSMCs is sufficient to accelerate atherosclerosis, trigger plaque vulnerability, and reduce lifespan. Our results identify progerin-induced VSMC death as a major factor triggering atherosclerosis and premature death in HGPS.

Keywords: aging; atherosclerosis; cardiovascular diseases; models, animal; muscle, smooth, vascular; progeria.


Figures

Figure 1.
Figure 1.
Ubiquitous progerin expression in Apoe–/–LmnaG609G/G609G mice impairs postnatal growth, reduces lifespan, and accelerates atherosclerosis. A, Postnatal body weight curves for Apoe–/–Lmna+/+ mice (n=7) and Apoe–/–LmnaG609G/G609G mice (n=14). B, Kaplan-Meier survival curves. Median survival: 18.15 weeks for Apoe–/–LmnaG609G/G609G mice (n=14) and 117.6 weeks for Apoe–/–Lmna+/+ mice (n=7). C, Representative photograph of 16-week-old males. Scale bar: 1 cm. D, Pre–high-fat diet (HFD) serum levels of total cholesterol, free cholesterol, low-density lipoprotein (LDL), and high-density lipoprotein (HDL) in 8-week-old Apoe–/–LmnaG609G/G609G mice (n=5) and Apoe–/–Lmna+/+ mice (n=7). E, Post-HFD serum levels of total cholesterol, free cholesterol, LDL, and HDL in 16-week-old Apoe–/–LmnaG609G/G609G mice (n=6) and Apoe–/–Lmna+/+ mice (n=8). F, Representative aortic arches (Top) and thoracic aortas (Middle and Bottom) stained with Oil Red O; graphs show quantification of atherosclerosis burden in Apoe–/–LmnaG609G/G609G mice (n=9 aortic arches; n=12 thoracic aortas) and Apoe–/–Lmna+/+ mice (n=6 aortic arches; n=13 thoracic aortas). Scale bar: 2 mm. Studies in A, B, and C were performed with mice fed normal chow, and those in D, E, and F were conducted with mice fed the HFD for 2 months starting at 8 weeks of age. Data are shown as mean±SEM in A, D, and E, and as median with interquartile range and minima and maxima in F. Statistical differences were analyzed by log-rank test in B, by 2-tailed t test in A, D, and E, and by 2-tailed Mann-Whitney test in F. *P<0.05. **P<0.01. ***P<0.001.
Figure 2.
Figure 2.
Apoe–/–LmnaG609G/G609G mice with ubiquitous progerin expression exhibit severe vascular pathology, including lipid retention and vascular smooth muscle cell (VSMC) loss in the media, and adventitial thickening. Mice were fed a high-fat diet for 8 weeks starting at 8 weeks of age. A, Representative staining of aorta sections with Oil Red O (ORO) and hematoxylin and eosin (H&E). Graphs show quantification of lipid content in atheroma-free zones of the media (as % of the ORO-positive area) and adventitia-to-media thickness ratio; n=6 to 8. Scale bar: 50 µm. B, Representative immunofluorescence images of aortas stained with anti–smooth muscle actin (SMA) antibody (red) and Hoechst 33342 (blue). Graphs show quantification of VSMC content in the media as either nucleus count or % of SMA-positive area; n=5 to 8. Scale bar: 50 µm. Box and whisker plots in A show medians, interquartile range, and minima and maxima; data in B are mean±SEM. Statistical analysis was performed by 2-tailed Mann-Whitney test in A, and 2-tailed t test in B. ***P<0.001. a indicates adventitia; and m, media.
Figure 3.
Figure 3.
Vascular smooth muscle cell (VSMC)–specific progerin expression in Apoe–/–LmnaLCS/LCSSM22αCre mice reduces lifespan and accelerates atherosclerosis. A, Postnatal body weight curves for Apoe–/–LmnaLCS/LCS mice (n=9), Apoe–/–LmnaLCS/LCSSM22αCre mice (n=12), and Apoe–/–LmnaLCS/LCSLysMCre mice (n=6). The weight curve for Apoe–/–LmnaLCS/LCSSM22αCre mice is shown up to the time when ≈90% of the animals were dead. B, Kaplan-Meier survival curves. Median survival: 34.3 weeks for Apoe–/–LmnaLCS/LCSSM22αCre mice (n=17), 106.3 weeks for Apoe–/–LmnaLCS/LCS mice (n=9), and 116.3 weeks for Apoe–/–LmnaLCS/LCSLysMCre mice (n=6). C, Representative photograph of 16-week-old males. Scale bar: 1 cm. D, Pre–high-fat diet (HFD) serum levels of total cholesterol, free cholesterol, low-density lipoprotein (LDL), and high-density lipoprotein (HDL) in 8-week-old Apoe–/–LmnaLCS/LCS mice (n=5), Apoe–/–LmnaLCS/LCSSM22αCre mice (n=4), and Apoe–/–LmnaLCS/LCSLysMCre mice (n=6). E, Post-HFD serum levels of total cholesterol, free cholesterol, LDL, and HDL in 16-week-old Apoe–/–LmnaLCS/LCS mice (n=10), Apoe–/–LmnaLCS/LCSSM22αCre mice (n=7), and Apoe–/–LmnaLCS/LCSLysMCre mice (n=7). F, Representative examples of thoracic aortas stained with Oil Red O (ORO). The graph shows quantification of atherosclerosis burden in Apoe–/–LmnaLCS/LCS mice (n=24), Apoe–/–LmnaLCS/LCSSM22αCre mice (n=17), and Apoe–/–LmnaLCS/LCSLysMCre mice (n=19). Scale bar: 2 mm. Studies in A, B, and C were performed with mice fed normal chow, and those in D, E, and F were conducted with mice fed the HFD for 2 months starting at 8 weeks of age. Data in A, D, and E are mean±SEM. Box and whisker plots in F show medians, interquartile range, and minima and maxima. Statistical analysis was performed by log-rank test in B, by 1-way ANOVA with the Tukey post hoc test in A, D and E, and by the Kruskal-Wallis test with the Dunn post hoc test in F. ***P<0.001.
Figure 4.
Figure 4.
Apoe–/–LmnaLCS/LCSSM22αCre mice with vascular smooth muscle cell (VSMC)–specific progerin expression show severe vascular pathology, including VSMC loss and lipid retention in the media and adventitial thickening. Mice were fed a high-fat diet for 8 weeks starting at 8 weeks of age. A, Representative staining of aorta sections with Oil Red O (ORO) and hematoxylin and eosin (H&E). Graphs show quantification of lipid content in atheroma-free zones of the media (% of ORO-positive area) and adventitia-to-media thickness ratio; n=6 to 8. Scale bar: 50 µm. B, Representative immunofluorescence images of aortas stained with anti–smooth muscle actin (SMA) antibody (red) and Hoechst 33342 (blue). Graphs show quantification of VSMC content in the media as either nucleus count or % of SMA-positive area; n=6 to 8. Scale bar: 50 µm. Box and whisker plots in A show medians, interquartile range, and minima and maxima; data in B are mean±SEM. Statistical analysis was performed by the Kruskal-Wallis test with the Dunn post hoc test in A and by 1-way ANOVA with the Tukey post hoc test in B. *P<0.05. **P<0.01. ***P<0.001. a indicates adventitia; and m, media.
Figure 5.
Figure 5.
Increased LDL retention in the aortas of Apoe–/–LmnaG609G/G609G and Apoe–/–LmnaLCS/LCSSM22αCre mice. A, Experimental workflow. LDL was isolated from human peripheral blood and labeled with the fluorochrome Atto565. Atto565-LDL was administrated intravenously to 16-week-old mice fed normal chow. At 20 hours postinjection, aortas were extracted and confocal microscope images were acquired of the whole-mount tissue. B and C, Representative tile scan images of aortas from mice of the indicated genotypes; graphs show quantification of Atto565-LDL retention (red florescence as a % of the total area) in the aortic arch and thoracic aorta; n=8 mice in B and n=6 in C. Scale bar: 1 mm. D and E, Still frame images of 3-dimensional reconstruction videos, showing elastin layers (green autofluorescence) and Atto565-LDL retention (red fluorescence) in the aortas of mice of the indicated genotypes. Atto565-LDL retention in the medial layer was principally detected in aortas from Apoe–/–LmnaG609G/G609G and Apoe–/–LmnaLCS/LCSSM22αCre mice (see Movies I through XII in the online-only Data Supplement). Scale bar: 50 µm (Top), 30 µm (Bottom). Data from control mice (not injected with Atto565-LDL) are shown in Figure IX in the online-only Data Supplement and Movies XIII through XVI in the online-only Data Supplement. Data in B and C are presented as mean±SEM. Statistical analysis was performed by 2-tailed t test. *P<0.05. **P<0.01. ***P<0.001.
Figure 6.
Figure 6.
Enhanced aortic root atherosclerosis in Apoe–/–LmnaG609G/G609G and Apoe–/–LmnaLCS/LCSSM22αCre mice is accompanied by inflammation of adjacent cardiac tissue and plaque destabilization. Mice were fed a high-fat diet for 8 weeks starting at 8 weeks of age. Serial sections of the aortic root were made and 3 different regions were stained with Masson trichrome. A and B, Representative photographs of atheromata in the aortic root of Apoe–/–LmnaG609G/G609G mice (A) and Apoe–/–LmnaLCS/LCSSM22αCre mice (B), and their corresponding controls. Graphs show quantification of plaque area, with each point representing the mean for 3 aortic root regions; n=5. Scale bar: 200 µm. Dashed lines indicate medial perimeter (the last layer of elastin) and dotted lines indicate the luminal surface of the atheroma plaque. C, An example of intraplaque (Top) and intravalve (Bottom) hemorrhage in Apoe–/–LmnaG609G/G6090G mice. Scale bar: 100 µm. D, An example of intraplaque hemorrhage (Top) and thrombus formation (Bottom) in Apoe–/–LmnaLCS/LCSSM22αCre mice. Scale bar: 100 µm. Data are shown as mean±SEM. Statistical analysis was performed by 2-tailed t test. **P<0.01. ***P<0.001.
Figure 7.
Figure 7.
Vulnerable plaque features in Apoe–/–LmnaG609G/G609G and Apoe–/–LmnaLCS/LCSSM22αCre mice. Mice were fed a high-fat diet for 8 weeks starting at 8 weeks of age, and aortas were extracted for histology and immunofluorescence. Representative images are shown. A and B, Hoechst 33342 staining to visualize nuclei (blue). Scale bar: 50 µm. C and D, Perls Prussian blue staining in atherosclerotic plaques to visualize cells with iron deposits (blue; arrows). Scale bar: 50 µm. E and F, Smooth muscle actin (SMA, visualized in red), endothelium (CD31, visualized in white), and nuclei (Hoechst 33342, visualized in blue). Arrows mark the luminal part of the plaque (fibrous cap). Scale bar: 50 µm. A indicates adventitia; M, media; NC, necrotic core; and P, plaque.
Figure 8.
Figure 8.
More severe cardiovascular phenotype in Apoe–/–LmnaLCS/LCSSM22αCre mice than in Apoe–/–LmnaG609G/G609G at ages close to their maximum survival. Mice were fed normal chow and euthanized at either 21 to 23 weeks of age (Apoe–/–LmnaG609G/G609G and control Apoe–/–Lmna+/+ mice) or 51 weeks of age (Apoe–/–LmnaLCS/LCSSM22αCre and control Apoe–/–LmnaLCS/LCS mice). A, Representative Oil Red O (ORO) staining in aortas from Apoe–/–LmnaG609G/G609G and Apoe–/–Lmna+/+ mice. Graphs show quantification of atherosclerosis burden in the aortic arch and thoracic aorta; n=6. Scale bar: 2 mm. B, Representative ORO staining in aortas from Apoe–/–LmnaLCS/LCSSM22αCre and Apoe–/–LmnaLCS/LCS mice. Graphs show quantification of atherosclerosis burden in the aortic arch and thoracic aorta; n=5 to 6. Scale bar: 2 mm. C, Higher magnification of ORO-stained thoracic aortas of the indicated genotypes. Scale bar: 1 mm. D, Table summarizing cardiac pathologies assessed in 9 to 11 mice per genotype. Serial heart sections (at least at 6 different levels of the ventricles) were stained with Masson trichrome and analyzed. E, Representative heart sections from Apoe–/–LmnaG609G/G609G and Apoe–/–LmnaLCS/LCSSM22αCre mice. Blue staining indicates fibrosis. Scale bar: 1 mm (whole cross section) and 200 µm (magnified view in insert). Data in A and B are shown as median with interquartile range and minima and maxima. Statistical differences were analyzed by 2-tailed Mann-Whitney test. *P<0.05. **P<0.01. LV indicates left ventricle; RV, right ventricle; and S, septum.

Comment in

References

    1. Lakatta EG, Levy D. Arterial and cardiac aging: major shareholders in cardiovascular disease enterprises. Part I: aging arteries: a “set up” for vascular disease. Circulation. 2003;107:139–146. - PubMed
    1. Lim SS, Vos T, Flaxman AD, Danaei G, Shibuya K, Adair-Rohani H, Amann M, Anderson HR, Andrews KG, Aryee M, Atkinson C, Bacchus LJ, Bahalim AN, Balakrishnan K, Balmes J, Barker-Collo S, Baxter A, Bell ML, Blore JD, Blyth F, Bonner C, Borges G, Bourne R, Boussinesq M, Brauer M, Brooks P, Bruce NG, Brunekreef B, Bryan-Hancock C, Bucello C, Buchbinder R, Bull F, Burnett RT, Byers TE, Calabria B, Carapetis J, Carnahan E, Chafe Z, Charlson F, Chen H, Chen JS, Cheng AT, Child JC, Cohen A, Colson KE, Cowie BC, Darby S, Darling S, Davis A, Degenhardt L, Dentener F, Des Jarlais DC, Devries K, Dherani M, Ding EL, Dorsey ER, Driscoll T, Edmond K, Ali SE, Engell RE, Erwin PJ, Fahimi S, Falder G, Farzadfar F, Ferrari A, Finucane MM, Flaxman S, Fowkes FG, Freedman G, Freeman MK, Gakidou E, Ghosh S, Giovannucci E, Gmel G, Graham K, Grainger R, Grant B, Gunnell D, Gutierrez HR, Hall W, Hoek HW, Hogan A, Hosgood HD, 3rd, Hoy D, Hu H, Hubbell BJ, Hutchings SJ, Ibeanusi SE, Jacklyn GL, Jasrasaria R, Jonas JB, Kan H, Kanis JA, Kassebaum N, Kawakami N, Khang YH, Khatibzadeh S, Khoo JP, Kok C, Laden F, Lalloo R, Lan Q, Lathlean T, Leasher JL, Leigh J, Li Y, Lin JK, Lipshultz SE, London S, Lozano R, Lu Y, Mak J, Malekzadeh R, Mallinger L, Marcenes W, March L, Marks R, Martin R, McGale P, McGrath J, Mehta S, Mensah GA, Merriman TR, Micha R, Michaud C, Mishra V, Mohd Hanafiah K, Mokdad AA, Morawska L, Mozaffarian D, Murphy T, Naghavi M, Neal B, Nelson PK, Nolla JM, Norman R, Olives C, Omer SB, Orchard J, Osborne R, Ostro B, Page A, Pandey KD, Parry CD, Passmore E, Patra J, Pearce N, Pelizzari PM, Petzold M, Phillips MR, Pope D, Pope CA, 3rd, Powles J, Rao M, Razavi H, Rehfuess EA, Rehm JT, Ritz B, Rivara FP, Roberts T, Robinson C, Rodriguez-Portales JA, Romieu I, Room R, Rosenfeld LC, Roy A, Rushton L, Salomon JA, Sampson U, Sanchez-Riera L, Sanman E, Sapkota A, Seedat S, Shi P, Shield K, Shivakoti R, Singh GM, Sleet DA, Smith E, Smith KR, Stapelberg NJ, Steenland K, Stöckl H, Stovner LJ, Straif K, Straney L, Thurston GD, Tran JH, Van Dingenen R, van Donkelaar A, Veerman JL, Vijayakumar L, Weintraub R, Weissman MM, White RA, Whiteford H, Wiersma ST, Wilkinson JD, Williams HC, Williams W, Wilson N, Woolf AD, Yip P, Zielinski JM, Lopez AD, Murray CJ, Ezzati M, AlMazroa MA, Memish ZA. A comparative risk assessment of burden of disease and injury attributable to 67 risk factors and risk factor clusters in 21 regions, 1990-2010: a systematic analysis for the Global Burden of Disease Study 2010. Lancet. 2012;380:2224–2260. doi: 10.1016/S0140-6736(12)61766-8. - PMC - PubMed
    1. De Sandre-Giovannoli A, Bernard R, Cau P, Navarro C, Amiel J, Boccaccio I, Lyonnet S, Stewart CL, Munnich A, Le Merrer M, Lévy N. Lamin a truncation in Hutchinson-Gilford progeria. Science. 2003;300:2055. doi: 10.1126/science.1084125. - PubMed
    1. Eriksson M, Brown WT, Gordon LB, Glynn MW, Singer J, Scott L, Erdos MR, Robbins CM, Moses TY, Berglund P, Dutra A, Pak E, Durkin S, Csoka AB, Boehnke M, Glover TW, Collins FS. Recurrent de novo point mutations in lamin A cause Hutchinson-Gilford progeria syndrome. Nature. 2003;423:293–298. doi: 10.1038/nature01629. - PMC - PubMed
    1. Hennekam RC. Hutchinson-Gilford progeria syndrome: review of the phenotype. Am J Med Genet A. 2006;140:2603–2624. doi: 10.1002/ajmg.a.31346. - PubMed

Publication types