. 2018 Apr 27;293(17):6410-6433.
doi: 10.1074/jbc.M117.813741. Epub 2018 Feb 28.

Aspartyl proteases in Candida glabrata are required for suppression of the host innate immune response

Affiliations

Aspartyl proteases in Candida glabrata are required for suppression of the host innate immune response

Mubashshir Rasheed et al. J Biol Chem. .

Abstract

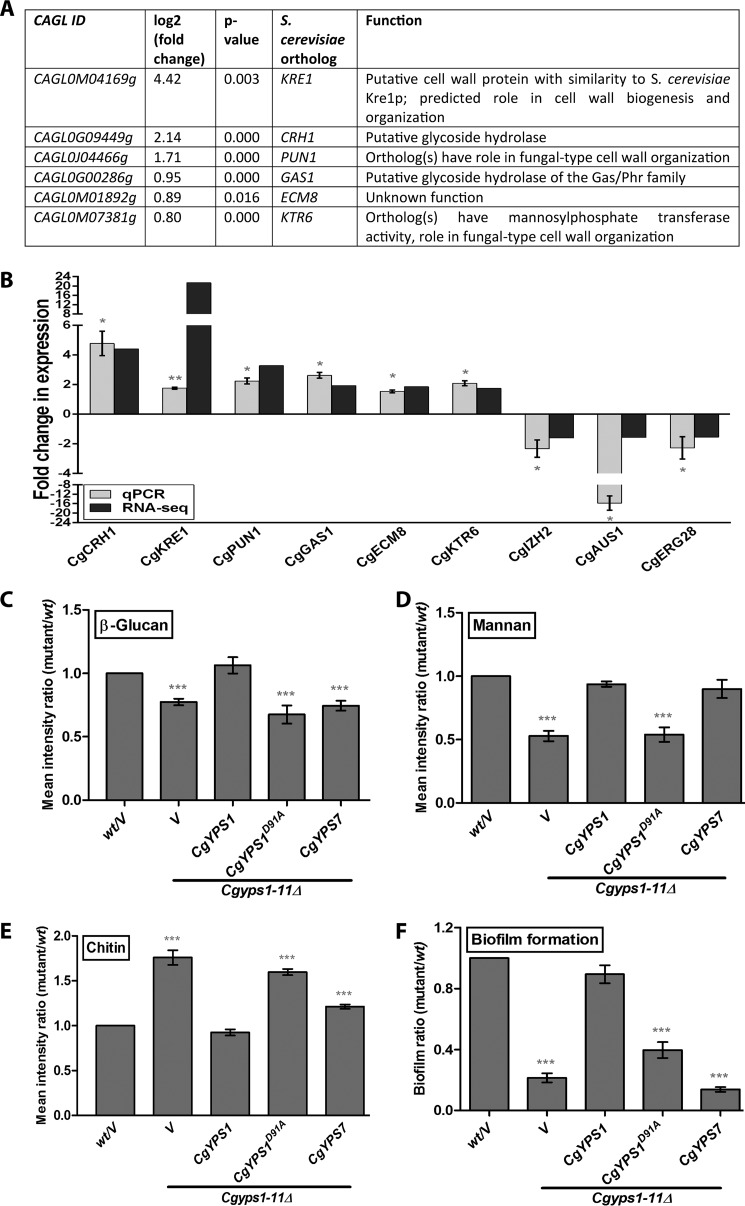
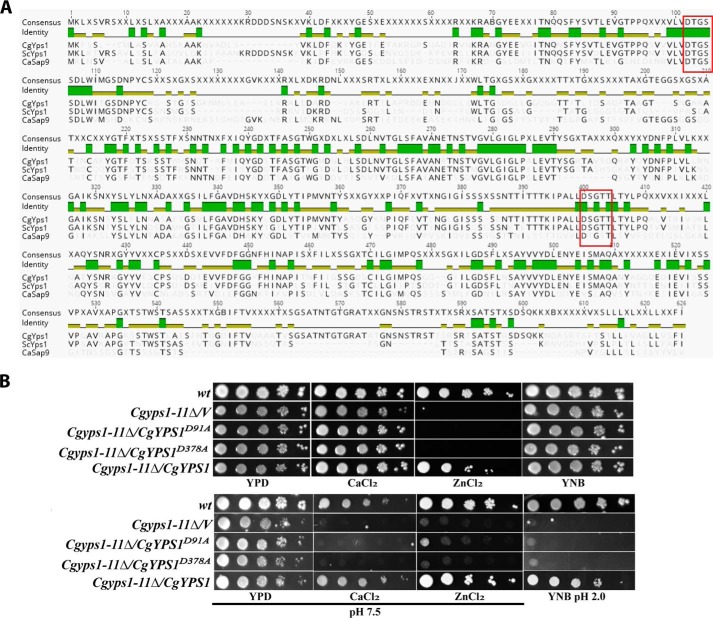
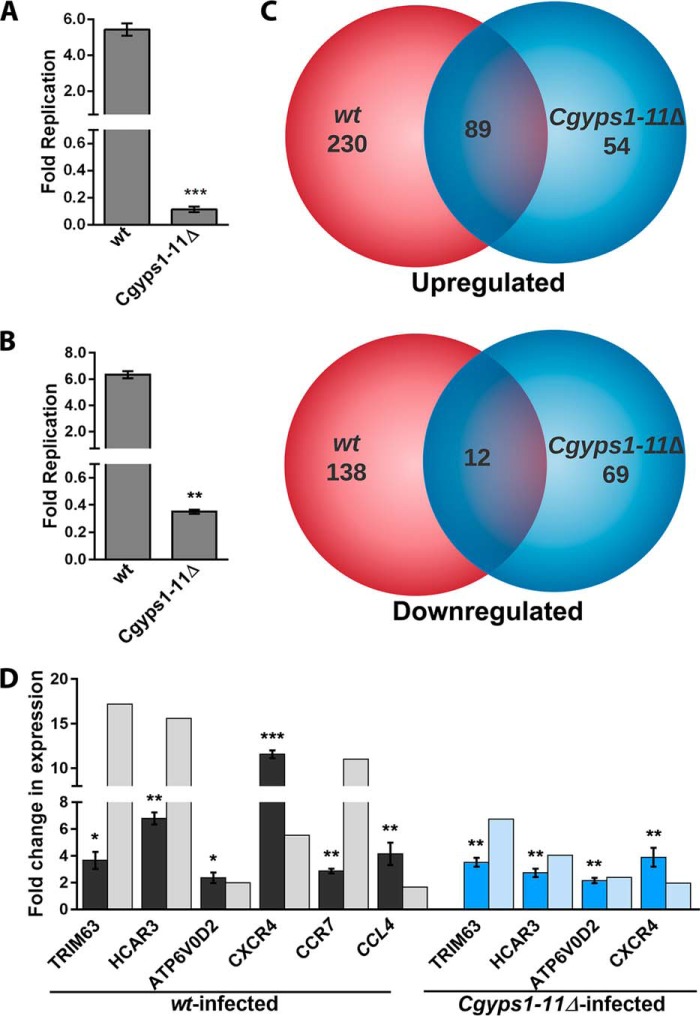
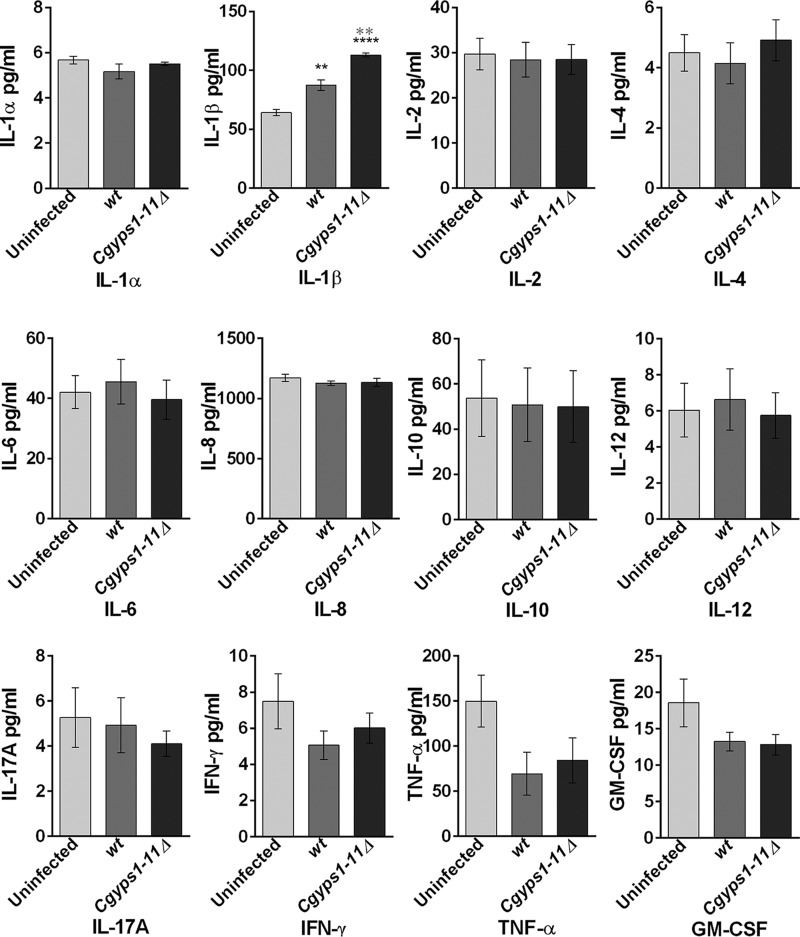
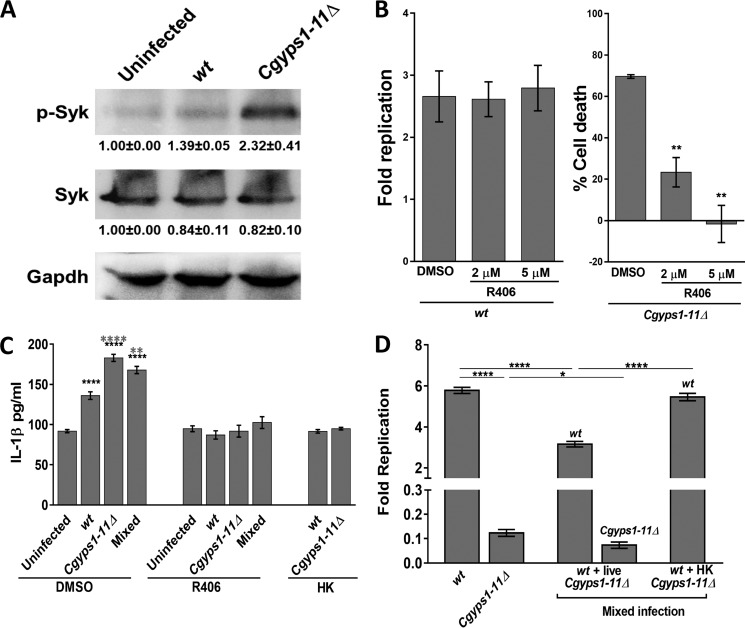
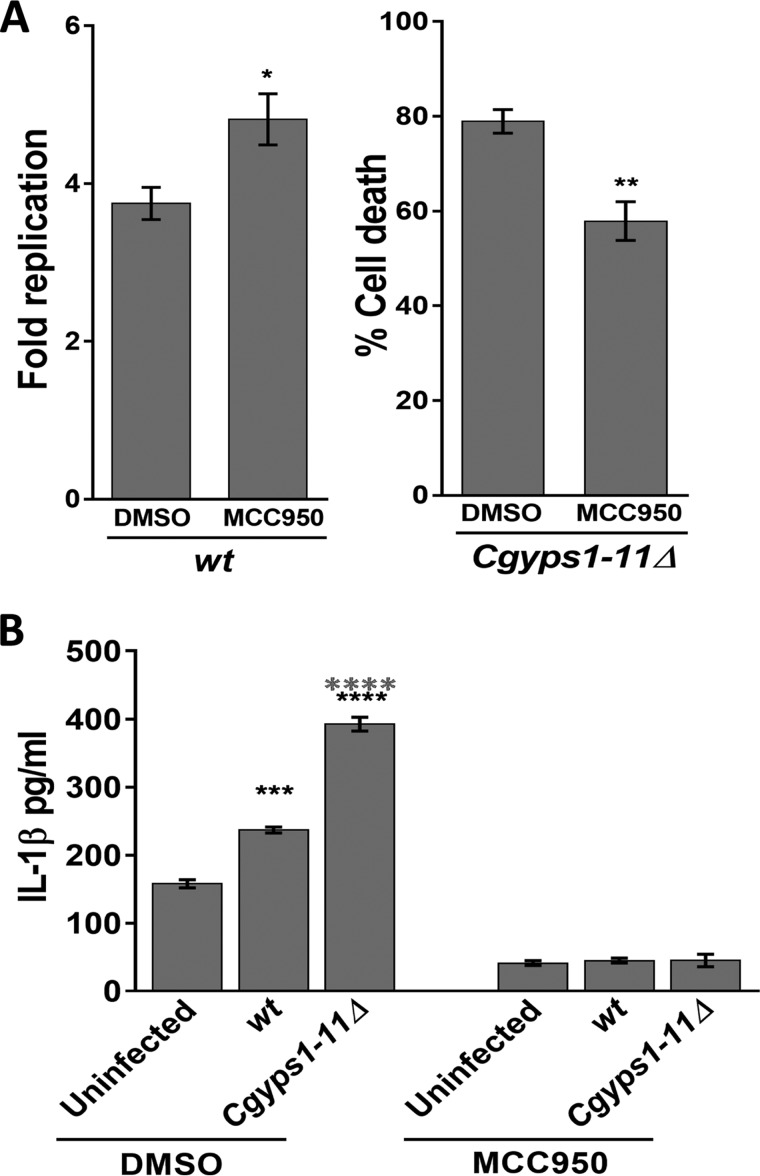
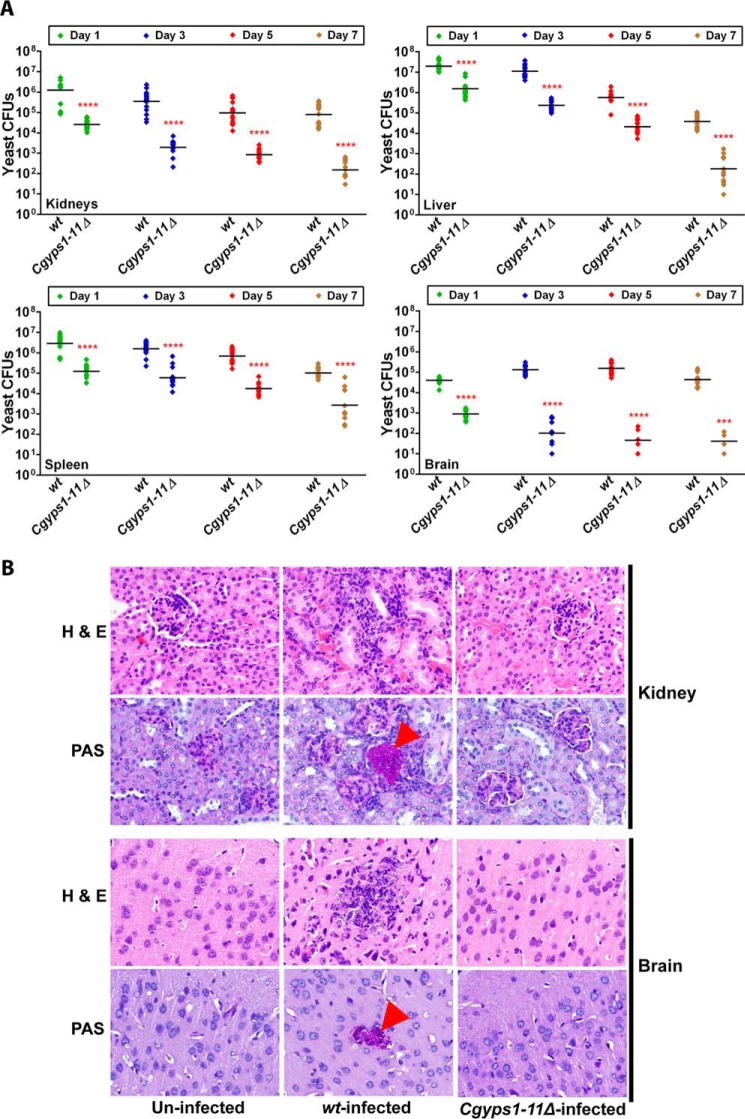
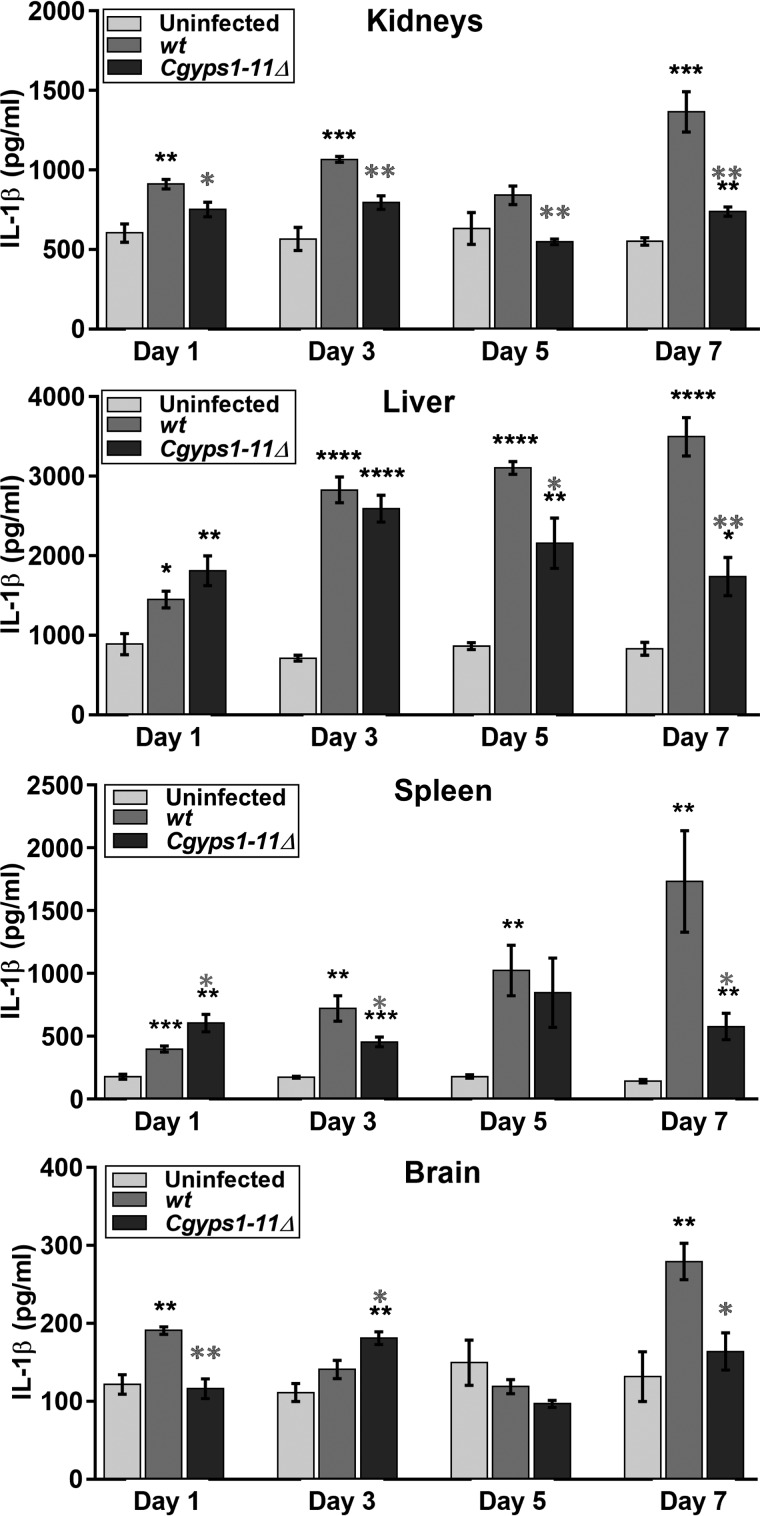
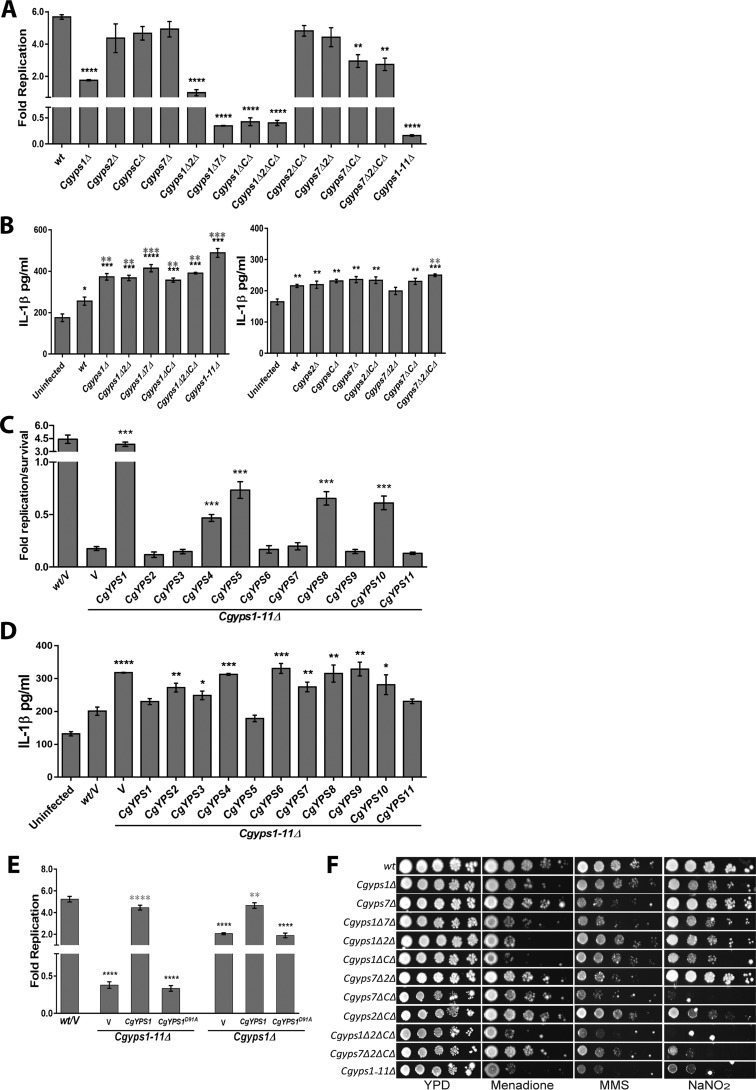
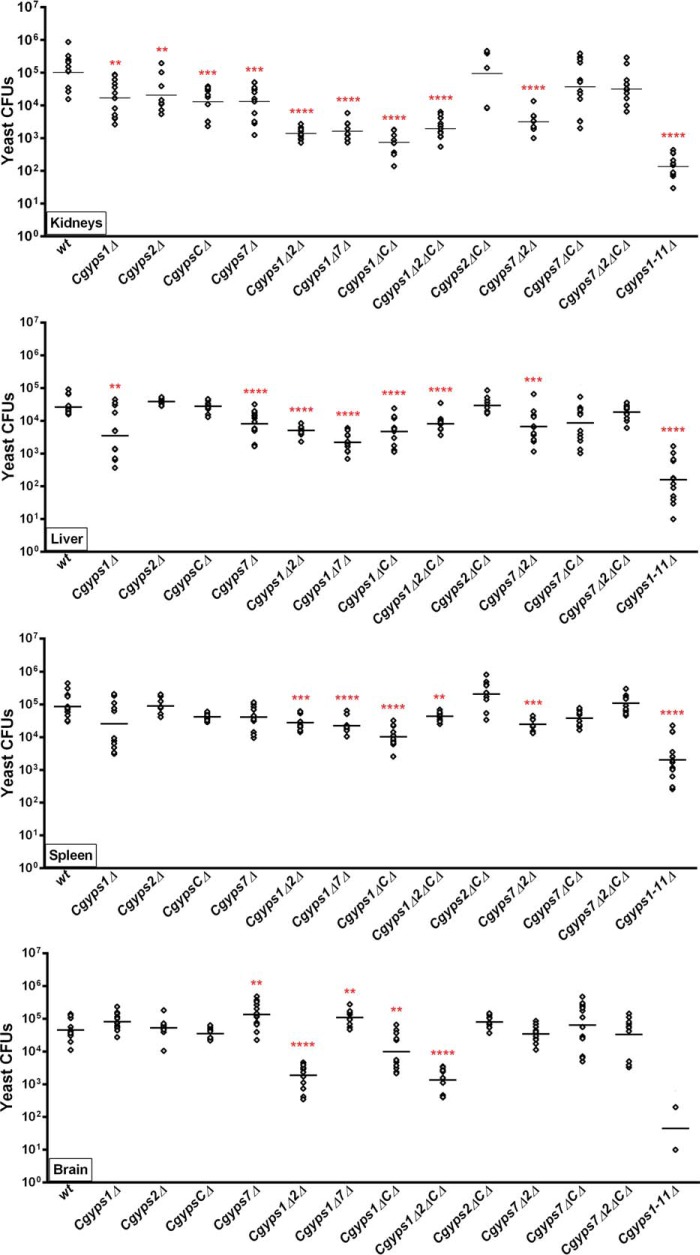
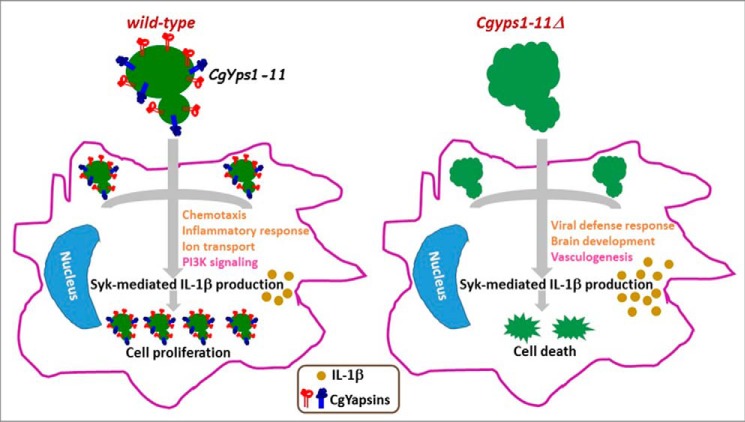
A family of 11 cell surface-associated aspartyl proteases (CgYps1-11), also referred as yapsins, is a key virulence factor in the pathogenic yeast Candida glabrata However, the mechanism by which CgYapsins modulate immune response and facilitate survival in the mammalian host remains to be identified. Here, using RNA-Seq analysis, we report that genes involved in cell wall metabolism are differentially regulated in the Cgyps1-11Δ mutant. Consistently, the mutant contained lower β-glucan and mannan levels and exhibited increased chitin content in the cell wall. As cell wall components are known to regulate the innate immune response, we next determined the macrophage transcriptional response to C. glabrata infection and observed differential expression of genes implicated in inflammation, chemotaxis, ion transport, and the tumor necrosis factor signaling cascade. Importantly, the Cgyps1-11Δ mutant evoked a different immune response, resulting in an enhanced release of the pro-inflammatory cytokine IL-1β in THP-1 macrophages. Further, Cgyps1-11Δ-induced IL-1β production adversely affected intracellular proliferation of co-infected WT cells and depended on activation of spleen tyrosine kinase (Syk) signaling in the host cells. Accordingly, the Syk inhibitor R406 augmented intracellular survival of the Cgyps1-11Δ mutant. Finally, we demonstrate that C. glabrata infection triggers elevated IL-1β production in mouse organs and that the CgYPS genes are required for organ colonization and dissemination in the murine model of systemic infection. Altogether, our results uncover the basis for macrophage-mediated killing of Cgyps1-11Δ cells and provide the first evidence that aspartyl proteases in C. glabrata are required for suppression of IL-1β production in macrophages.

Keywords: IL-1beta; Syk; THP-1 macrophages; Yapsins; cell wall; cell wall remodeling; chemotaxis; interleukin 1 (IL-1); intracellular survival; macrophage; mouse organ colonization; spleen tyrosine kinase (Syk).


Conflict of interest statement

The authors declare that they have no conflicts of interest with the contents of this article

Figures

Figure 1.
Figure 1.
RNA-Seq analysis reveals genes involved in polysaccharide metabolism to be up-regulated in the Cgyps1–11Δ mutant. A, list of differentially expressed genes that belong to the GO term “fungal-type cell wall organization” (GO:0031505), in the Cgyps1–11Δ mutant. B, qPCR validation of the RNA-Seq data. RNA was extracted, using the acid phenol extraction method, from log-phase WT and Cgyps1–11Δ cultures, and transcript levels of the indicated genes (six up-regulated and three down-regulated in the RNA-Seq experiment) were measured by qPCR. Data (mean ± S.E. (error bars), n = 3–4) were normalized against the CgACT1 mRNA control and represent -fold change in expression in Cgyps1–11Δ mutant compared with the WT strain. *, p < 0.05, paired two-tailed Student's t test. C–E, flow cytometry–based cell wall polysaccharide measurement. Indicated log-phase C. glabrata strains were harvested and stained with aniline blue, FITC-concanavalin A, and calcofluor white to estimate cell wall β-glucan (C), mannan (D), and chitin (E) content, respectively. Data (mean ± S.E., n = 3–7) presented as the mean fluorescence intensity ratio were calculated by dividing the fluorescence intensity value of the mutant sample by that of the WT sample (set as 1.0). V, C. glabrata strains carrying empty vector. ***, p < 0.001; paired two-tailed Student's t test. F, assessment of biofilm-forming capacity of the indicated C. glabrata strains on polystyrene-coated plates through a crystal violet–based staining assay. YPD-grown log-phase cells were suspended in PBS, and 1 × 10⁷ cells were incubated at 37 °C for 90 min in a polystyrene-coated 24-well plate. After two PBS washes, RPMI medium containing 10% fetal bovine serum was added to each well. Cells were allowed to make biofilms at 37 °C with shaking (75 rpm) for 48 h, with replacement of half of the spent RPMI medium with the fresh medium after 24 h of incubation. Following the removal of unbound C. glabrata cells with three PBS washes, the plate was air-dried and incubated with 250 μl of crystal violet solution (0.4% in 20% ethanol). After 45 min, 95% ethanol was added to stained adherent C. glabrata cells, and absorbance of the destaining solution was recorded at 595 nm after 45 min. The biofilm ratio was calculated by dividing the mutant absorbance units by those of WT cells (set to 1.0). Data represent mean ± S.E. of 4–7 independent experiments. V, C. glabrata strains carrying empty vector. ***, p < 0.001; paired two-tailed Student's t test.
Figure 2.
Figure 2.
Predicted catalytic residues of CgYps1 are required for its functions. A, multiple protein sequence alignment of Yps1. The sequences of Yps1 from C. glabrata (Cagl0m04191p), S. cerevisiae (Ylr120C) and C. albicans (CaSap9; C3_03870cp_a) were aligned and colored by the Geneious Basic version 5.6.4 program. Identical and conserved residues are shaded in green and greenish-brown colors, respectively. The conserved catalytic motifs (DTGSS and D(S/T)GTT) are marked with a red box. B, serial dilution spotting analysis. Overnight YPD-grown cultures of the indicated strains were taken, and A600 was normalized to 1.0. 3 μl of 10-fold serially diluted cultures were spotted on YNB, YNB (pH 2.0), and the YPD medium lacking or containing metal ions. Calcium chloride (CaCl2) and zinc chloride (ZnCl2) were used at a final concentration of 100 and 10 mm, respectively. After growth at 30 °C for 1–3 days, plates were imaged. V, C. glabrata strains carrying empty vector.
Figure 3.
Figure 3.
C. glabrata infection to THP-1 cells invokes a transcriptional response. A and B, survival defect of the Cgyps1–11Δ mutant in macrophages. C. glabrata WT and Cgyps1–11Δ mutant strains were infected to PMA-differentiated THP-1 macrophages (A) and macrophages derived from human peripheral blood monocytes (B) at 10:1 MOI, and intracellular yeast cfu were measured by plating macrophage lysates 2 and 24 h postinfection. Fold replication indicates the ratio of the number of intracellular C. glabrata cells at 24 h to that at 2 h postinfection. Data represent mean ± S.E. (error bars) of 3–4 independent experiments. **, p < 0.01; ***, p < 0.001; unpaired two-tailed Student's t test. C, Venn diagram illustrating overlap in differentially expressed genes between WT– and Cgyps1–11Δ–infected THP-1 macrophages compared with uninfected cells. D, qPCR validation of microarray data. RNA was extracted using TRIzol from 6-h uninfected and WT- and Cgyps1–11Δ–infected THP-1 macrophages, and transcript levels of the indicated genes were measured by qPCR. Data (mean ± S.E., n = 3–4) were normalized against the GAPDH mRNA control and represent -fold change in expression in C. glabrata–infected macrophages compared with uninfected THP-1 macrophages. *, p < 0.05; **, p < 0.01; ***, p < 0.001; paired two-tailed Student's t test.
Figure 4.
Figure 4.
CgYapsins are required to suppress the production of the pro-inflammatory cytokine IL-1β. Shown is analysis of the indicated cytokines in uninfected and WT– and Cgyps1–11Δ–infected THP-1 macrophages. PMA-differentiated THP-1 cells were either left uninfected or infected with C. glabrata WT and Cgyps1–11Δ mutant for 24 h. Expression of cytokines was evaluated in 100 μl of culture medium using the Multi-Analyte ELISArray kit. Data represent mean ± S.E. (error bars) of 3–4 independent experiments. Statistically significant differences in IL-1β levels between uninfected and C. glabrata–infected and between WT– and Cgyps1–11Δ–infected macrophages are indicated by black and gray asterisks, respectively. **, p < 0.01, ****, p < 0.0001; unpaired two-tailed Student's t test.
Figure 5.
Figure 5.
Cgyps1–11Δ–induced IL-1β production in THP-1 macrophages depends on Syk. A, representative immunoblot illustrating phosphorylated Syk in uninfected, and WT– and Cgyps1–11Δ–infected THP-1 macrophages. THP-1 cell extracts containing 120 μg of protein were resolved on 10% SDS-PAGE and probed with anti-phospho-Syk, anti-Syk, and anti-GAPDH antibodies. GAPDH was used as a loading control. For quantification, intensity of individual bands in three independent Western blots was measured using the ImageJ densitometry software. Total Syk and phosphorylated Syk signal in each lane was normalized to the corresponding GAPDH signal (considered as 1.0). Data (mean ± S.E. (error bars)) are presented as -fold change in signal intensity levels in infected samples compared with uninfected samples (taken as 1.0) below the blot. B, intracellular survival of WT and Cgyps1–11Δ mutant in R406-treated THP-1 macrophages. 2 and 5 μm R406 was added to THP-1 macrophages 2 h before C. glabrata infection, and infection was continued in the presence of R406. Fold Replication for WT cells indicates the ratio of the number of intracellular C. glabrata cells at 24 h to that at 2 h postinfection. Percentage cell death for the Cgyps1–11Δ mutant indicates viability loss of mutant cells in DMSO- and R406-treated THP-1 cells between 2 and 24 h of infection, as determined by measurement of intracellular cfu at these two time points. Data represent mean ± S.E. (n = 3). **, p < 0.01; unpaired two-tailed Student's t test. C, measurement of secreted IL-1β in DMSO- or R406-treated, C. glabrata–infected THP-1 cells. THP-1 macrophage infection was done as described in the legend to Fig. 5B with C. glabrata cells at an MOI of 1:1, and IL-1β levels in the culture supernatant were measured after 24 h using the human IL-1β ELISA Set II kit. HK, heat-killed dead C. glabrata cells that were obtained after incubation at 95 °C for 20 min. Mixed infection, co-infection of THP-1 cells with WT- and Cgyps1–11Δ cells. Notably, R406 treatment abolished C. glabrata–induced IL-1β production in THP-1 cells. Data (mean ± S.E.; n = 4–8) represent secreted IL-1β levels under the indicated conditions. Statistically significant differences in IL-1β levels between uninfected and C. glabrata–infected and between WT- and Cgyps1–11Δ–infected macrophages are indicated by black and gray asterisks, respectively. **, p < 0.01, ****, p < 0.0001; unpaired two-tailed Student's t test. D, assessment of intracellular proliferation of WT cells in THP-1 macrophages infected with live WT and live or dead Cgyps1–11Δ cells. The total number of C. glabrata cells infected to THP-1 macrophages was the same (1 × 10⁵) in both single and mixed infections. Fold Replication indicates the ratio of the number of intracellular C. glabrata cells at 24 h to that at 2 h postinfection. Data represent mean ± S.E. of 4–6 independent experiments. *, p < 0.05; ****, p < 0.0001; unpaired two-tailed Student's t test.
Figure 6.
Figure 6.
NLRP3 inflammasome activation is required for C. glabrata-evoked IL-1β production in THP-1 macrophages. A, intracellular survival of WT and Cgyps1–11Δ mutant in MCC950-treated THP-1 macrophages. 15 μm MCC950 was added to THP-1 macrophages 2 h before C. glabrata infection, and infection was continued in the presence of MCC950. Fold Replication for WT cells indicates the ratio of the number of intracellular C. glabrata cells at 24 h to that at 2 h postinfection. Percentage cell death for the Cgyps1–11Δ mutant indicates viability loss of mutant cells in DMSO- and MCC950-treated THP-1 cells between 2 and 24 h of infection, as determined by measurement of intracellular cfu at these two time points. Data represent mean ± S.E. (error bars) (n = 3). *, p < 0.05; **, p < 0.01; unpaired two-tailed Student's t test. B, measurement of secreted IL-1β in DMSO- or MCC950 (15 μm)-treated, C. glabrata–infected THP-1 cells. THP-1 macrophage infection was done as described in the legend to Fig. 5B with C. glabrata cells at an MOI of 1:1, and IL-1β levels in the culture supernatant were measured after 24 h. Data (mean ± S.E.; n = 3–4) represent secreted IL-1β levels under the indicated conditions. Statistically significant differences in IL-1β levels between uninfected and C. glabrata–infected and WT– and Cgyps1–11Δ–infected macrophages are indicated by black and gray asterisks, respectively. ***, p < 0.001; ****, p < 0.0001; unpaired two-tailed Student's t test.
Figure 7.
Figure 7.
CgYapsins are required for colonization and dissemination to the brain in the mouse model of systemic candidiasis. A, kinetics of infection of C. glabrata WT and Cgyps1–11Δ cells in BALB/c mice. Mice were infected intravenously and sacrificed at the indicated days, and fungal burden in kidneys, liver, spleen, and brain was determined using a cfu-based assay. Diamonds, yeast cfu recovered from organs of the individual mouse; horizontal line, cfu geometric mean (n = 12–16) for each strain. Statistically significant differences in cfu between WT- and Cgyps1–11Δ-infected mice are marked (***, p < 0.001; ****, p < 0.0001; Mann–Whitney test). Of note, we could retrieve Cgyps1–11Δ cfu from the brain of only four mice of 14 infected animals 7 dpi. B, representative photomicrographs of hematoxylin and eosin– and PAS–stained kidney and brain sections from uninfected, WT-infected, and Cgyps1–11Δ–infected mice on day 3 after infection. Magnification was ×40. The arrowheads in tissue sections indicate PAS-positive yeast cells.
Figure 8.
Figure 8.
C. glabrata infection invokes IL-1 β production in the mouse model of systemic candidiasis. Measurement of secreted IL-1β in tissue homogenates of kidneys, liver, spleen, and brain of mice infected with WT or Cgyps1–11Δ cells at the indicated days using the mouse IL-1β/IL-1F2 DuoSet ELISA kit. Data (mean ± S.E. (error bars), n = 4) represent IL-1 β levels under the indicated conditions. Statistically significant differences in IL-1β levels between uninfected and C. glabrata–infected, and WT– and Cgyps1–11Δ–infected mice are indicated by black and gray asterisks, respectively. *, p < 0.05; **, p < 0.01; ***, p < 0.001; ****, p < 0.0001; unpaired two-tailed Student's t test.
Figure 9.
Figure 9.
CgYPS-C genes are required for survival of the macrophage internal milieu and nitrosative stress. A, intracellular growth profiles of the indicated CgypsΔ mutants in THP-1 macrophages. THP-1 macrophage infection was done as described in the legend to Fig. 3A with C. glabrata cells at an MOI of 10:1. Fold Replication indicates the ratio of the number of intracellular C. glabrata cells at 24 h to that at 2 h postinfection. Data represent mean ± S.E. (error bars) of 3–5 independent experiments. **, p < 0.01; ****, p < 0.0001; unpaired two-tailed Student's t test. B, IL-1β was measured in the culture supernatant of uninfected THP-1 and THP-1 cells infected with the indicated C. glabrata strains as described in the legend to Fig. 6B. Data (mean ± S.E.; n = 3–5) represent secreted IL-1β levels under the indicated conditions. Statistically significant differences in IL-1β levels between uninfected and C. glabrata–infected and between WT– and Cgyps1–11Δ–infected macrophages are indicated by black and gray asterisks, respectively. *, p < 0.05; **, p < 0.01; ***, p < 0.001; ****, p < 0.0001; unpaired two-tailed Student's t test. C, intracellular growth profiles of the Cgyps1–11Δ mutant overexpressing individual CgYPS1–11 genes in THP-1 macrophages. Fold Replication indicates the ratio of the number of intracellular C. glabrata cells at 24 h to that at 2 h postinfection. Data represent mean ± S.E. of 3–5 independent experiments. V, C. glabrata strains carrying empty vector. ***, p < 0.001; unpaired two-tailed Student's t test. D, IL-1β was measured in the culture supernatant of uninfected THP-1 and THP-1 cells infected with the indicated C. glabrata strains as described in the legend to Fig. 6B. Data (mean ± S.E.; n = 4) represent secreted IL-1β levels under the indicated conditions. V, C. glabrata strains carrying empty vector. Statistically significant differences in IL-1β levels between WT– and Cgyps1–11Δ strain–infected macrophages are marked. *, p < 0.05; **, p < 0.01; ***, p < 0.001; ****, p < 0.0001; unpaired two-tailed Student's t test. E, intracellular survival of Cgyps1Δ and Cgyps1–11Δ mutant expressing either CgYps1 or putative catalytically dead CgYps1D91A in THP-1 macrophages. Fold Replication indicates the ratio of the number of intracellular C. glabrata cells at 24 h to that at 2 h postinfection. Data represent mean ± S.E. of 3–7 independent experiments. Black asterisks, statistically significant differences between WT and mutants carrying either vector or CgYps1D91A protein. Gray asterisks, statistically significant differences between mutants carrying vector and CgYps1 protein. **, p < 0.01; ****, p < 0.0001; unpaired two-tailed Student's t test. F, serial dilution spotting analysis of CgypsΔ mutants under the indicated conditions. Menadione, MMS, and sodium nitrite (NaNO2) were used at a final concentration of 50 mm, 0.04%, and 60 mm, respectively. Growth was recorded after 2 days of incubation at 30 °C.
Figure 10.
Figure 10.
CgYps2 and CgYps-C proteins are required for survival in the murine systemic candidiasis model. BALB/c mice were infected intravenously with WT and the indicated CgypsΔ mutants. At 7 dpi, mice were sacrificed, and organ fungal burden was calculated via a cfu assay. Diamonds, yeast cfu recovered from organs of the individual mouse; horizontal line, cfu geometric mean (n = 8–14) for each strain. Statistically significant differences between cfu recovered from WT– and CgypsΔ–infected mice are marked (**, p < 0.01; ***, p < 0.001; ****, p < 0.0001; Mann–Whitney test).
Figure 11.
Figure 11.
Role of CgYapsins in interaction with macrophages. Shown is a schematic model illustrating the role of CgYapsins in regulating the interaction of C. glabrata with THP-1 macrophages. CgYapsins modulate the macrophage transcriptional response probably to facilitate intracellular survival of C. glabrata through regulated production of Syk-dependent IL-1β. Lack of CgYapsins leads to increased IL-1β levels, which results in cell death. Altered cell wall attributes of the Cgyps1–11Δ mutant are depicted through surface ridges. Transcriptionally up-regulated and down-regulated processes in infected THP-1 cells are indicated in light brown and pink, respectively.

Similar articles

Cited by

References

    1. Brown G. D., Denning D. W., Gow N. A. R., Levitz S. M., Netea M. G., and White T. C. (2012) Hidden killers: human fungal infections. Sci. Transl. Med. 4, 165rv13 - PubMed
    1. Pfaller M. A., Pappas P. G., and Wingard J. R. (2006) Invasive fungal pathogens: current epidemiological trends. Clin. Infect. Dis. 43, S3–S14 10.1086/504490 - DOI
    1. Montagna M. T., Lovero G., Borghi E., Amato G., Andreoni S., Campion L., Lo Cascio G., Lombardi G., Luzzaro F., Manso E., Mussap M., Pecile P., Perin S., Tangorra E., Tronci M., et al. (2014) Candidemia in intensive care unit: a nationwide prospective observational survey (GISIA-3 study) and review of the European literature from 2000 through 2013. Eur. Rev. Med. Pharmacol. Sci. 18, 661–674 - PubMed
    1. Pfaller M. A., Moet G. J., Messer S. A., Jones R. N., and Castanheira M. (2011) Candida bloodstream infections: comparison of species distributions and antifungal resistance patterns in community-onset and nosocomial isolates in the SENTRY Antimicrobial Surveillance Program, 2008–2009. Antimicrob. Agents Chemother. 55, 561–566 10.1128/AAC.01079-10 - DOI - PMC - PubMed
    1. Kaur R., Domergue R., Zupancic M. L., and Cormack B. P. (2005) A yeast by any other name: Candida glabrata and its interaction with the host. Curr. Opin. Microbiol. 8, 378–384 10.1016/j.mib.2005.06.012 - DOI - PubMed

Publication types

MeSH terms