. 2018 Apr 20;293(16):5793-5805.
doi: 10.1074/jbc.RA118.001860. Epub 2018 Feb 28.

Disulfide isomerase activity of the dynamic, trimeric Proteus mirabilis ScsC protein is primed by the tandem immunoglobulin-fold domain of ScsB

Affiliations

Disulfide isomerase activity of the dynamic, trimeric Proteus mirabilis ScsC protein is primed by the tandem immunoglobulin-fold domain of ScsB

Emily J Furlong et al. J Biol Chem. .

Abstract

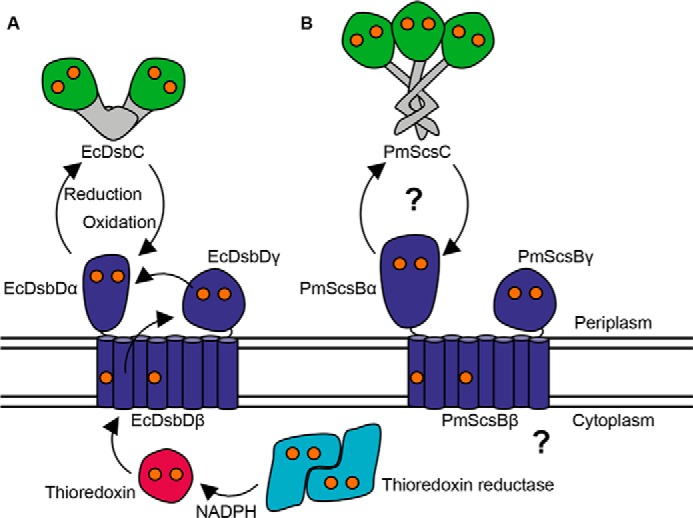
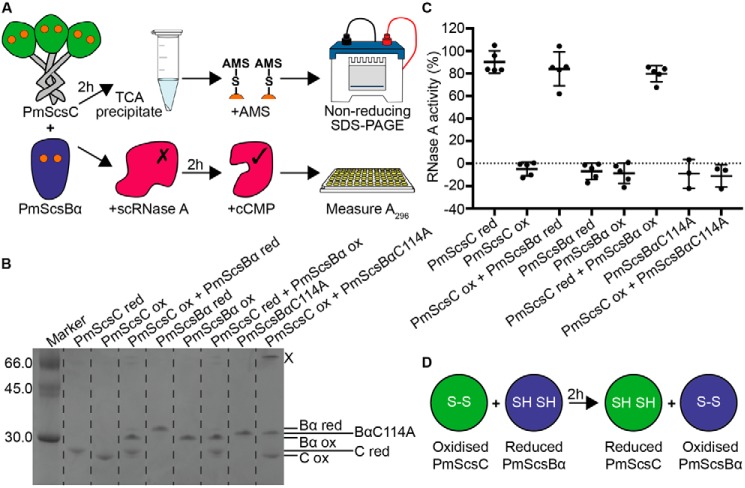
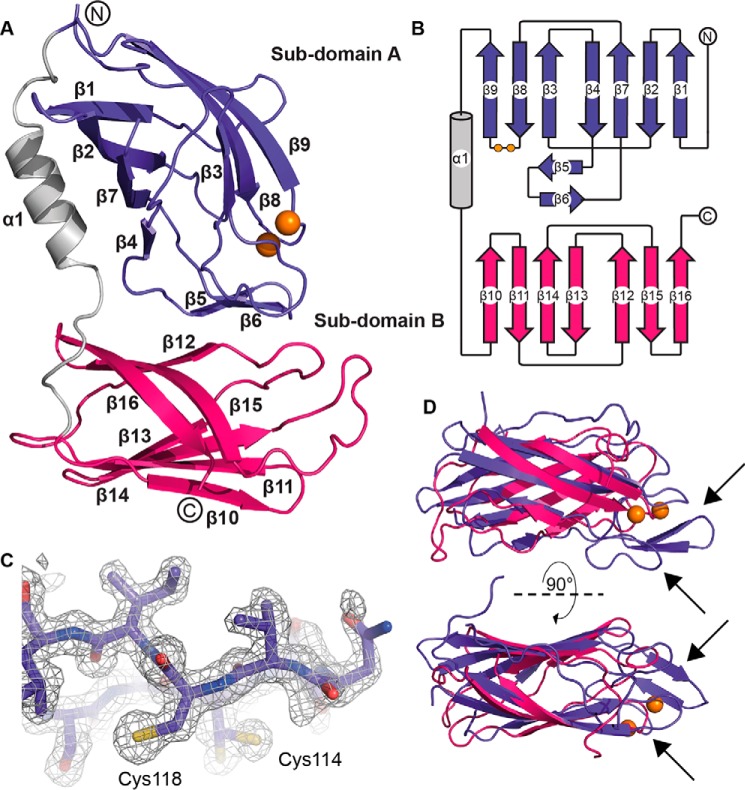
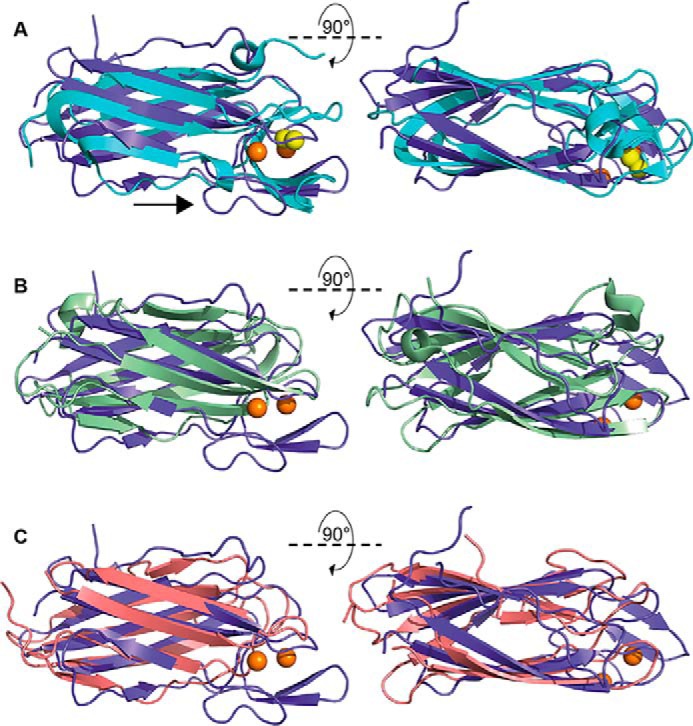
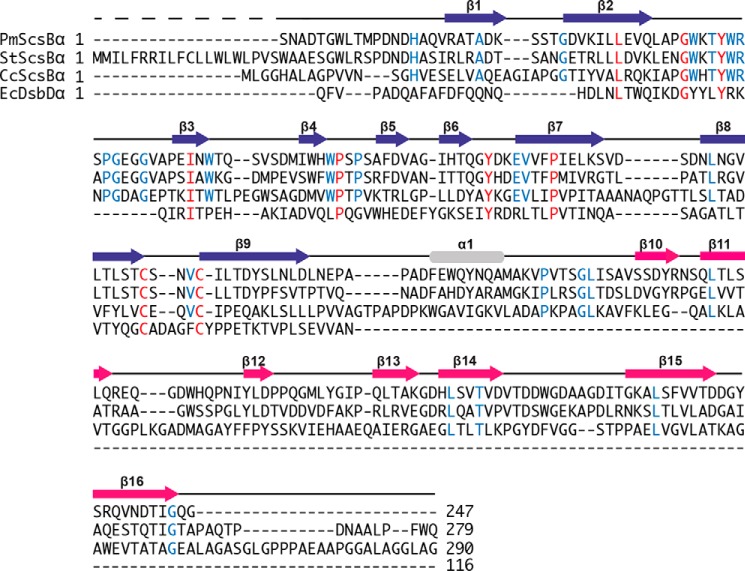
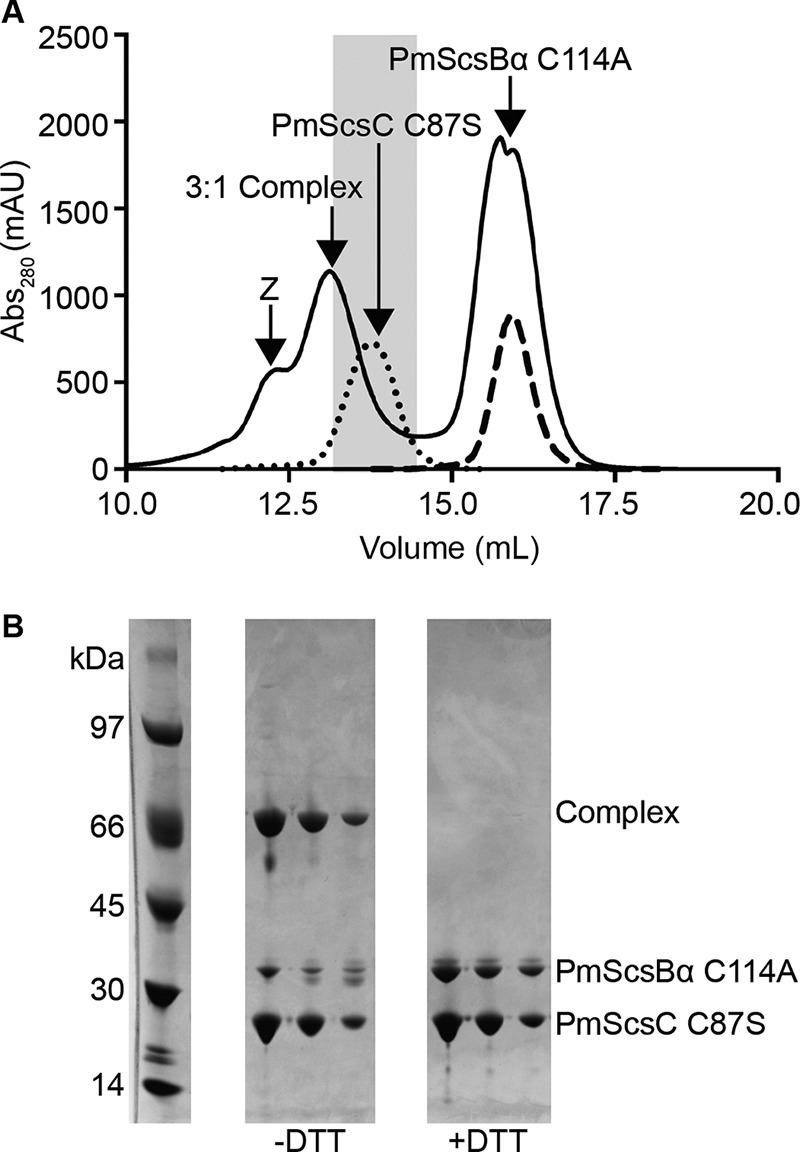
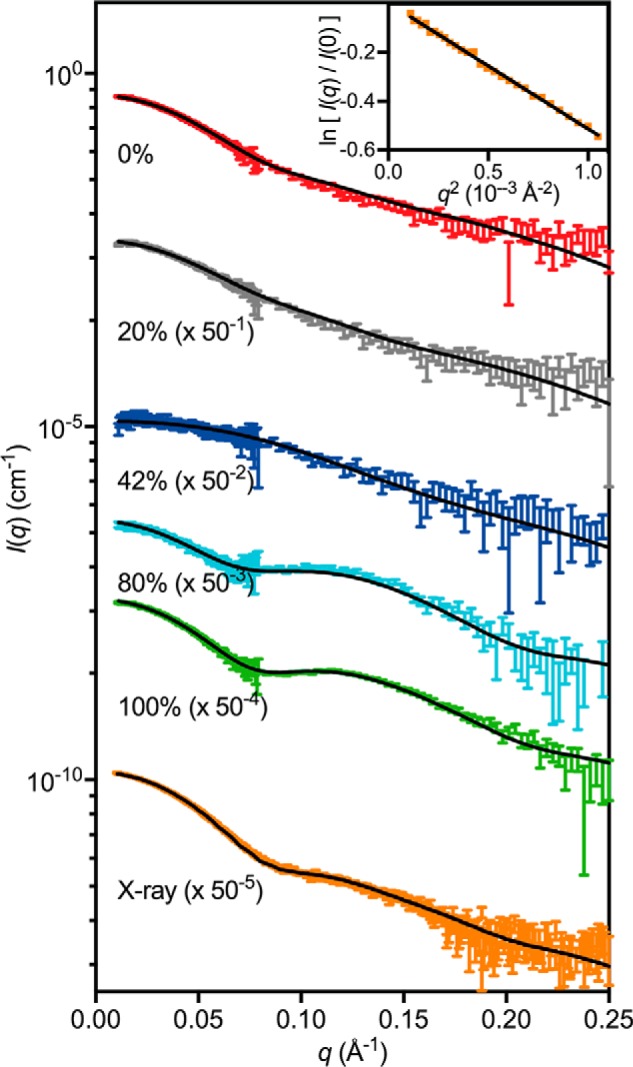
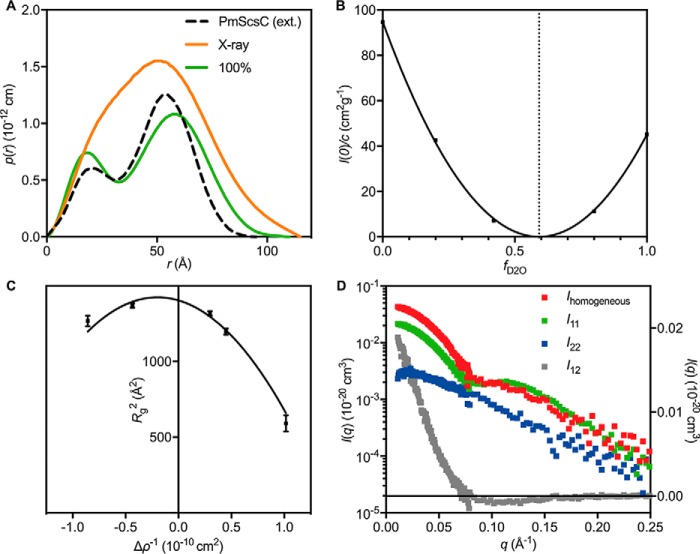
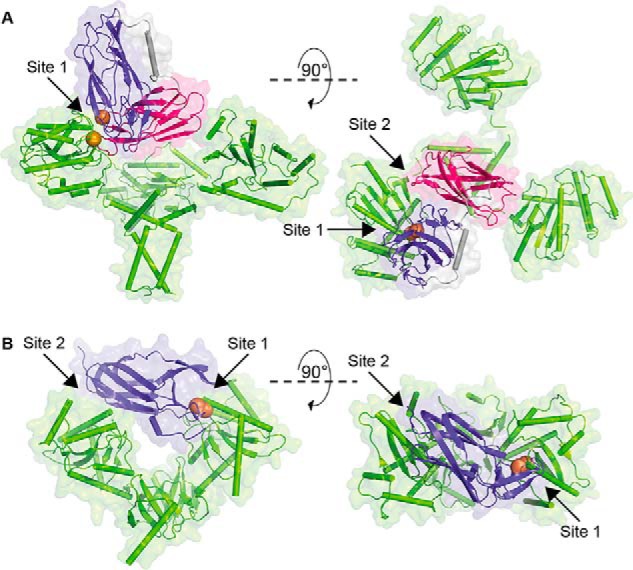
Correct disulfide bond formation is essential for proper folding of many proteins, including bacterial virulence factors. The suppressor of copper sensitivity (Scs) proteins have roles in dithiol/disulfide interchange and the bacterial response to copper stress. Encoded in a four-gene cassette (ScsABCD) present in many Gram-negative bacteria, the Scs proteins are enigmatic and poorly characterized. Here, we show that the periplasmic α-domain of the membrane protein ScsB in the Gram-negative bacterium Proteus mirabilis forms a redox relay with the soluble periplasmic protein PmScsC. We also found that the periplasmic α-domain is sufficient to activate the disulfide isomerase activity of PmScsC. The crystal structure of PmScsBα at a resolution of 1.54 Å revealed that it comprises two structurally similar immunoglobulin-like folds, one of which includes a putative redox-active site with the sequence CXXXC. We confirmed the importance of these cysteine residues for PmScsBα function, and in addition, we engineered cysteine variants that produced a stable complex between PmScsC and PmScsBα. Using small-angle X-ray and neutron scattering analyses with contrast variation, we determined a low-resolution structure of the PmScsC-PmScsBα complex. The structural model of this complex suggested that PmScsBα uses both of its immunoglobulin-like folds to interact with PmScsC and revealed that the highly dynamic PmScsC becomes ordered upon PmScsBα binding. These findings add to our understanding of the poorly characterized Scs proteins.

Keywords: CXXXC active site; Scs protein; bacterial copper sensitivity; copper; disulfide bond; immunoglobulin-like domain; oxidation-reduction (redox); protein disulfide isomerase; protein structure; thioredoxin fold.


Conflict of interest statement

The authors declare that they have no conflicts of interest with the contents of this article

Figures

Figure 1.
Figure 1.
Schematic representation of bacterial disulfide isomerases and their redox relay partners. A, EcDsbC is reduced by EcDsbDα, which obtains its reducing power from a reduction cascade that starts with thioredoxin reductase in the bacterial cytoplasm. B, PmScsC and PmScsBα are putative interaction partners, and the source of PmScsB's reducing power is yet to be determined (represented by the question marks). The catalytic cysteines in each protein are shown as orange spheres.
Figure 2.
Figure 2.
PmScsBα reduces and activates PmScsC. A, schematic diagrams of the gel-shift and scRNase A experiments. B, a representative gel from the gel-shift assay showing the interaction between PmScsC and PmScsBα. Dotted lines are a visual aide to delineate lanes on the gel. The band marked X is likely to be 1:1 PmScsC–PmScsBα C114A complex as the usually trimeric PmScsC runs as a monomer on SDS-PAGE. C, results from the modified scrambled RNase A assay. Activity is shown relative to native RNase A (100%) and scrambled RNase A only (0%) controls. For each sample, the activity of three or five replicates and the mean with S.D. (error bars) is shown. D, schematic showing the redox interaction that occurs between PmScsC and PmScsBα. red, reduced; ox, oxidized.
Figure 3.
Figure 3.
Structural characterization of PmScsBα. A, schematic representation of the crystal structure of PmScsBα (Protein Data Bank code 6C29). B, topology diagram of PmScsBα showing the secondary structure features of the protein. C, the omit electron density around the catalytic loop in chain A of the PmScsBα crystal structure is displayed. The wire mesh represents the likelihood-weighted FoFc electron density difference map, which is contoured to 3σ and was generated using phenix.refine with the region of interest omitted from the structure. D, superimposition of subdomain A and B structures showing the structural similarity between the domains. Arrows indicate the inserted β-hairpin structure and the extended loop of subdomain A. In all panels, subdomain A is colored purple, and subdomain B is magenta with the linking α-helix shown in gray. The catalytic cysteines are represented as orange spheres. The N and C termini are labeled in A and B.
Figure 4.
Figure 4.
Structural overlay of PmScsBα subdomain A with selected DALI hits. A, PmScsBα subdomain A (purple) aligned with EcDsbDα (Protein Data Bank code 1JPE) (cyan). The catalytic cysteines of both PmScsBα subdomain A and EcDsbDα are shown as spheres and colored in orange and yellow, respectively. An arrow indicates the extended loop in the PmScsBα structure. B, PmScsBα subdomain A (purple) aligned with Protein Data Bank code 2A7B (light green). C, PmScsBα subdomain A (purple) aligned with Protein Data Bank code 3MNM (light pink). Neither 2A7B nor 3MNM have catalytic cysteines so in both B and C the orange spheres correlate to the cysteines of PmScsBα.
Figure 5.
Figure 5.
Sequence alignments. The sequence alignment of the PmScsBα crystal structure with StScsBα and CcScsBα sequences and the structure-based sequence alignment with EcDsbDα crystal structure (Protein Data Bank code 1JPE) are shown. Secondary structure elements of PmScsBα are shown above the corresponding sequence and are colored according to the scheme in Fig. 3. Residues that are conserved between all four proteins are highlighted in red; those that are conserved only between the ScsBα proteins are colored blue.
Figure 6.
Figure 6.
Formation of 3:1 PmScsC C87S–PmScsBα C114A complex. A, SEC chromatographs from the purification of the 3:1 PmScsC–PmScsBα complex (solid line), purified PmScsC C87S (dotted line), and PmScsBα C114A (dashed line). In the purification of the complex, excess PmScsC was removed prior to SEC using an immobilized metal ion affinity chromatography step. The leading shoulder (Z) suggests the presence of a 3:2 and/or 3:3 PmScsC C87S–PmScsBα C114A complex. The shaded region highlights the fractions of the 3:1 PmScsC–PmScsBα peak (solid line) that were pooled for structural analysis. B, the fractions from the shaded region of the 3:1 PmScsC–PmScsBα complex peak run on SDS-PAGE without and with DTT. PmScsC is a trimer that separates and runs as a monomer on SDS-PAGE. The lane labeled −DTT shows that the trimer–monomer complex separates into complex (covalently linked protomer of PmScsC with monomer of PmScsBα; 55.1 kDa) and uncomplexed PmScsC C87S (24.8 kDa) in an approximate 1:1 ratio. When run with DTT (lane labeled +DTT), the higher band dissociates into the two complex components in an approximate 3:1 ratio. Abs, absorbance; mAU, milliabsorbance units.
Figure 7.
Figure 7.
SAXS/SANS scattering curves. SAXS and SANS data (offset for clarity) collected from the 3:1 PmScsC C87S–DPmScsBα C114A complex with the model scattering curves overlaid (solid black line): 0% (χ2 = 1.16; red; on absolute scale), 20% (χ2 = 1.20; gray; offset by a factor of 50−1), 42% (χ2 = 1.00; blue; offset by a factor of 50−2), 80% (χ2 = 1.11; cyan; offset by a factor of 50−3), 100% (χ2 = 0.86; green; offset by a factor of 50−4), and X-ray (χ2 = 1.80; orange; offset by a factor of 50−5). A Guinier plot for the SAXS data is shown in the inset. The match point of PmScsC C87S is ∼42% D2O (blue) where DPmScsBα C114A dominates the scattering, whereas the match point of DPmScsBα C114A is ∼100% D2O (green) where PmScsC C87S dominates the scattering. Error bars represent the S.E.
Figure 8.
Figure 8.
Other SAXS/SANS results. A, p(r) derived from the experimental X-ray scattering data (orange) and the 100% scattering data (green), which should approximate the p(r) for PmScsC C87S alone. The p(r) derived from the extended (ext.) crystal structure (Protein Data Bank code 5ID4) is shown as a black dotted line for reference. B, a plot of I(0) normalized by concentration as a function of D2O content of the supporting solvent. The plot is parabolic in shape and reveals that the match point of the entire complex is 59% D2O (vertical dotted line). C, Stuhrmann plot for the 3:1 PmScsC C87S–DPmScsBα C114A complex, conforming to Rg2 = Rm2 + αΔρ−1 − βΔρ−2 where Rm is the radius of gyration of that object with homogenous contrast and α and β are related to the contrast variations within the object. The values obtained from a fit to the plot (solid black line) are: Rm = 37.5 ± 0.4, α = −210 ± 50, and β = 520 ± 100. The negative value of α reveals that the region with higher contrast (i.e. DPmScsBα C114A) lies toward the center of the molecule. Error bars represent the S.E. D, the composite scattering functions determined from the neutron contrast variation data. The I11 curve (green; left y axis) corresponds to scattering from PmScsC C87S, the I22 curve (blue; left y axis) corresponds to scattering from DPmScsBα C114A, and the I12 curve (gray; right y axis) is related to the arrangement of DPmScsBα C114A relative to PmScsC C87S. Ihomogeneous = I11 + I22 + I12 (red; left y axis) is the scattering curve of an object with the same shape as the PmScsC C87S–DPmScsBα C114A complex but with homogeneous contrast and is used for estimating the Porod volume and molecular mass from the SANS data.
Figure 9.
Figure 9.
Binding sites in the PmScsC–PmScsBα SANS model and EcDsbC-EcDsbDα structure (Protein Data Bank code 1JZD). A, model of the 3:1 complex generated from the SAXS/SANS data shown in backbone and surface representation. PmScsBα binds to one PmScsC (green) protomer with both subdomains A (purple; Site 1) and B (magenta; Site 2). B, crystal structure of the EcDsbC–EcDbsDα complex. EcDsbDα (purple) binds to both protomers of EcDsbC (green; binding Sites 1 and 2). In both A and B, the catalytic cysteines involved in the intermolecular disulfide bond between the partner proteins are shown as orange spheres.

Similar articles

Cited by

References

    1. Martin J. L., Bardwell J. C., and Kuriyan J. (1993) Crystal structure of the DsbA protein required for disulfide bond formation in vivo. Nature 365, 464–468 10.1038/365464a0 - DOI - PubMed
    1. Inaba K., Murakami S., Suzuki M., Nakagawa A., Yamashita E., Okada K., and Ito K. (2006) Crystal structure of the DsbB-DsbA complex reveals a mechanism of disulfide bond generation. Cell 127, 789–801 10.1016/j.cell.2006.10.034 - DOI - PubMed
    1. Goldstone D., Haebel P. W., Katzen F., Bader M. W., Bardwell J. C., Beckwith J., and Metcalf P. (2001) DsbC activation by the N-terminal domain of DsbD. Proc. Natl. Acad. Sci. U.S.A. 98, 9551–9556 10.1073/pnas.171315498 - DOI - PMC - PubMed
    1. McCarthy A. A., Haebel P. W., Törrönen A., Rybin V., Baker E. N., and Metcalf P. (2000) Crystal structure of the protein disulfide isomerase, DsbC, from Escherichia coli. Nat. Struct. Biol. 7, 196–199 10.1038/73295 - DOI - PubMed
    1. Cho S. H., Parsonage D., Thurston C., Dutton R. J., Poole L. B., Collet J. F., and Beckwith J. (2012) A new family of membrane electron transporters and its substrates, including a new cell envelope peroxiredoxin, reveal a broadened reductive capacity of the oxidative bacterial cell envelope. mBio 3, e00291–11 10.1128/mBio.00291-11 - DOI - PMC - PubMed

Publication types

Substances