. 2018 Apr 27;92(10):e02221-17.
doi: 10.1128/JVI.02221-17. Print 2018 May 15.

Relative Abundance of Integrant-Derived Viral RNAs in Infected Tissues Harvested from Chronic Hepatitis B Virus Carriers

Affiliations

Relative Abundance of Integrant-Derived Viral RNAs in Infected Tissues Harvested from Chronic Hepatitis B Virus Carriers

Natalia Freitas et al. J Virol. .

Abstract

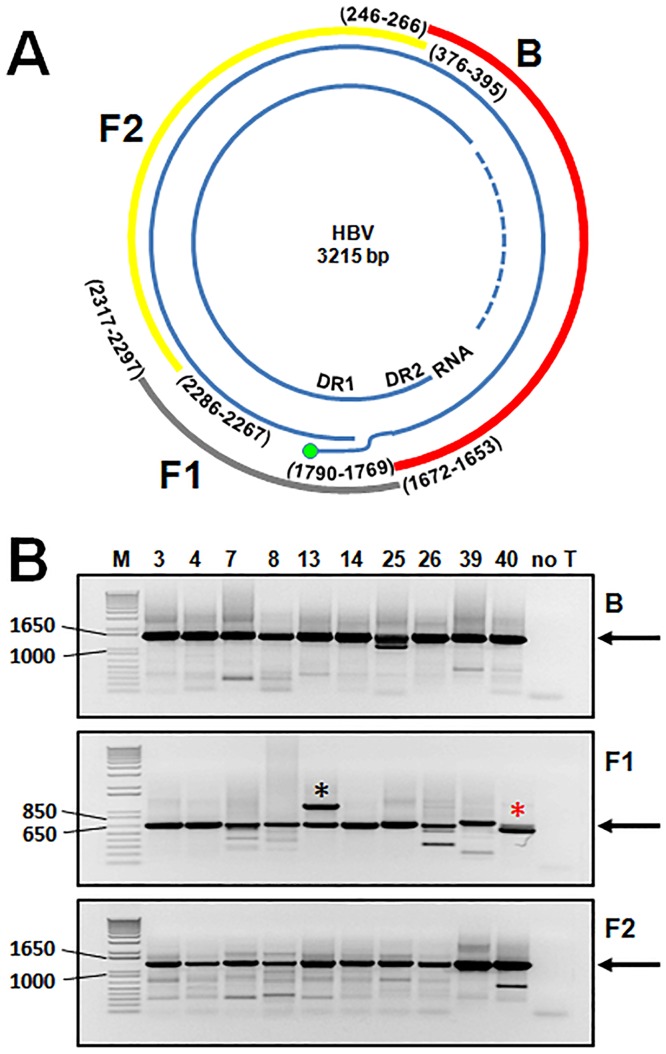
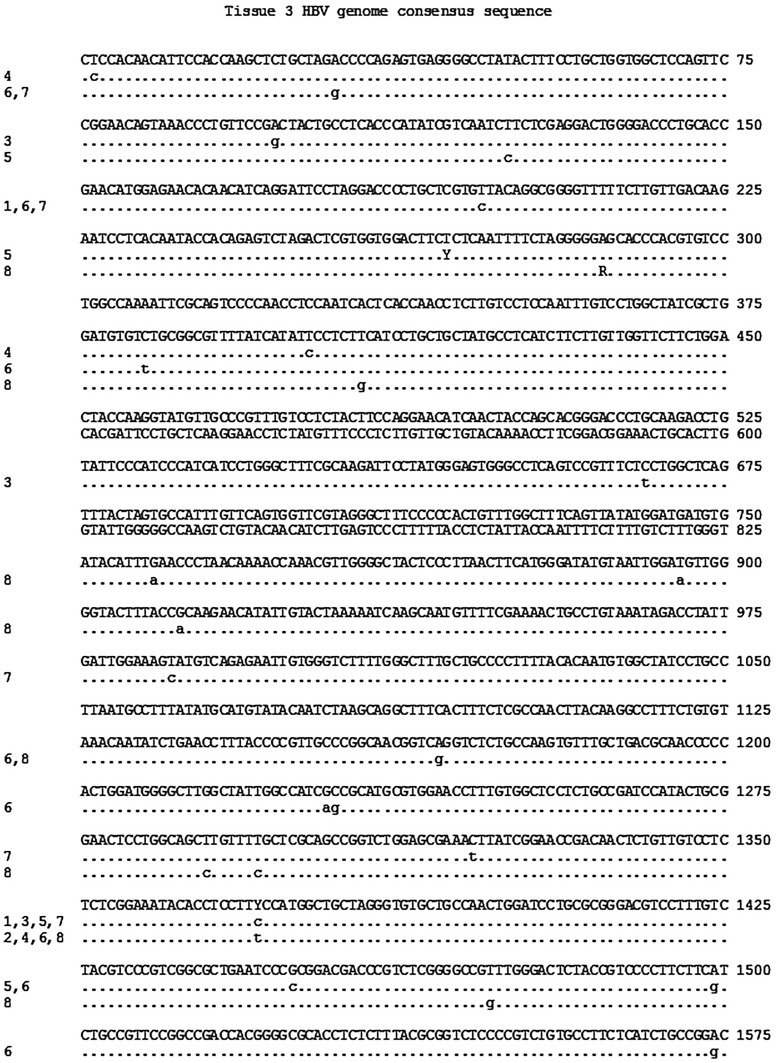
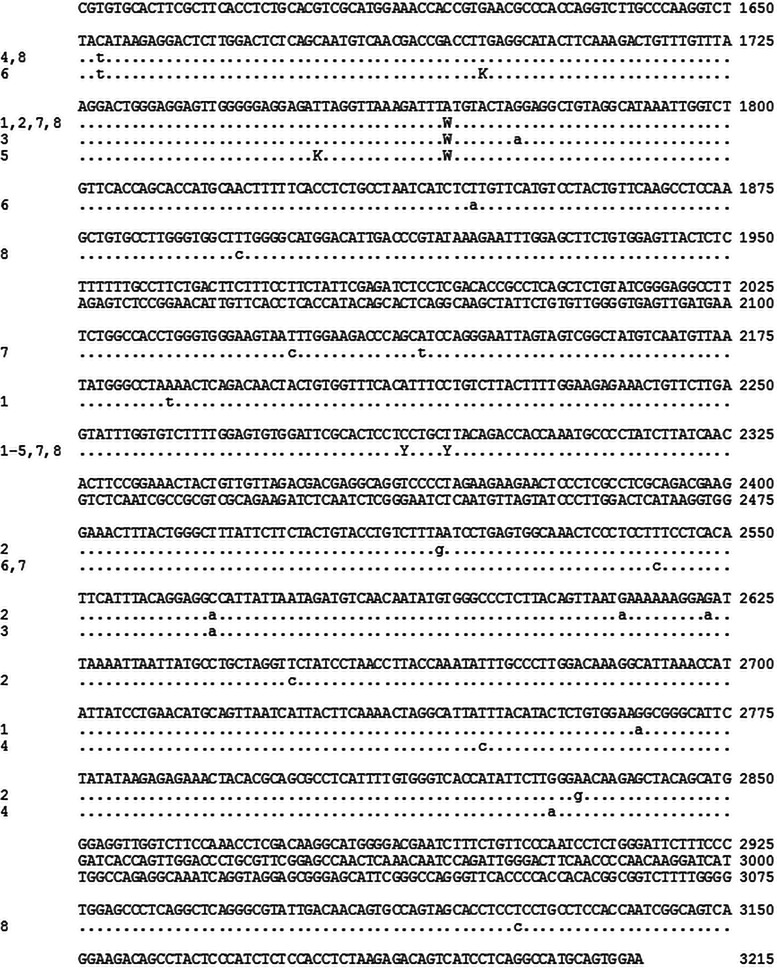
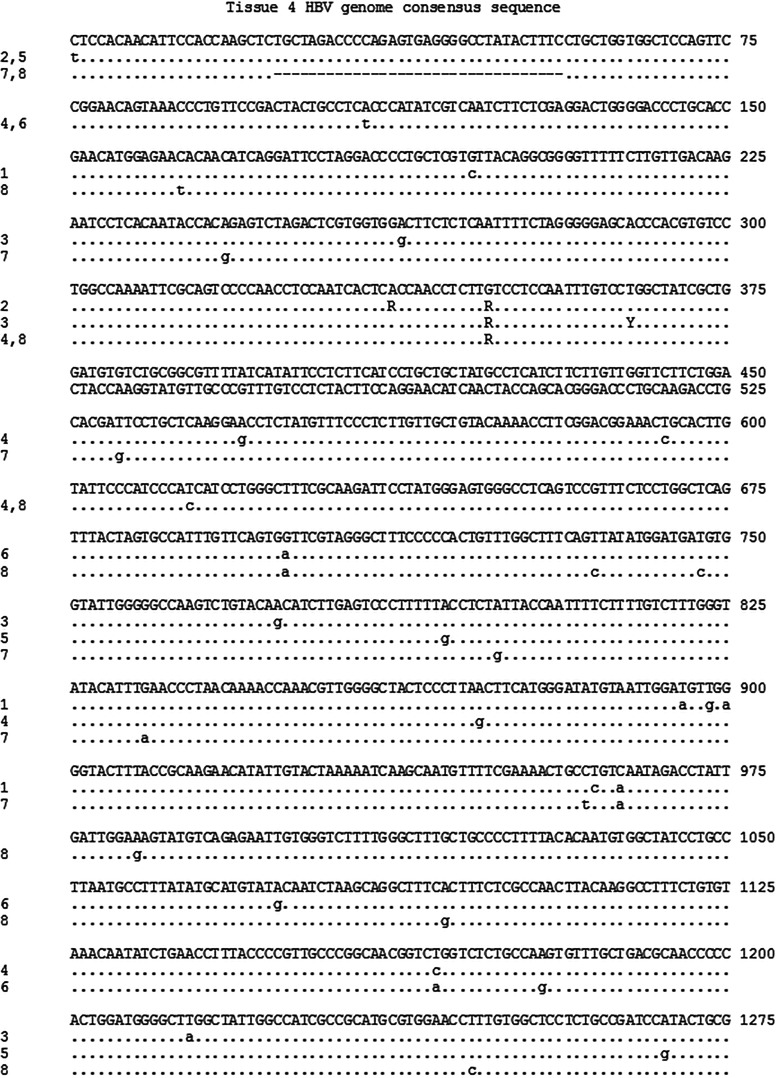
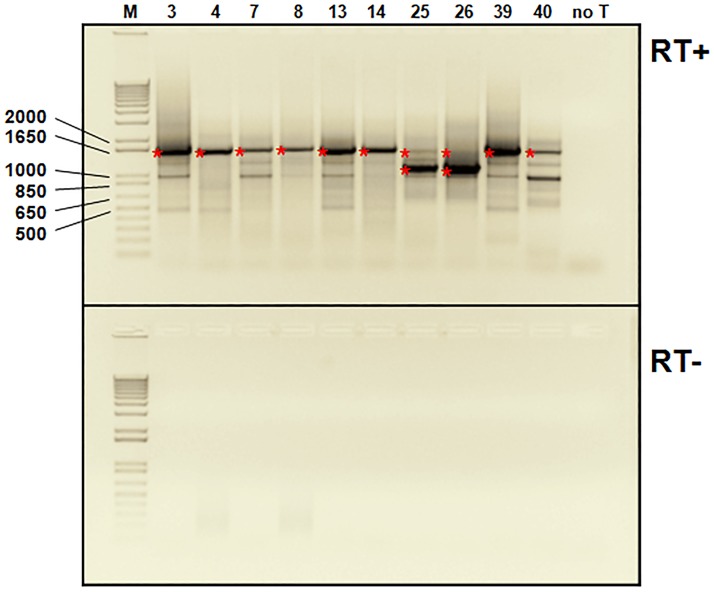
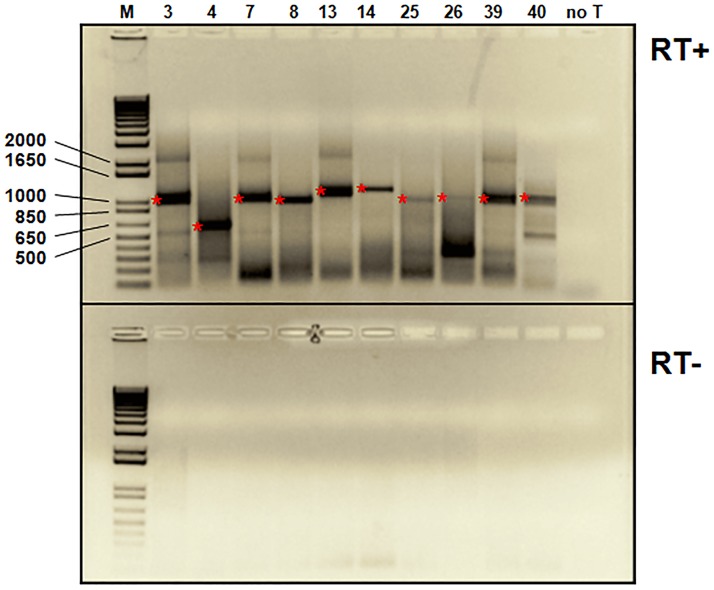
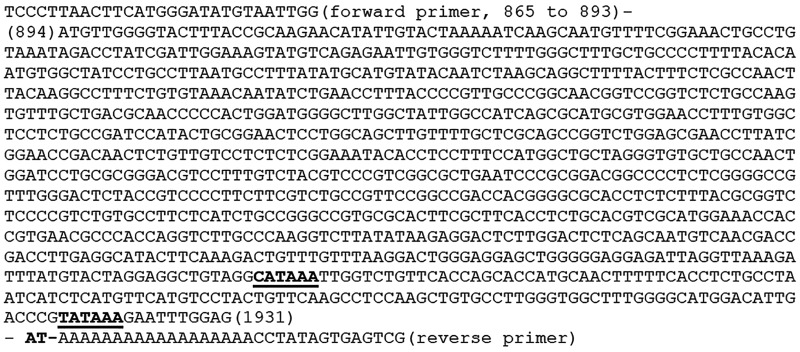
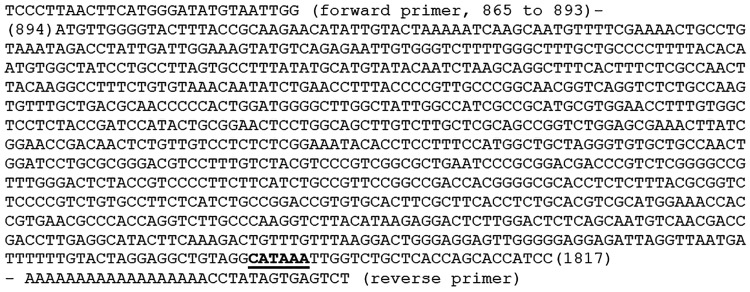
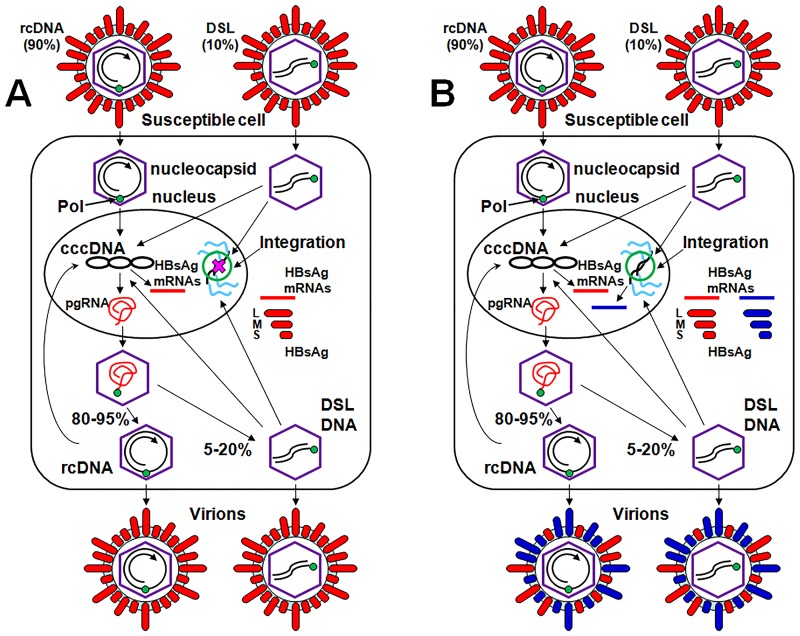
Five matching sets of nonmalignant liver tissues and hepatocellular carcinoma (HCC) samples from individuals chronically infected with hepatitis B virus (HBV) were examined. The HBV genomic sequences were determined by using overlapping PCR amplicons covering the entire viral genome. Four pairs of tissues were infected with HBV genotype C, while one pair was infected with HBV genotype B. HBV replication markers were found in all tissues. In the majority of HCC samples, the levels of pregenomic/precore RNA (pgRNA) and covalently closed circular DNA (cccDNA) were lower than those in liver tissue counterparts. Regardless of the presence of HBV replication markers, (i) integrant-derived HBV RNAs (id-RNAs) were found in all tissues by reverse transcription-PCR (RT-PCR) analysis and were considerably abundant or predominant in 6/10 tissue samples (2 liver and 4 HCC samples), (ii) RNAs that were polyadenylated using the cryptic HBV polyadenylation signal and therefore could be produced by HBV replication or derived from integrated HBV DNA were found in 5/10 samples (3 liver and 2 HCC samples) and were considerably abundant species in 3/10 tissues (2 livers and 1 HCC), and (iii) cccDNA-transcribed RNAs polyadenylated near position 1931 were not abundant in 7/10 tissues (2 liver and 5 HCC samples) and were predominant in only two liver samples. Subsequent RNA sequencing analysis of selected liver/HCC samples also showed relative abundance of id-RNAs in most of the examined tissues. Our findings suggesting that id-RNAs could represent a significant source of HBV envelope proteins, which is independent of viral replication, are discussed in the context of the possible contribution of id-RNAs to the HBV life cycle.IMPORTANCE The relative abundance of integrant-derived HBV RNAs (id-RNAs) in chronically infected tissues suggest that id-RNAs coding for the envelope proteins may facilitate the production of a considerable fraction of surface antigens (HBsAg) in infected cells bearing HBV integrants. If the same cells support HBV replication, then a significant fraction of assembled HBV virions could bear id-RNA-derived HBsAg as a major component of their envelopes. Therefore, the infectivity of these HBV virions and their ability to facilitate virus cell-to-cell spread could be determined mainly by the properties of id-RNA-derived envelope proteins and not by the properties of replication-derived HBsAg. These interpretations suggest that id-RNAs may play a role in the maintenance of chronic HBV infection and therefore contribute to the HBV life cycle. Furthermore, the production of HBsAg from id-RNAs independently of viral replication may explain at least in part why treatment with interferon or nucleos(t)ides in most cases fails to achieve a loss of serum HBsAg.

Keywords: HBV life cycle; chronic HBV infection; hepatitis B virus; integrant-derived viral RNAs.


Figures

FIG 1
FIG 1
PCR amplification of three overlapping DNA fragments covering the entire HBV genome. (A) Positions of the three PCR amplicons. The positions of the three overlapping PCR fragments (excluding the primers) are indicated. The rcDNA genome of HBV is shown as a reference. The HBV genome shown reflects the numbering of HBV genotypes B and C and has a length of 3,215 nt (79). The strands of the rcDNA are shown in blue. The minus strand is complete, and its 5′ end is covalently attached to the viral polymerase (shown as a green circle). The plus strand is incomplete, which is indicated with a dashed line. The positions of direct repeat 1 (DR1), DR2, as well as the RNA primer at the 5′ end of the plus strand are indicated. The PCR fragments are shown in the following colors: (i) gray for fragment F1, (ii) yellow for fragment F2, and (iii) red for fragment B. The positions of the primers are given in parentheses. For all tissues, fragment B (excluding the primers) covers the region between positions 267 and 1768 (inclusive). For all tissues with the exception of tissue 39, fragment F1 (excluding the primers) spans the region between positions 1673 and 2296. In the case of tissue 39, a version of fragment F1 covers the region between positions 1673 and 2377 (shown as F1′ in Table 1). Fragment F2 (for all tissues with the exception of tissues 39 and 40) covers the region between positions 2287 and 375 (through positions 3215/1). For tissues 39 and 40, F2 spans the region from position 2318 through 3215/1 to position 375 (shown as F2′ in Table 1). (B) Results of PCR assays amplifying fragments B, F1, and F2. Each panel represents the results for a single PCR assay. The amplified fragment is indicated at the right-hand side of each gel image. The tissues analyzed are indicated at the top. “no T” stands for the negative control that did not have the template for amplification. M indicates double-stranded DNA size markers (a 1-kb plus DNA ladder [Invitrogen] was used). The sizes of certain DNA markers are indicated. The main PCR products are marked with arrows. The expected size of fragment B is 1,545 nt. The expected size of fragment F1 for all tissues with the exception of tissue 39 is 665 nt. For tissue 39, the size of fragment F1 was expected to be 743 nt. The size of fragment F2 (for all tissues with the exception of tissues 39 and 40) is 1,344 nt. For tissues 39 and 40, the size of fragment F2 was 1,314 nt. All major PCR products that migrated in the areas of the predicted sizes were gel purified and cloned into the pCRII-TOPO vector for subsequent sequencing. In the middle gel image, the black asterisk indicates the PCR product of an unexpectedly larger size that was observed for tissue 13. It was also gel purified and analyzed. The red asterisk points to fragment F1 of tissue 40, which had to be divided into two fragments, M and N, for further analysis, because it appeared to bear mutations in the overlapping B/F1 region as well as an internal deletion. The overlap between fragments B and F2 (for all tissues) spanned the region between positions 267 and 375 (109 nt). The overlap between fragments B and F1 was 96 nt and spanned the region between positions 1673 and 1768. For the F1/F2 junction, the overlap was 10 nt (positions 2287 to 2296). For tissue 39, the F1/F2 junction was 60 nt (positions 2318 to 2377). For tissue 40, the junctions were 90 nt for the B/M junction (positions 1679 to 1768), 82 nt for the M/N junction (positions 2033 to 2114), and 60 nt for the N/F2 junction (positions 2318 to 2377). The amplification of fragments M and N is not shown.
FIG 2
FIG 2
Consensus sequence of the HBV DNA genome recovered from tissue 3 (nonmalignant liver). The consensus sequence was generated based on the eight complete HBV genomic sequences (eight sequences for each PCR fragment were used), which were assembled based on the degree of sequence identity within the overlapping areas of the PCR fragments. The consensus sequence is shown at the top. The positions in the HBV genomic sequence are shown on the right-hand side of the alignment. The identification number for a particular assembled genome sequence that has a nucleotide(s) that differs from the nucleotide(s) in the same position(s) in the consensus sequence is shown on the left side of the corresponding line of the alignment. The dots represent identical nucleotides, while nonidentical nucleotides are shown in small letters. “R” stands for purine (A or G), “Y” stands for pyrimidine (C or T), “K” stands for G or T, and “W” stands for A or T. Tissue 3 was infected with an HBV genome of genotype C, which was 3,215 nucleotides long.
FIG 2
FIG 2
Consensus sequence of the HBV DNA genome recovered from tissue 3 (nonmalignant liver). The consensus sequence was generated based on the eight complete HBV genomic sequences (eight sequences for each PCR fragment were used), which were assembled based on the degree of sequence identity within the overlapping areas of the PCR fragments. The consensus sequence is shown at the top. The positions in the HBV genomic sequence are shown on the right-hand side of the alignment. The identification number for a particular assembled genome sequence that has a nucleotide(s) that differs from the nucleotide(s) in the same position(s) in the consensus sequence is shown on the left side of the corresponding line of the alignment. The dots represent identical nucleotides, while nonidentical nucleotides are shown in small letters. “R” stands for purine (A or G), “Y” stands for pyrimidine (C or T), “K” stands for G or T, and “W” stands for A or T. Tissue 3 was infected with an HBV genome of genotype C, which was 3,215 nucleotides long.
FIG 3
FIG 3
Consensus sequence of the HBV DNA genome recovered from tissue 4 (HCC). The consensus HBV genome sequence was generated as described in the legend to Fig. 2. The consensus is based on the eight assembled HBV sequences (eight sequences for each PCR fragment were used). The consensus sequence is shown at the top. The positions in the HBV genome are shown on the right side of the alignment. The identification number for a particular assembled genome sequence that has a nucleotide(s) that differs from the nucleotide(s) in the same position(s) in the consensus sequence is shown on the left side of the corresponding line of the alignment. The dots represent identical nucleotides, while nonidentical nucleotides are shown in small letters. “R” stands for purine (A or G), “Y” stands for pyrimidine (C or T), and “W” stands for A or T. Sequences 7 and 8 have the same 33-nt deletion spanning positions 24 to 56 (inclusive). The deletion is shown as a dashed line. Tissue 4 was infected with an HBV genome of genotype C (the total length is 3,215 nucleotides).
FIG 3
FIG 3
Consensus sequence of the HBV DNA genome recovered from tissue 4 (HCC). The consensus HBV genome sequence was generated as described in the legend to Fig. 2. The consensus is based on the eight assembled HBV sequences (eight sequences for each PCR fragment were used). The consensus sequence is shown at the top. The positions in the HBV genome are shown on the right side of the alignment. The identification number for a particular assembled genome sequence that has a nucleotide(s) that differs from the nucleotide(s) in the same position(s) in the consensus sequence is shown on the left side of the corresponding line of the alignment. The dots represent identical nucleotides, while nonidentical nucleotides are shown in small letters. “R” stands for purine (A or G), “Y” stands for pyrimidine (C or T), and “W” stands for A or T. Sequences 7 and 8 have the same 33-nt deletion spanning positions 24 to 56 (inclusive). The deletion is shown as a dashed line. Tissue 4 was infected with an HBV genome of genotype C (the total length is 3,215 nucleotides).
FIG 4
FIG 4
PCR strategy to amplify the entire lengths of HBV mRNAs coding for the large envelope protein (L). HBV mRNAs coding for the L envelope protein can be transcribed from cccDNA (i.e., produced by HBV replication) or derived from integrated HBV DNA. The strategy is expected to amplify mRNAs coding for L regardless of their origin. The cccDNA-derived HBV RNAs, id-RNAs, and positions of the primers are shown above the dashed green line. Only one set of the forward primers used to amplify the 3′-end region RNA sequences is shown, while all three sets of the forward primers used are described in Materials and Methods. Also indicated are the location of the ORF for the L envelope protein and the boundaries of the pre-S1, pre-S2, and S domains. The pregenomic/precore RNA (pgRNA) (∼3.5 kb), the mRNA for the L envelope protein (∼2.4 kb), mRNA for the M/S (middle/small) envelope proteins (∼2.1 kb), and mRNA for the X protein (∼0.8 kb) are shown as the major cccDNA-derived HBV RNAs. They all have the same 3′ end and are expected to be polyadenylated near position ∼1931 using the conventional viral poly(A) signal UAUAAA located at positions 1916 to 1921 (shown as a green rectangle on pgRNA). The id-RNAs coding for L are also shown. The main substrate for HBV integration is the double-stranded linear HBV genome (DSL). The DSL is presented in detail in Fig. 5. The L mRNA produced from such HBV integrant (and transcribed from the pre-S1 promoter) is expected to have 5′-end sequences identical to those of cccDNA-derived L mRNA. However, the 3′-end part is different. The HBV sequence is expected to end at or near position ∼1831 (corresponding to the right end of the DSL) (Fig. 5) (4, 15), and it will be joined to a host sequence (that is located next to the HBV-host junction at the integration site) of an unknown size (indicated in red). The id-RNAs are virus-host hybrids (20, 21, 24). They acquire their poly(A) tails using host poly(A) signals/sites that are located at an unknown distance away from the HBV-host junction (downstream of the right end of the integrant) (Fig. 5). cDNA synthesis and PCRs are described in detail in Materials and Methods. The entire L mRNA sequence was amplified by using two overlapping PCR amplicons (one for the 5′-end part and another for the 3′-end part). The 5′-end region was amplified by using nested PCR, while the 3′-end part was amplified by seminested PCR. For the 5′-end region, the outer amplicon employed primers spanning nt 2807 to 2836 and 1253 to 1274, while the inner amplicon used primers covering nt 2816 to 2843 and 1232 to 1251. The product of nested PCR spanning positions 2816 to 1251 (i.e., the 5′-end region product) is approximately 1,651 bp long (shown as a purple line below the dashed green line). This 5′-end region product can be produced only from replication-derived pgRNA, L mRNA, as well as integrant-derived L mRNA (that is transcribed from the pre-S1 promoter) (Fig. 5). As can be deduced from Fig. 5, there is also some possibility that HBV RNA sequences could be transcribed from the integrated DSL by using the host promoter that could be located upstream of the left-hand side of the integrated DSL. In this case, the resulting RNA will bear a 5′ UTR of an unknown length, because the location of the upstream cellular promoter relative to the integrated DSL is unknown. In addition, the site(s) at which such RNAs could be polyadenylated, and whether these RNAs could facilitate the translation of L or other envelope proteins, remains to be determined. The 3′-end region amplicon utilized a VN LNA oligo(dT) primer (see Materials and Methods) and a primer that spans positions 754 to 774 in the S domain for the first round of PCR, while for the second round of PCR, the same VN LNA oligo(dT) primer and a primer covering nt 865 to 893 (in the 3′ UTR of HBV) were used. The expected two types of final 3′-end region PCR products are shown below the dashed green line. The final 3′-end region PCR product related to HBV replication can be produced from pgRNA, L mRNA, and M/S mRNA. It will span positions ∼865 to 1931 and is expected to be about 1,102 nt long. The size of the final PCR product generated from id-RNAs is unknown, because the size of the host sequence at the 3′ end of id-RNAs remains unknown. It is expected to bear HBV sequences covering positions ∼865 to 1831 and, unlike replication-related PCR products, is not expected to bear the HBV region between nt ∼1831 and 1931 (as reported previously, the exact positions of the left end and right end of the integrated HBV DNA can vary [4, 15]). The cryptic HBV poly(A) signal CAUAAA (positions 1788 to 1793) (55, 56), which is located upstream of the above-mentioned conventional poly(A) signal, is also shown as a white rectangle on pgRNA.
FIG 5
FIG 5
The double-stranded linear HBV DNA genome is the main substrate for HBV DNA integration into host chromosomal DNA. (A) Features of the DSL. The schematic representation of the DSL is based on diagrams from two previously published studies that analyzed HBV-host junctions at the left- and right-hand sides of HBV DNA integrants (4, 15). The DSL is shown as a solid black line. Numbering is displayed for HBV serotype AYW. The DSL left-hand side is expected to be located at or near position ∼1820, while the right-hand side is expected to be located at or near position ∼1831 (4, 15). The exact positions of the left-hand side and the right-hand side of the integrated HBV DNA can vary (4, 15). At the left and right ends, the integrated DSL is joined to the host DNA sequences. Some ORFs are disrupted in the DSL. The disrupted ORFs for the precore/core and X proteins are indicated. The positions of direct repeat 1 (DR1) and the posttranscriptional regulatory element (PRE) that is needed for mRNA export to the cytoplasm for subsequent translation (1, 9) are indicated. In the unaltered DSL, the L ORF is not disrupted, and promoters for both the L mRNA and the M/S mRNA are in the correct positions and are expected to be functional. Thus, transcription of the L mRNA or M/S mRNA can be initiated from the HBV promoters, and the synthesis of these mRNAs can be completed. However, the conventional viral poly(A) signal/site in the DSL is located upstream of the L ORF. Therefore, transcription (initiated from the L or M/S promoter) is expected to pass the virus-host junction (at the right end of the DSL) and continue into the host sequences until the RNA acquires the poly(A) tail using the host poly(A) addition signal/site [if the viral cryptic poly(A) signal (Fig. 4) is not used]. (B) mRNA for the L envelope protein that can be transcribed from the integrated DSL independently of HBV replication. This RNA (transcribed from the viral pre-S1 promoter) is a hybrid RNA that bears 5′-CAP, the 5′ UTR of HBV, the ORF for L, and the 3′ UTR of HBV, which is expected to end at or around position ∼1831. Unlike replication-derived RNA, this id-RNA also contains a host insert of an unknown length [immediately next to the poly(A) tail] that is expected to bear the host poly(A) signal and part of the poly(A) addition site that remains after cleavage during the processing of the mRNA [if the conventional host poly(A) signal/site is used] and the poly(A) tail. Pol, polymerase.
FIG 6
FIG 6
PCR amplification of the 5′-end region sequences of HBV RNAs that accumulated in matching liver/HCC tissues. (Top) Results of the RT-PCR procedure conducted in the presence of reverse transcriptase (RT+). (Bottom) Results obtained in control experiments in the absence of reverse transcriptase (RT−). “no T” stands for the negative control that did not have the template for amplification. The lanes marked M contained the size markers of double-stranded DNA (a 1-kb plus DNA ladder [Invitrogen] was used). The tissue numbers are shown at the top. The products marked with asterisks were gel purified, cloned, and sequenced.
FIG 7
FIG 7
PCR amplification of the 3′-end region sequences of HBV RNAs that accumulated in matching liver/HCC tissues. In the case of the PCR analysis presented here, the expected size of PCR products amplified from cccDNA-derived RNAs was 1,102 nt (Fig. 4). (Top) Results of RT-PCR conducted in the presence of reverse transcriptase (RT+). (Bottom) Results obtained in the absence of reverse transcriptase (controls) (RT−). “no T” stands for the negative control that did not have the template for amplification. The lanes marked M contain the size markers of double-stranded DNA (a 1-kb plus DNA ladder [Invitrogen] was used). The numbers of the tissues analyzed are shown at the top. The products marked with asterisks were gel purified, cloned, and sequenced.
FIG 8
FIG 8
Example of a 3′-end region sequence of cccDNA-derived HBV RNA. The sequence (T3_1) recovered from tissue 3 is shown. The PCR product contains an HBV sequence spanning positions 894 to 1931. Polyadenylation occurred via the conventional HBV poly(A) signal TATAAA (shown in the DNA sequence in boldface type and with underlining). Also shown are the cryptic HBV poly(A) signal CATAAA (shown in the DNA sequence in boldface type and with underlining) (55, 56) and the sequences of the 3′-end and 5′-end boundaries of the obtained PCR product, which match the sequences of the forward and reverse primers. The AT dinucleotide immediately downstream of position 1931 likely reflects the use of a VN or VNN sequence that was placed at the 3′ end of the reverse primer or the primer used for cDNA synthesis, respectively.
FIG 9
FIG 9
Example of a 3′-end region sequence of HBV RNA that was polyadenylated using the cryptic HBV polyadenylation signal. The sequence (T3_7) recovered from tissue 3 is shown. The PCR product contains an HBV sequence spanning positions 894 to 1817. Polyadenylation occurred using the cryptic HBV poly(A) signal CATAAA (shown in the DNA sequence in boldface type and with underlining) (55, 56). Also shown are the sequences of the 3′-end and 5′-end boundaries of the PCR product that match the sequences of the forward and reverse primers.
FIG 10
FIG 10
Example of a 3′-end region sequence of the HBV id-RNA. The sequence (T7_3) recovered from tissue 7 is shown. The PCR product contains an HBV sequence spanning positions 894 to 1822, which is joined to a fragment of a human sequence. The identity of the human sequence in this id-RNA is shown in parentheses. The TT dinucleotide (boldface type and underlined) near position 1822 could belong to either the HBV sequence or the human sequence. Polyadenylation occurred by using the host poly(A) signal. At least two potential poly(A) signals were identified in the human sequence insert (shown in the DNA sequence in boldface type and with underlining). The signal located closer to the 3′ end of the id-RNA was likely used for polyadenylation. Also shown are the cryptic HBV poly(A) signal CATAAA (boldface type and underlined) (55, 56) and the sequences of the PCR product 3′-end and 5′-end boundaries matching the sequences of the forward and reverse primers. The T nucleotide (boldface type and underlined) immediately downstream of the host insert likely reflects the 3′-end version of the VN sequence that was placed at the 3′ end of the reverse primer.
FIG 11
FIG 11
Selective PCR amplification of the 3′-end regions of cccDNA-derived HBV RNAs present in liver/HCC tissues. This PCR assay exclusively amplifies cccDNA-derived RNAs. (Top) Results of RT-PCR amplification performed in the presence of reverse transcriptase (RT+). (Bottom) RT-PCR results obtained in the absence of reverse transcriptase (RT−) (controls). “no T” stands for the negative control that did not have the template for amplification. The lanes marked M contain double-stranded DNA size markers (a 1-kb plus DNA ladder [Fermentas] was used). The tissues assayed are shown at the top of the gel image. The arrow marks products of the expected size. For tissues 3, 4, 8, and 13, the PCR products of the expected size were gel purified, cloned, and sequenced, which confirmed the presence of the expected HBV sequences. Other PCR products were not analyzed further.
FIG 12
FIG 12
Example of a complete sequence match in the overlap area between the 3′-end and 5′-end regions of HBV RNA sequences amplified by two different PCR strategies. The alignment represents an example of a complete sequence match in the overlap area (in this case, positions 1074 to 1231 of the HBV sequence) and includes three 3′-end region id-RNA sequences (14_2, 14_4, and 14_8) and six 5′-end region RNA sequences (5_9_4, 5_9_5, 5_9_6, 5_9_11, 5_9_13, and 5_9_18) recovered from tissue 14. All three 3′-end region id-RNA sequences were identical in the overlap area. In addition, each of the 3′-end region id-RNA sequences had a 100% match with the above-mentioned six 5′-end region sequences (identical nucleotides are shown as dots). The identification numbers of the sequences are shown on the left-hand side of the alignment. The finding of a complete sequence match between 3′-end and 5′-end region sequences in the overlap area for the id-RNAs is consistent with the notion that functional HBsAg could be translated from these id-RNAs.
FIG 13
FIG 13
Potential contribution of id-RNAs to the life cycle of HBV. The model of the HBV life cycle is based on the one that was reported previously by Mason et al. (13). Briefly, about 90% of HBV virions contain rcDNA inside the nucleocapsids, while the other ∼10% bear the DSL. The virions enter susceptible cells via a specific receptor, sodium taurocholate-cotransporting polypeptide (NTCP) (10). Inside the cell, uncoating takes place, and virions lose the envelope that consists of three HBV envelope proteins, L, M, and S (shown as bars), and some lipid. DNA synthesis resumes within the nucleocapsid, and the plus DNA strand is completed. Viral polymerase is shown as a green circle. After nucleocapsid entry into the nucleus and subsequent disassembly, the rcDNA loses the polymerase and is converted into cccDNA, which is the template for the synthesis of all HBV RNAs produced by viral replication. The newly synthesized pgRNA forms a complex with the polymerase and is assembled into the nucleocapsid, after which reverse transcription starts inside the capsid. In 80 to 95% of cases, the end product of reverse transcription is rcDNA, while in 5 to 20% of cases (if, during plus DNA strand synthesis, the RNA primer is not translocated and in situ priming occurs), the final product of reverse transcription is the DSL. Both encapsidated rcDNA and the DSL can be enveloped and released as HBV virions or can be recycled into the nucleus to replenish the cccDNA pool. In addition, the DSL is the main substrate for HBV integration, which occurs randomly and is facilitated by cellular DNA repair enzymes. As shown in Fig. 5, the integrated DSL, independently of HBV replication, can serve as the template for the synthesis of id-RNAs coding for the viral envelope proteins. For simplicity, the mRNAs for HBsAg are shown as a single horizontal line. The red line represents replication-derived mRNAs for HBsAg, while the blue line indicates the id-RNAs coding for HBsAg. (A) Shown is an HBV-infected cell that supports HBV but does not produce id-RNAs. In this case, either the cell does not contain an HBV integrant or the integrant is altered (i.e., can bear a mutation[s], deletion[s], or rearrangement[s], etc.), and therefore id-RNAs are not produced, which is indicated by a purple cross. In this case, only cccDNA-derived mRNAs for HBsAg are produced, and HBV replication is the only source of HBsAg. (B) Case where mRNAs for HBsAg are produced by virus replication and are also derived from the integrated HBV DNA. In this situation, the envelope proteins are produced from cccDNA-derived RNAs and from id-RNAs. As our data suggest, when id-RNAs represent a relatively abundant/predominant fraction of mRNAs for HBsAg, the newly made HBV virions will contain id-RNA-derived HBsAg as a major component of their outer envelopes, which further suggests that the properties of these virions will be determined largely by the properties of the id-RNA-derived envelope proteins and not by the properties of HBsAg produced by HBV replication. Thus, id-RNA-derived HBsAg can determine the ability of HBV virions to support virus spread and superinfection, which in turn may affect the ability of the virus to maintain a state of chronic infection. Recently, we showed that limited hepadnavirus spread and superinfection continue during chronic infection in vivo and thus may represent the determinants of the maintenance of the chronicity state (28). In addition, id-RNA-derived HBsAg, if abundant, could make a significant contribution to HBsAg-associated liver pathogenesis independently of HBV replication. The above-described conclusions suggest that id-RNAs may have a considerable contribution to the HBV life cycle and HBV-related pathogenesis.

Similar articles

Cited by

References

    1. Seeger C, Mason WS. 2015. Molecular biology of hepatitis B virus infection. Virology 479–480:672–686. doi: 10.1016/j.virol.2015.02.031. - DOI - PMC - PubMed
    1. Lupberger J, Hildt E. 2007. Hepatitis B virus-induced oncogenesis. World J Gastroenterol 13:74–81. doi: 10.3748/wjg.v13.i1.74. - DOI - PMC - PubMed
    1. Zoulim F, Mason WS. 2012. Reasons to consider earlier treatment of chronic HBV infection. Gut 61:333–336. doi: 10.1136/gutjnl-2011-300937. - DOI - PubMed
    1. Mason WS, Low HC, Xu C, Aldrich CE, Scougall CA, Grosse A, Clouston A, Chavez D, Litwin S, Peri S, Jilbert AR, Lanford RE. 2009. Detection of clonally expanded hepatocytes in chimpanzees with chronic hepatitis B virus infection. J Virol 83:8396–8408. doi: 10.1128/JVI.00700-09. - DOI - PMC - PubMed
    1. Arbuthnot P, Kew M. 2001. Hepatitis B virus and hepatocellular carcinoma. Int J Exp Pathol 82:77–100. doi: 10.1111/j.1365-2613.2001.iep178.x. - DOI - PMC - PubMed

Publication types

MeSH terms

LinkOut - more resources