. 2018 Apr 27;92(10):e01901-17.
doi: 10.1128/JVI.01901-17. Print 2018 May 15.

Alpha/Beta Interferon (IFN-α/β) Signaling in Astrocytes Mediates Protection against Viral Encephalomyelitis and Regulates IFN-γ-Dependent Responses

Affiliations

Alpha/Beta Interferon (IFN-α/β) Signaling in Astrocytes Mediates Protection against Viral Encephalomyelitis and Regulates IFN-γ-Dependent Responses

Mihyun Hwang et al. J Virol. .

Abstract

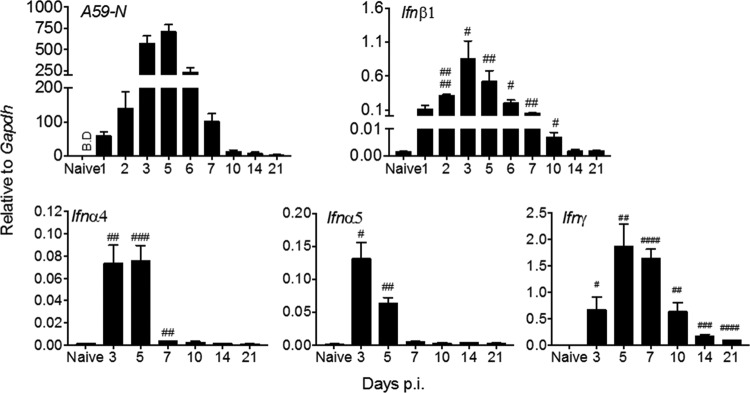
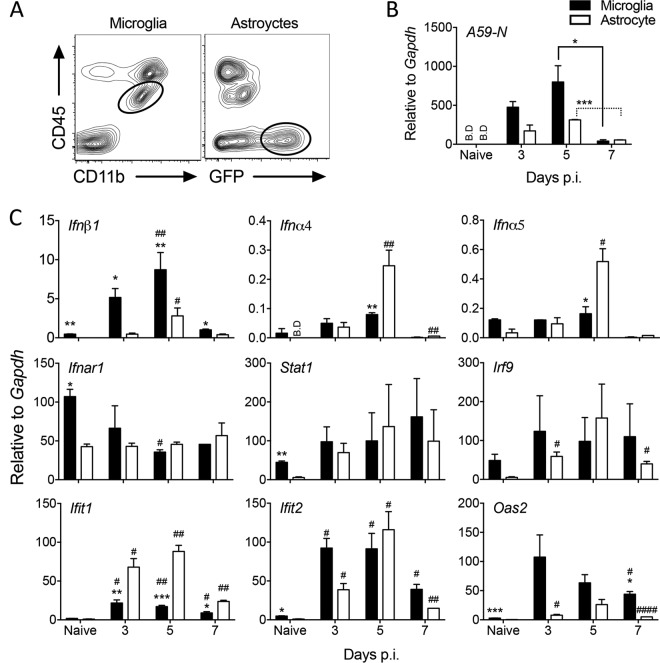
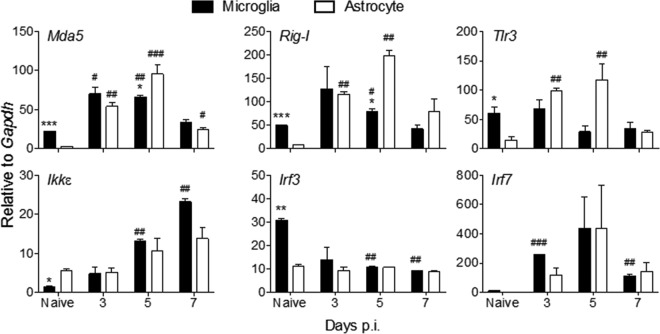
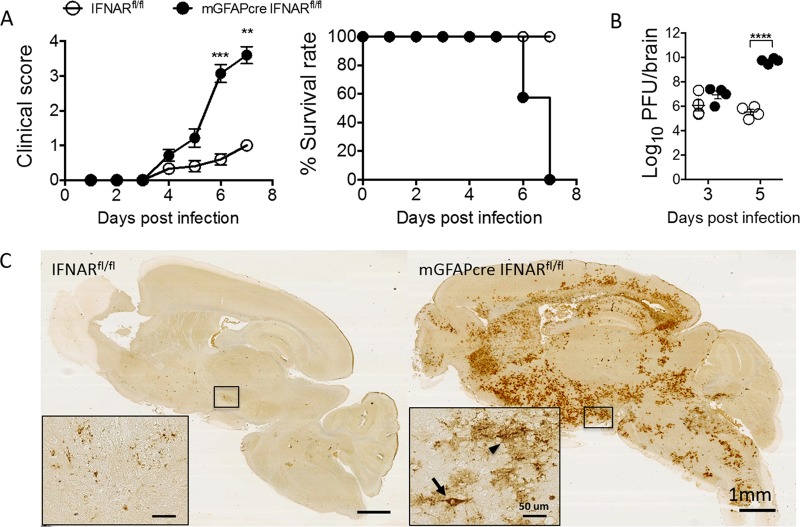
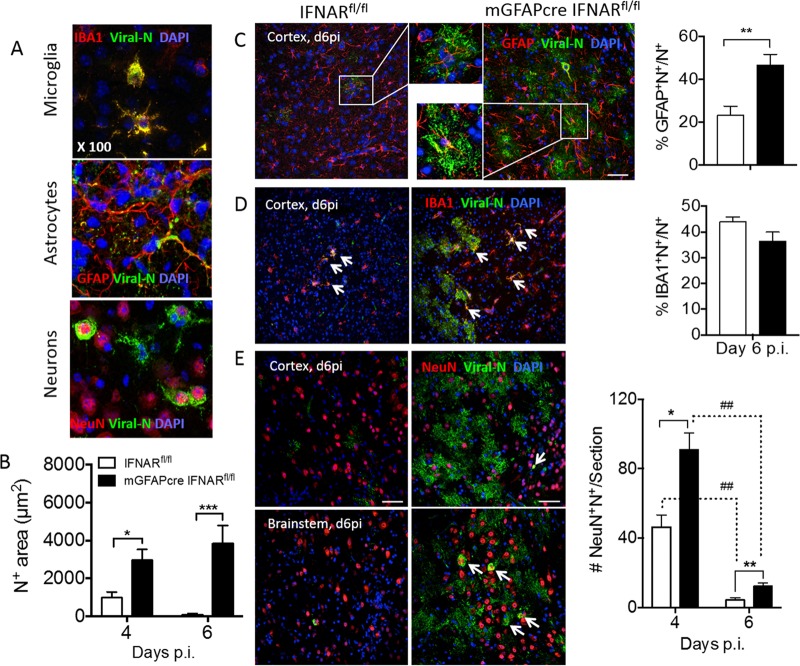
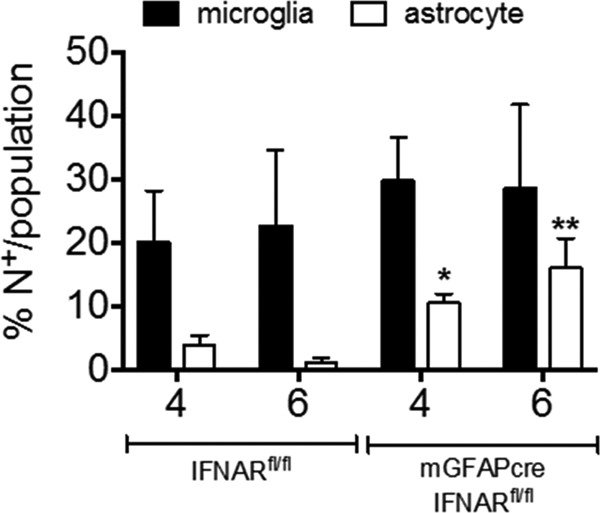
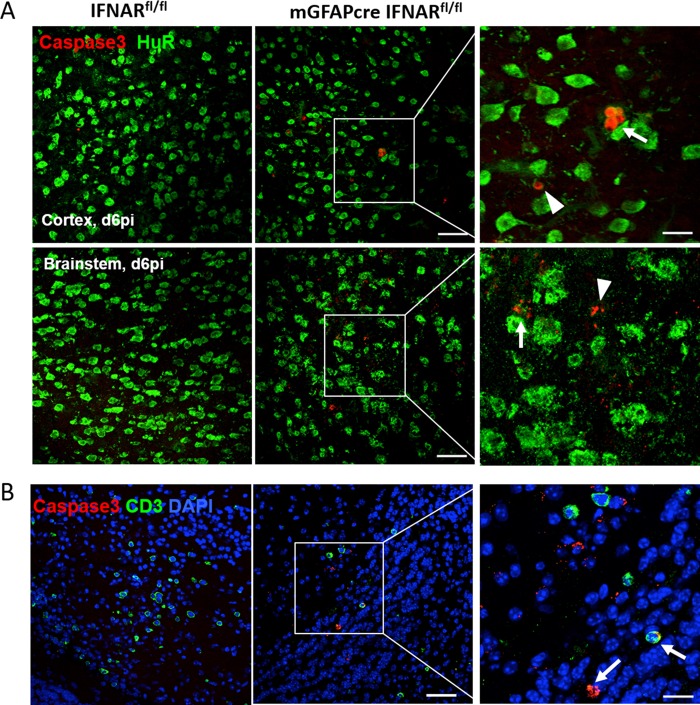
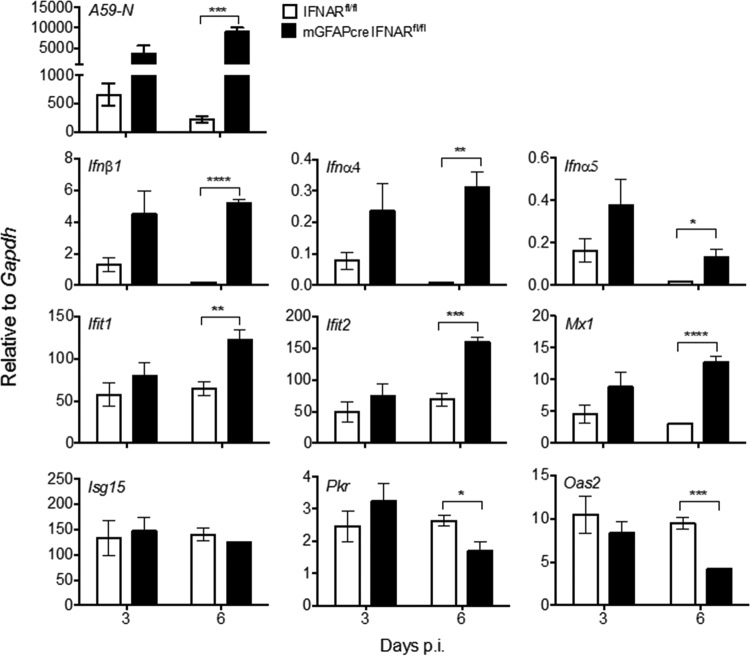
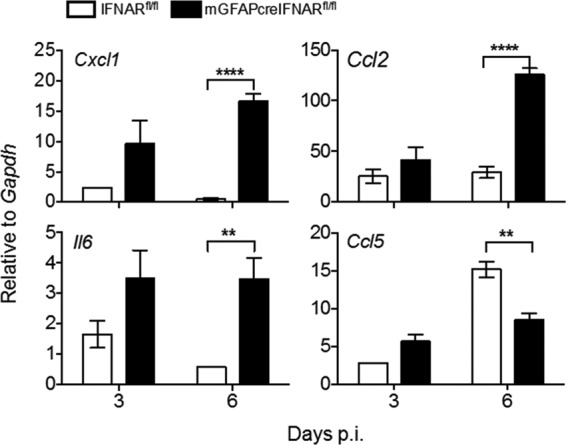
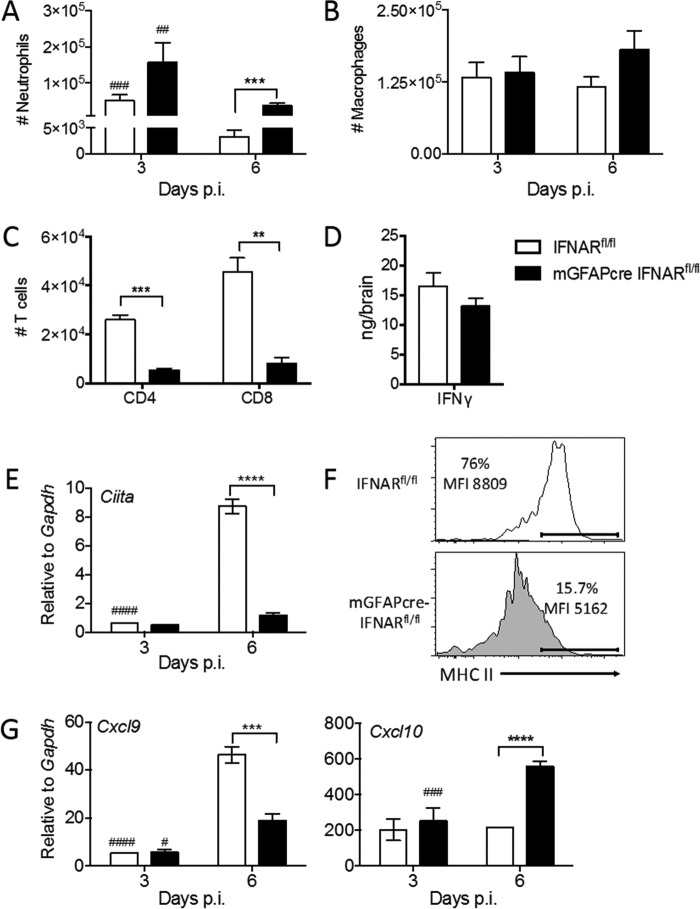
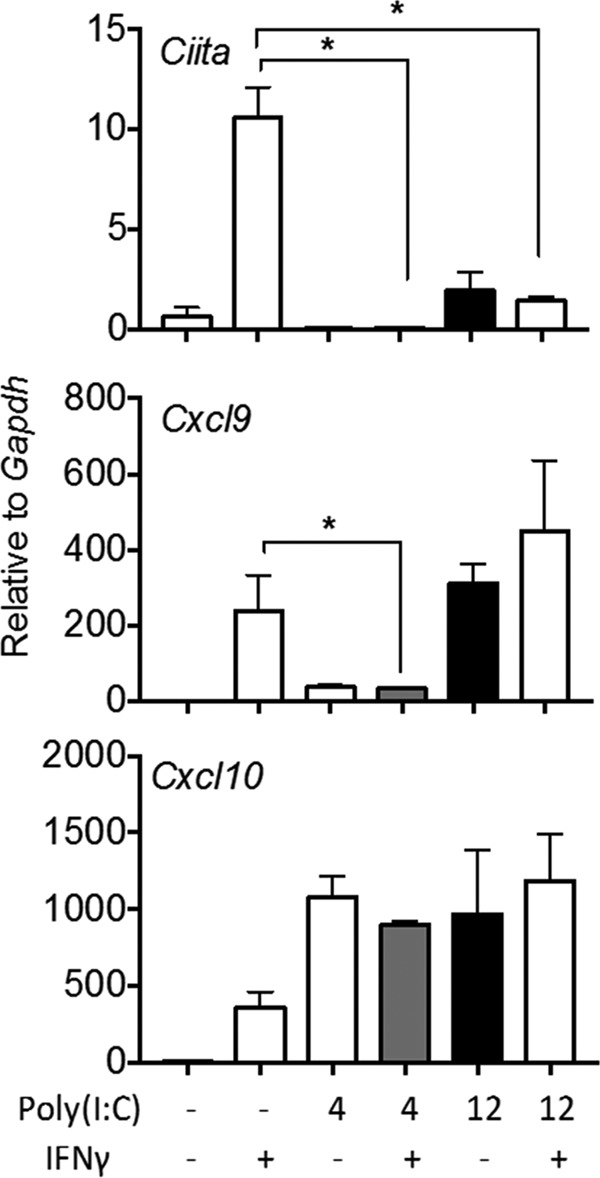
The contribution of distinct central nervous system (CNS) resident cells to protective alpha/beta interferon (IFN-α/β) function following viral infections is poorly understood. Based on numerous immune regulatory functions of astrocytes, we evaluated the contribution of astrocyte IFN-α/β signaling toward protection against the nonlethal glia- and neuronotropic mouse hepatitis virus (MHV) strain A59. Analysis of gene expression associated with IFN-α/β function, e.g., pattern recognition receptors (PRRs) and interferon-stimulated genes (ISGs), revealed lower basal mRNA levels in brain-derived astrocytes than in microglia. Although astrocytes poorly induced Ifnβ mRNA following infection, they upregulated various mRNAs in the IFN-α/β pathway to a higher extent than microglia, supporting effective IFN-α/β responsiveness. Ablation of the IFN-α/β receptor (IFNAR) in astrocytes using mGFAPcre IFNARfl/fl mice resulted in severe encephalomyelitis and mortality, coincident with uncontrolled virus replication. Further, virus spread was not restricted to astrocytes but also affected microglia and neurons, despite increased and sustained Ifnα/β and ISG mRNA levels within the CNS. IFN-γ, a crucial mediator for MHV control, was not impaired in infected mGFAPcre IFNARfl/fl mice despite reduced T cell CNS infiltration. Unexpectedly however, poor induction of IFN-γ-dependent major histocompatibility complex (MHC) class II expression on microglia supported that defective IFN-γ signaling contributes to uncontrolled virus replication. A link between sustained elevated IFN-α/β and impaired responsiveness to IFN-γ supports the novel concept that temporally limited early IFN-α/β responses are critical for effective antiviral IFN-γ function. Overall, our results imply that IFN-α/β signaling in astrocytes is not only critical in limiting early CNS viral spread but also promotes protective antiviral IFN-γ function.IMPORTANCE An antiviral state established by IFN-α/β contains initial viral spread as adaptive immunity develops. While it is apparent that the CNS lacks professional IFN-α/β producers and that resident cells have distinct abilities to elicit innate IFN-α/β responses, protective interactions between inducer and responder cells require further investigation. Infection with a glia- and neuronotropic coronavirus demonstrates that astrocytes mount a delayed but more robust response to infection than microglia, despite their lower basal mRNA levels of IFN-α/β-inducing components. Lethal, uncontrolled viral dissemination following ablation of astrocyte IFN-α/β signaling revealed the importance of IFN-α/β responses in a single cell type for protection. Sustained global IFN-α/β expression associated with uncontrolled virus did not suffice to protect neurons and further impaired responsiveness to protective IFN-γ. The results support astrocytes as critical contributors to innate immunity and the concept that limited IFN-α/β responses are critical for effective subsequent antiviral IFN-γ function.

Keywords: CNS; IFN-α; IFN-β; IFNAR; MHV; astrocytes.


Figures

FIG 1
FIG 1
Kinetics of viral replication and induction of type I and type II IFN transcripts in the brain following MHV A59 infection. Brains from naive and infected C57BL/6 mice were harvested at indicated times p.i. and analyzed for viral nucleocapsid protein (A59-N), Ifnβ1, Ifnα4, Ifnα5, and Ifnγ mRNAs by reverse transcription-PCR (RT-PCR). Data are the means ± standard errors of the means (SEM) for n = 9 to 12 mice per time point from three independent experiments, each comprising 3 or 4 mice per time point, and were analyzed by the unpaired two-tailed Student t test and two-way ANOVA. #, significance compared to naive mice: #, P < 0.05; ##, P < 0.01; ###, P < 0.001; ####, P < 0.0001. B.D, below detection.
FIG 2
FIG 2
Astrocyte-mediated induction of and responsiveness to IFN-α/β compared to those for microglia. Microglia and astrocytes were isolated by FACS from brains of naive or infected GFAP-GFP mice (n = 5 or 6) at the indicated times p.i. based on CD45int CD11b+ and CD45 GFAP+, respectively. (A) Representative contour plots show the gating strategy at day 7 p.i. for microglia and astrocytes. Both plots are from total live cells. (B and C) Microglia and astrocytes were analyzed for transcripts of A59-N, Ifnα4, Ifnα5, Ifnβ1, Ifnar1, signaling components (Stat1 and Irf9), and select ISGs (Ifit1, Ifit2, and Oas2) by RT-PCR. Data represent the means ± SEM from two experiments, each comprising 5 or 6 pooled brains per time point, and were analyzed by the unpaired two-tailed Student t test and two-way ANOVA. *, significance between microglia and astrocytes; #, significance compared to each respective naive population: * and #, P < 0.05; ** and ##, P < 0.01; *** and ###, P < 0.001; ####, P < 0.0001. BD, below detection. In panel B, asterisks indicate significance between days 5 and 7 p.i. in the same cell type.
FIG 3
FIG 3
Astrocytes rapidly induce viral RNA-sensing PRRs following MHV A59 infection. Microglia and astrocytes were isolated by FACS from brains of naive or MHV A59-infected GFAP-GFP mice as indicated in Fig. 2 and analyzed for transcripts encoding RNA-sensing PRRs (Mda5, Rig-I, and Tlr3), kinases associated with IFN-α/β induction (Ikkε), and transcription factors (Irf3, Irf7) by RT-PCR. Data represent the means ± SEM from two experiments, each comprising 5 or 6 pooled brains per time point, and were analyzed by the unpaired two-tailed Student t test and two-way ANOVA. *, significance between microglia and astrocytes; #, significance compared to each respective naive population: * and #, P < 0.05; ** and ##, P < 0.01; *** and ###, P < 0.001.
FIG 4
FIG 4
IFNAR signaling in astrocytes mediates protection against viral encephalomyelitis. (A) IFNARfl/fl (n = 12) and mGFAPcre IFNARfl/fl (n = 14) mice infected with MHV A59 were monitored for disease progression as described in Materials and Methods and for survival rate. (B) Virus titers in brain supernatants were quantified by plaque assay (n = 4/group/time point). Titers are from one experiment representative of two independent experiments. Data for panels A and B were analyzed by the unpaired two-tailed Student t test. Asterisks indicate significance between IFNARfl/fl and mGFAPcre IFNARfl/fl mice: **, P < 0.01; ***, P < 0.001; ****, P < 0.0001. (C) Representative images of viral N protein distribution in brains from both mouse groups at day 6 p.i. detected by immunoperoxidase staining using MAb J3.3 (red chromogen; hematoxylin counterstain). Scale bars, 1 mm. Insets show the infected area or cells at higher magnifications. The arrow indicates typical neuronal morphology, and the arrowhead indicates glial morphology. Scale bars, 50 μm.
FIG 5
FIG 5
IFNAR abrogation in astrocytes results in uncontrolled virus dissemination in astrocytes and to a lesser extent in neurons and microglia. (A) Representative staining of viral N protein in various CNS cell types was determined using anti-J3.3 MAb in combination with anti-GFAP, -IBA1, or -NeuN MAb as markers for astrocytes, microglia, and neurons, respectively, and DAPI to identify nuclei. (B) Quantification of J3.3-positive area (N+) per field of view (μm2) in brains of IFNARfl/fl and mGFAPcre IFNARfl/fl mice at days 4 and 6 p.i. (C and D) Representative staining of viral N protein in astrocytes and microglia in brain cortex of both mouse groups at day 6 p.i. Bar graphs show the proportion of N+ GFAP+ or N+ IBA1+ per total N+ area, respectively. Insets show infected astrocytes at higher magnification and arrows indicate infected microglia. (E) Representative staining of viral N protein in neurons in brain cortex and brain stem at days 4 and 6 p.i. The bar graph shows average numbers of virus-infected neurons per brain section from 2 or 3 whole brain sections per mouse (n = 3 mice). Arrows indicate virus-infected neurons. Scale bar, 50 μm. (C to E) Left and right panels indicate IFNARfl/fl and mGFAPcre IFNARfl/fl mice, respectively. The data in panels B and C represent the means ± SEM from 6 or 7 fields in 2 or 3 slides from 3 mice per group and were analyzed by the unpaired two-tailed Student t test and two-way ANOVA. *, significance between IFNARfl/fl and mGFAPcre IFNARfl/fl mice; #, significance between days 4 and 6 p.i. in the same group: *, P < 0.05; ** and ##, P < 0.01; ***, P < 0.001.
FIG 6
FIG 6
IFNAR abrogation on astrocytes predisposes astrocytes to infection over microglia. Bar graphs show the proportion of N+ GFAP+/GFAP+ or N+ IBA1+/IBA1+ per field in IFNARfl/fl (left) and mGFAPcre IFNARfl/fl (right) mice. Data represent the means ± SEM from 3 fields in 2 or 3 slides from 3 mice per group and were analyzed by the unpaired two-tailed Student t test. Asterisks indicate significance between IFNARfl/fl and mGFAPcre IFNARfl/fl mice, comparing the same cell populations: *, P < 0.05; **, P < 0.01.
FIG 7
FIG 7
IFNAR abrogation on astrocytes enhances apoptosis of neurons and CD3+ cells in the CNS following infection. (A) Representative staining of apoptosis (anti-caspase 3) of neurons (anti-HuR) in brain cortex and brain stem at day 6 p.i. Arrows indicate caspase 3+ neurons, and arrowheads indicate nonneuronal caspase 3+ cells. (B) Apoptosis of T cells (anti-CD3) in mGFAPcre IFNARfl/fl mice. Arrows indicate caspase 3+ CD3+ cells. Scale bars, 50 μm and 20 μm at low and high magnifications, respectively.
FIG 8
FIG 8
IFNAR abrogation in astrocytes results in uncontrolled viral replication and altered CNS expressions of IFN-α/β and ISGs. Brains from MHV A59-infected IFNARfl/fl and mGFAPcre IFNARfl/fl mice were analyzed for A59-N, Ifnα4, Ifnα5, Ifnβ1, and ISG (Ifit1, Ifit2, Mx1, Isg15, Oas2, and Pkr) mRNA levels by quantitative RT-PCR. Data represent the means ± SEM for n = 4 mice per time point from one experiment representative of two independent experiments and were analyzed by the unpaired two-tailed Student t test. Asterisks indicate significance between IFNARfl/fl and mGFAPcre IFNARfl/fl mice: *, P < 0.05; **, P < 0.01; ***, P < 0.001; ****, P < 0.0001.
FIG 9
FIG 9
Abrogated IFNAR signaling in astrocytes leads to increased expression of proinflammatory factors. Brains from MHV A59-infected IFNARfl/fl and mGFAPcre IFNARfl/fl were analyzed for Cxcl1, Ccl2, Ccl5, and Il6 mRNA levels by quantitative RT-PCR. Data represent the means ± SEM for n = 4 mice per time point from one experiment representative of two independent experiments and were analyzed by the unpaired two-tailed Student t test. Asterisks indicate significance between IFNARfl/fl and mGFAPcre IFNARfl/fl mice: **, P < 0.01; ****, P < 0.0001.
FIG 10
FIG 10
Abrogated IFNAR signaling in astrocytes is associated with altered leukocyte accumulation and impaired IFN-γ signaling in microglia. (A to C) Numbers of infiltrated neutrophils (A), macrophages (B), and CD4 and CD8 T cells (C) within brains of infected IFNARfl/fl and mGFAPcre IFNARfl/fl mice determined by flow cytometry at the indicated time points. (D) IFN-γ protein in brain supernatants measured by ELISA. (E) Ciita mRNA levels in brains determined by quantitative RT-PCR at days 3 and 6 p.i. (F) MHC class II expression (percentages and mean fluorescence intensity [MFI]) on microglia in brains of both mouse groups determined by flow cytometry at day 6 p.i. (G) Cxcl9 and Cxcl10 mRNA levels in brains measured by quantitative RT-PCR. Data represent the means ± SEM from three experiments (n = 9 to 12 per group and time point) and were analyzed by the unpaired two-tailed Student t test and two-way ANOVA. *, significance between IFNARfl/fl and mGFAPcre IFNARfl/fl mice; #, significance between days 3 and 6 p.i. in the same group: #, P < 0.05; ** and ##, P < 0.01; *** and ###, P < 0.001; **** and ####, P < 0.0001.
FIG 11
FIG 11
Poly(I·C) pretreatment impairs IFN-γ signaling in macrophages. Cultured BMDM were either treated with IFN-γ only (50 ng/ml) for 18 h or pretreated with poly(I·C) (5 μg/ml) for 4 or 12 h prior to treatment with IFN-γ for 18 h. Ciita, Cxcl9, and Cxcl10 mRNA levels were determined by quantitative real-time PCR in control and treated cultures as indicated. Data represent the means ± SEM from three independent experiments. *, P < 0.05 compared to IFN-γ-only treatment.

Similar articles

Cited by

References

    1. Swanson PA II, McGavern DB. 2015. Viral diseases of the central nervous system. Curr Opin Virol 11:44–54. doi:10.1016/j.coviro.2014.12.009. - DOI - PMC - PubMed
    1. Ivashkiv LB, Donlin LT. 2014. Regulation of type I interferon responses. Nat Rev Immunol 14:36–49. doi:10.1038/nri3581. - DOI - PMC - PubMed
    1. Sorgeloos F, Kreit M, Hermant P, Lardinois C, Michiels T. 2013. Antiviral type I and type III interferon responses in the central nervous system. Viruses 5:834–857. doi:10.3390/v5030834. - DOI - PMC - PubMed
    1. Crouse J, Kalinke U, Oxenius A. 2015. Regulation of antiviral T cell responses by type I interferons. Nat Rev Immunol 15:231–242. doi:10.1038/nri3806. - DOI - PubMed
    1. Paul S, Ricour C, Sommereyns C, Sorgeloos F, Michiels T. 2007. Type I interferon response in the central nervous system. Biochimie 89:770–778. doi:10.1016/j.biochi.2007.02.009. - DOI - PubMed

Publication types

MeSH terms