

Restoration and repair of Earth's damaged ecosystems
- PMID: 29491171
- PMCID: PMC5832705
- DOI: 10.1098/rspb.2017.2577
Restoration and repair of Earth's damaged ecosystems
Abstract
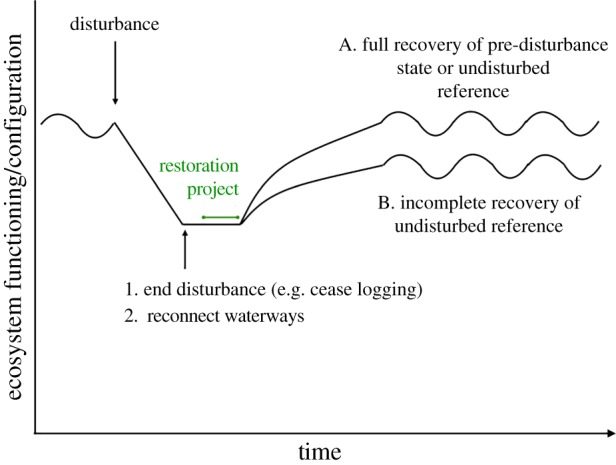
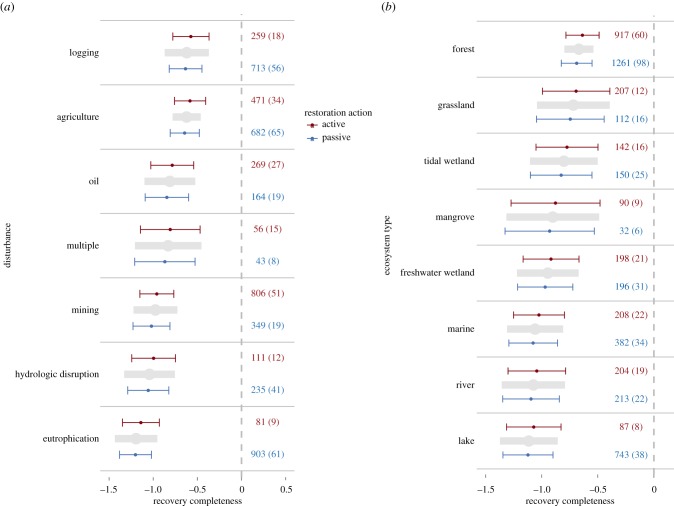
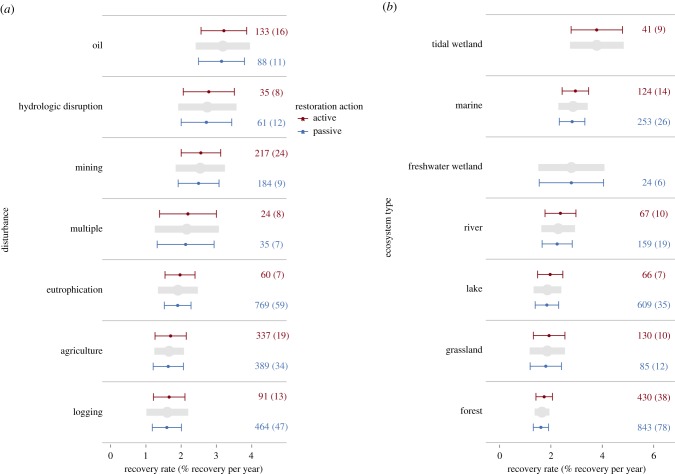
Given that few ecosystems on the Earth have been unaffected by humans, restoring them holds great promise for stemming the biodiversity crisis and ensuring ecosystem services are provided to humanity. Nonetheless, few studies have documented the recovery of ecosystems globally or the rates at which ecosystems recover. Even fewer have addressed the added benefit of actively restoring ecosystems versus allowing them to recover without human intervention following the cessation of a disturbance. Our meta-analysis of 400 studies worldwide that document recovery from large-scale disturbances, such as oil spills, agriculture and logging, suggests that though ecosystems are progressing towards recovery following disturbances, they rarely recover completely. This result reinforces conservation of intact ecosystems as a key strategy for protecting biodiversity. Recovery rates slowed down with time since the disturbance ended, suggesting that the final stages of recovery are the most challenging to achieve. Active restoration did not result in faster or more complete recovery than simply ending the disturbances ecosystems face. Our results on the added benefit of restoration must be interpreted cautiously, because few studies directly compared different restoration actions in the same location after the same disturbance. The lack of consistent value added of active restoration following disturbance suggests that passive recovery should be considered as a first option; if recovery is slow, then active restoration actions should be better tailored to overcome specific obstacles to recovery and achieve restoration goals. We call for a more strategic investment of limited restoration resources into innovative collaborative efforts between scientists, local communities and practitioners to develop restoration techniques that are ecologically, economically and socially viable.
Keywords: disturbance; recovery; resilience; restoration.
© 2018 The Author(s).
Conflict of interest statement
We have no competing interests.
Figures
Comment in
-
We agree with Larkin et al. 2019: restoration is context specific.Proc Biol Sci. 2019 Jul 24;286(1907):20191179. doi: 10.1098/rspb.2019.1179. Epub 2019 Jul 17. Proc Biol Sci. 2019. PMID: 31311471 Free PMC article. No abstract available.
-
Revisiting the benefits of active approaches for restoring damaged ecosystems. A Comment on Jones HP et al. 2018 Restoration and repair of Earth's damaged ecosystems.Proc Biol Sci. 2019 Jul 24;286(1907):20182928. doi: 10.1098/rspb.2018.2928. Epub 2019 Jul 17. Proc Biol Sci. 2019. PMID: 31311481 Free PMC article. No abstract available.
References
-
- Wilson EO. 1992. Diversity of life. Cambridge, MA: Harvard University Press.
-
- Higgs E, Falk DA, Guerrini A, Hall M, Harris J, Hobbs RJ, Jackson ST, Rhemtulla JM, Throop W. 2014. The changing role of history in restoration ecology. Front. Ecol. Environ. 12, 499–506. (10.1890/110267) - DOI
Publication types
MeSH terms
Associated data
LinkOut - more resources
Full Text Sources
Other Literature Sources
Miscellaneous