. 2018 Feb 28;10(430):eaao2304.
doi: 10.1126/scitranslmed.aao2304.

Fast direct neuronal signaling via the IL-4 receptor as therapeutic target in neuroinflammation

Affiliations

Fast direct neuronal signaling via the IL-4 receptor as therapeutic target in neuroinflammation

Christina F Vogelaar et al. Sci Transl Med. .

Abstract

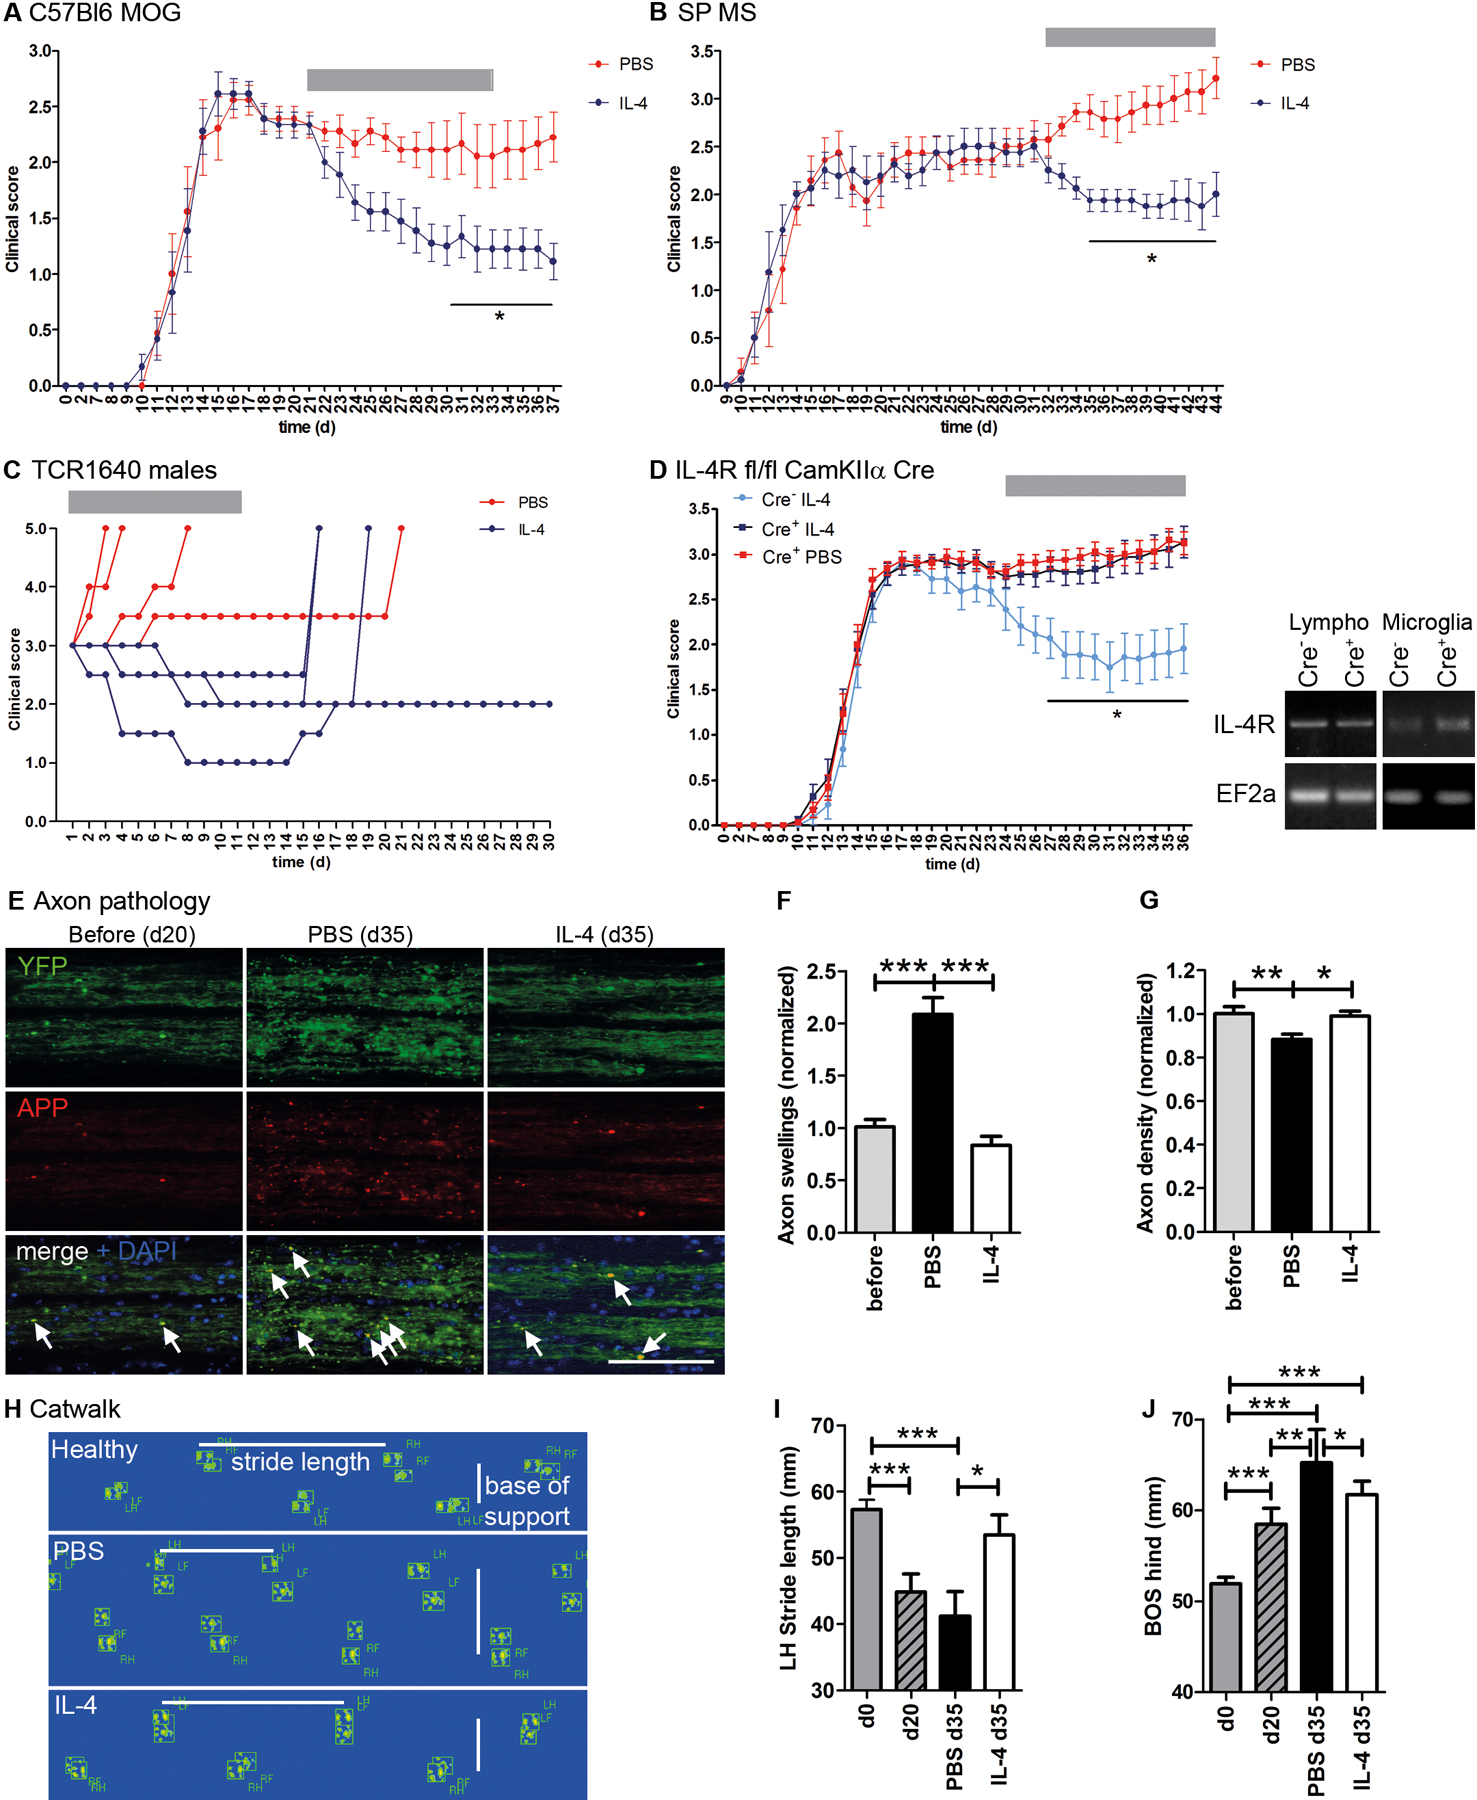
Ongoing axonal degeneration is thought to underlie disability in chronic neuroinflammation, such as multiple sclerosis (MS), especially during its progressive phase. Upon inflammatory attack, axons undergo pathological swelling, which can be reversible. Because we had evidence for beneficial effects of T helper 2 lymphocytes in experimental neurotrauma and discovered interleukin-4 receptor (IL-4R) expressed on axons in MS lesions, we aimed at unraveling the effects of IL-4 on neuroinflammatory axon injury. We demonstrate that intrathecal IL-4 treatment during the chronic phase of several experimental autoimmune encephalomyelitis models reversed disease progression without affecting inflammation. Amelioration of disability was abrogated upon neuronal deletion of IL-4R. We discovered direct neuronal signaling via the IRS1-PI3K-PKC pathway underlying cytoskeletal remodeling and axonal repair. Nasal IL-4 application, suitable for clinical translation, was equally effective in improving clinical outcome. Targeting neuronal IL-4 signaling may offer new therapeutic strategies to halt disability progression in MS and possibly also neurodegenerative conditions.


Conflict of interest statement

Competing interests: The authors declare that they have no competing interests.

Figures

Fig. 1.
Fig. 1.. IL-4Rα on axons of human postmortem brains.
(A) Interleukin-4 receptor a (IL-4Rα; green, left) in the human isocortex of an individual with no history of neurological disease. (B) Overview of IL-4Rα expression on SMI-31+ axons (red, middle) in the human isocortex of a multiple sclerosis (MS) patient at the gray matter (GM)–white matter (WM) border. (C) Higher magnification of (B) of IL-4Rα staining on membranes (arrows) of some SMI-31+ axons (asterisk). (D) IL-4Rα immunoreactivity on swollen axons (arrowhead) at the site of lesion. Scale bars, 50 μm (B) and 5 μm (A, C, and D).
Fig. 2.
Fig. 2.. Improvement of clinical score, axon pathology, and locomotor recovery after IL-4 treatment during chronic EAE.
(A) Disease progression in C57Bl6 myelin oligodendrocyte glycoprotein 35–55 (MOG) experimental autoimmune encephalomyelitis (EAE) mice injected intrathecally for 2 weeks with IL-4 (blue, n = 9) or phosphate-buffered saline (PBS; red, n = 9) during the chronic phase (gray bar; representative of three independent experiments). IL-4 treatment in a model of (B) secondary progressive (SP) MS (n = 4 each group) and (C) primary progressive (PP) MS (TCR1640). Individual TCR1640 male mice are shown from the first day of treatment with IL-4 (blue) or PBS (red) onward. (D) Left: IL-4 effects in neuron-specific IL-4R floxed/floxed (fl/fl) calcium/calmodulin-dependent protein kinase IIα (CamKIIα) Cre+ mice [IL-4, dark blue (n = 18); PBS, red (n = 17)] and Cre mice [IL-4, light blue (n = 12)]. Right: Reverse transcriptase polymerase chain reaction for IL-4R with elongation factor 2a (EF2a) as control on lymphocytes and microglia isolated from Cre+ and Cre mice. (E) Representative images of horizontal sections of the corticospinal tract (CST) labeled with yellow fluorescent protein (YFP) and stained for amyloid precursor protein (APP). Scale bar, 100 μm. DAPI, 4′,6-diamidino-2-phenylindole. (F) Quantification of axon swellings corrected for the analyzed area, normalized to the before-treatment (d20) group (n = 3 each group, average of four sections per animal). (G) Quantification of the CST axon density in pixels per area, normalized to the before-treatment group. (H) Illustration of the parameters stride length and base of support (BOS) in the CatWalk output files from a mouse at d0 (healthy; upper panel) and the same mouse at d35 after PBS treatment (middle panel), as well as an IL-4–treated mouse at d35 (lower panel). LH, RH, LF, RF, left and right hind- and forelimbs. (I to J) Quantification of selected CatWalk parameters (I) stride length and (J) BOS (IL-4, n = 8; PBS, n = 7). Statistical analysis was performed using two-way analysis of variance (ANOVA) for repeated measures with Bonferroni correction for clinical score, one-way ANOVA with Tukey’s multiple comparison test for histology, and Mann-Whitney U for CatWalk. *P < 0.05, **P < 0.01, ***P < 0.001.
Fig. 3.
Fig. 3.. Absence of effects of IL-4 on immune cells.
(A) Gating strategy for the immune cells isolated from the central nervous system (CNS) of C57Bl6 MOG mice treated with PBS or IL-4. FACS, fluorescence-activated cell sorting; SSC, side scatter; FSC, forward scatter; MHCII, major histocompatibility complex class II; TNFα, tumor necrosis factor α; IFN-γ, interferon-γ; GM-CSF, granulocyte-macrophage colony-stimulating factor. Lymphocyte subtypes and CD11b+MHCII+ cells in the (B) CNS and (C) spleens at end point (d37). Statistical analysis was performed using unpaired t test (n = 3 per group, confirmed in two independent experiments).
Fig. 4.
Fig. 4.. Beneficial effects of IL-4 on neurons and axons.
(A) Neuron viability assay. Incubation of dissociated cortical neurons with 1 μM N-methyl-D-aspartate and concomitant treatment with PBS or IL-4 (50 ng/ml) followed by incubation with propidium iodide (PI). Immunocytochemistry showing neurons marked with tubulin-beta-III (Tubb3; red), PI (green), and DAPI (blue). Scale bar, 10 μm. (B) Quantification of PI+ neurons (n = 4 per group, representative of two independent experiments). (C) Explants of layer V of the motor cortex after two to three days in vitro. The 10 longest axons are marked with black dots. Scale bar, 100 μm. (D) Quantification of effects of IL-4 treatment at 48 and 72 hours (IL-4, n = 5; PBS, n = 8, pooled from three experiments). WT, wild-type. (E) Quantification of axonal outgrowth in cortical explant cultures of the neuron-specific IL-4R knockout mice (n = 3 each group). (F) Injection of anterograde tracer 7 days before EAE induction and treatment with IL-4 during the chronic phase (gray bar) of C57Bl6 MOG EAE showing the typical disease course and treatment response (PBS, n = 8; IL-4, n = 9). (G) Representative images of the traced dorsal CST (upper left, dashed border) displaying sprouting into the gray matter (arrows). Scale bar, 50 μm. (H) Quantification of CST sprouting and tracing density (n = 4 animals, three sections per animal). Statistical analysis was performed using unpaired t test for cell culture and histology and two-way ANOVA for repeated measures with Bonferroni correction for clinical score. *P < 0.05, **P < 0.01, ***P < 0.001.
Fig. 5.
Fig. 5.. Direct signaling of IL-4 in neurons.
(A) Immunoprecipitation (IP) using IL-4Rα antibody and detecting antibodies for SH2 domain (Src homology 2 domain)–containing adaptor protein (Shc), insulin receptor substrate 1 (IRS1), and phosphatidylinositol-3 kinase (PI3K), the latter after treatment with PBS or IL-4. Input (in): Protein lysates of dissociated cortical neurons, washing steps (w1 to w3). Output (out): Sample after IP elution. (B) Quantification of PI3K recruitment after incubation with IL-4 (n = 3). (C) Phosphorylation assays on dissociated cortical neurons treated for 10 min with IL-4 (50 ng/ml) or PBS. Western blots for phospho- and total IRS1, protein kinase C y (PKCγ), and growth-associated protein–43 (GAP-43). (D) Ratios of phosphorylated protein through total protein for IRS1 (n = 3), PKCγ (n = 9 to 11), and GAP-43 (n = 6 to 7). (E) Quantification of cortical axon growth with IL-4 treatment in the presence of PKC inhibitor bisindolylmaleimide I (BisI; n = 3 to 5 each time point per group). (F) Phosphorylation of signaling molecules in response to IL-4 treatment of cortical neurons from the IL-4R fl/fl CamKIIα Cre mice. (G) Representative images of immunohistochemistry for pIRS1 (green) on the CST and dorsal columns (DC) in IL-4– or PBS-treated EAE mice. Scale bar, 50 μm. (H) Quantification of pIRS+ axon profiles corrected for the analyzed area (n = 5). Statistical analysis was performed using unpaired t test for phosphorylation assays and one-way ANOVA with Tukey’s multiple comparison test for growth assay. *P < 0.05, **P < 0.01, ***P < 0.001.
Fig. 6.
Fig. 6.. Cytoskeletal remodeling after IL-4 treatment in vitro.
(A) IP with GAP-43 antibody to detect calmodulin (CaM) binding. (B) Quantification of IL-4–induced release of CaM (n = 3 per treatment). (C to F) Immunocytochemistry for Tubb3 (red, left) and phalloidin (green, middle), a marker for filamentous actin (F-actin), with merged image (right) for dissociated cortical neurons treated with (C) PBS, (D) IL-4 (30 min, 50 ng/ml), (E) IL-4 + BisI, and (F) IL-4 + BAPTA-AM [1,2-bis(2-aminophenoxy)ethane-N,N,N′,N′-tetraacetic acid acetoxymethyl ester]. Patchy clusters of F-actin are marked with asterisks, strong filamentous F-actin signals in neurites are marked with arrows, and a shift toward the surface of the cell body is marked with arrowheads. (G) Quantification of actin filament length (n = 5). Scale bar, 10 μm. Statistical analysis was performed using unpaired t test for CaM release and one-way ANOVA with Tukey’s multiple comparison test for F-actin quantification. **P < 0.01, ***P < 0.001.
Fig. 7.
Fig. 7.. Improvement of clinical score and axon pathology by nasal IL-4 treatment during chronic EAE.
(A) Disease progression in C57Bl6/YFP-H MOG EAE mice treated for 2 weeks with IL-4 via intrathecal injection (blue; n = 5) or intranasally with IL-4 or PBS (light blue and red; n = 12 each) during the chronic phase (gray bar). (B) Representative images of horizontal sections of the YFP-labeled CST counterstained for APP, showing axonal swellings. Scale bar, 50 μm. (C) Quantification of axon swellings corrected for the analyzed area (n = 3 each group, average of three to five sections per animal). Statistical analysis was performed using two-way ANOVA for repeated measures with Bonferroni correction for clinical score and one-way ANOVA with Tukey’s multiple comparison test for quantification of axonal swellings. *P < 0.05, ***P < 0.001.

References

    1. Larochelle C, Uphaus T, Prat A, Zipp F, Secondary progression in multiple sclerosis: Neuronal exhaustion or distinct pathology? Trends Neurosci 39, 325–339 (2016). - PubMed
    1. Friese MA, Schattling B, Fugger L, Mechanisms of neurodegeneration and axonal dysfunction in multiple sclerosis. Nat. Rev. Neurol 10, 225–238 (2014). - PubMed
    1. Siffrin V, Radbruch H, Glumm R, Niesner R, Paterka M, Herz J, Leuenberger T, Lehmann SM, Luenstedt S, Rinnenthal JL, Laube G, Luche H, Lehnardt S, Fehling HJ, Griesbeck O, Zipp F, In vivo imaging of partially reversible TH17 cell-induced neuronal dysfunction in the course of encephalomyelitis. Immunity 33, 424–436 (2010). - PubMed
    1. Nikić I, Merkler D, Sorbara C, Brinkoetter M, Kreutzfeldt M, Bareyre FM, Brück W, Bishop D, Misgeld T, Kerschensteiner M, A reversible form of axon damage in experimental autoimmune encephalomyelitis and multiple sclerosis. Nat. Med 17, 495–499 (2011). - PubMed
    1. Franklin RJM, ffrench-Constant C, Edgar JM, Smith KJ, Neuroprotection and repair in multiple sclerosis. Nat. Rev. Neurol 8, 624–634 (2012). - PubMed

Publication types

LinkOut - more resources