. 2018 Feb 28;10(430):eaao2980.
doi: 10.1126/scitranslmed.aao2980.

Mechanical circulatory support device-heart hysteretic interaction can predict left ventricular end diastolic pressure

Affiliations

Mechanical circulatory support device-heart hysteretic interaction can predict left ventricular end diastolic pressure

Brian Y Chang et al. Sci Transl Med. .

Abstract

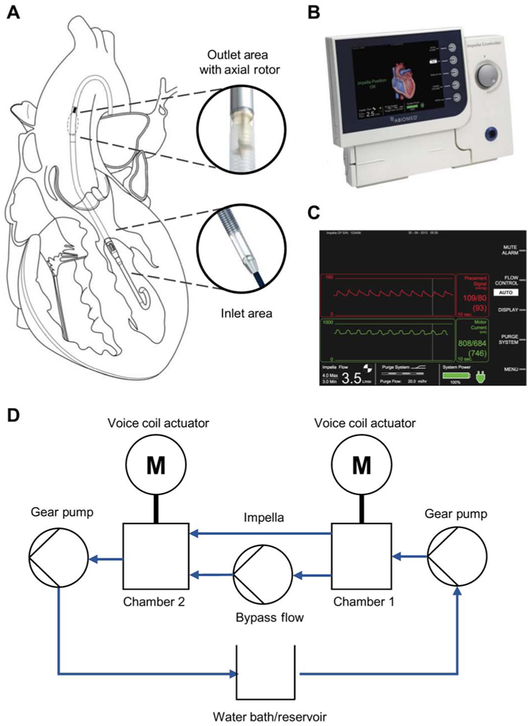
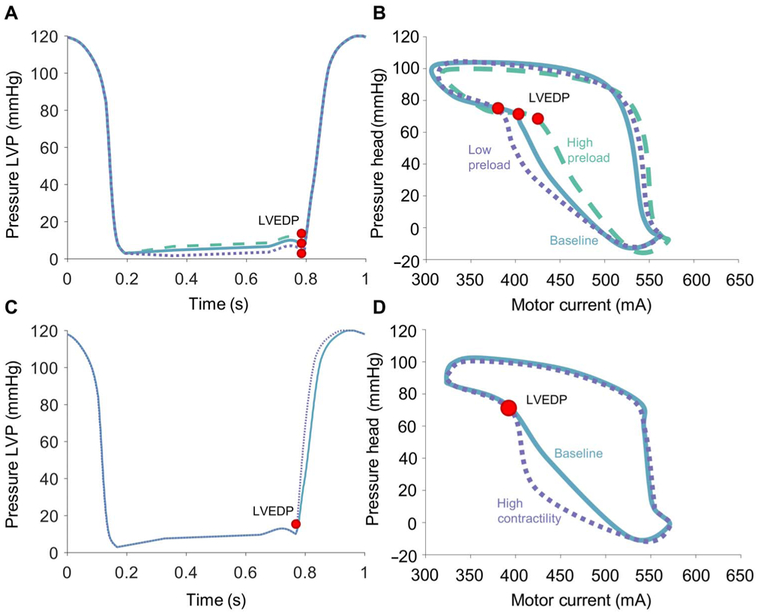
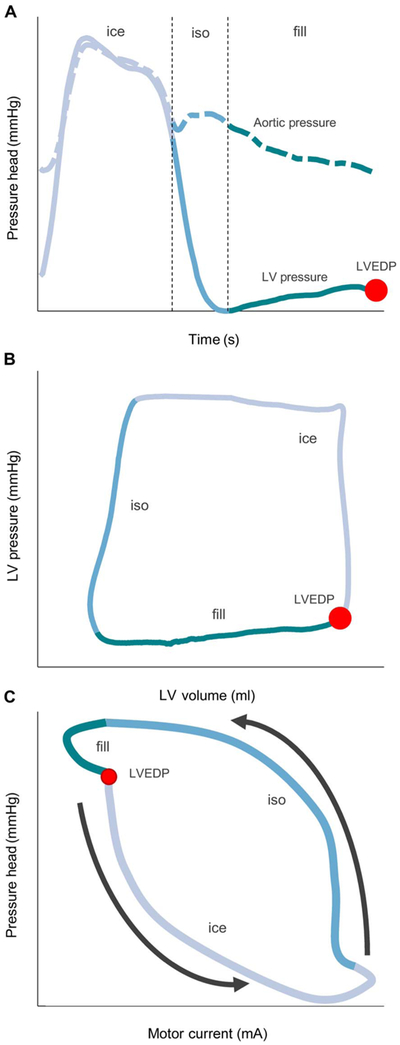
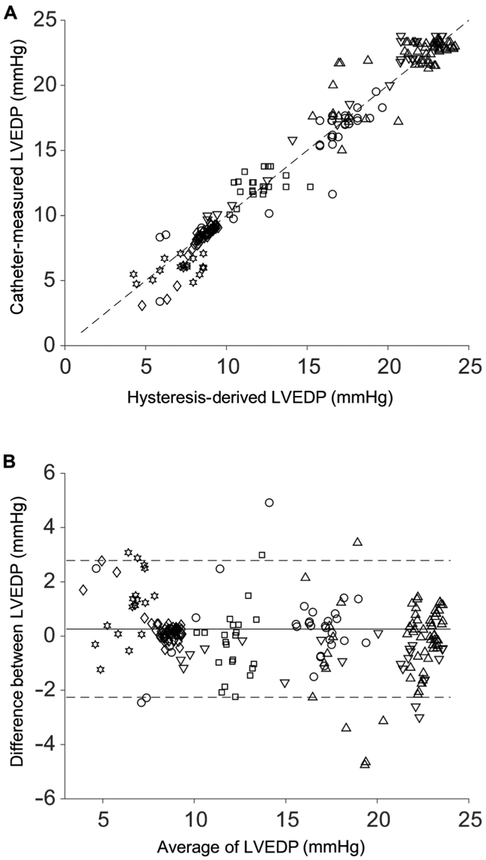
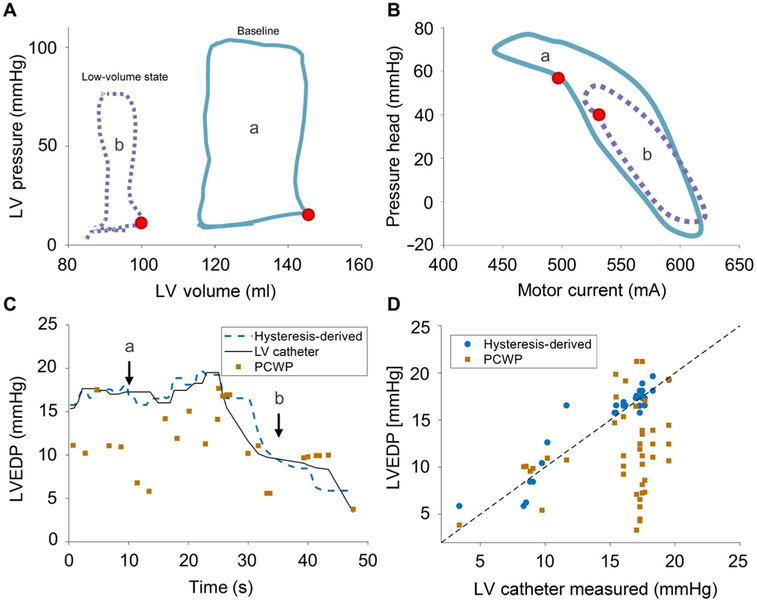
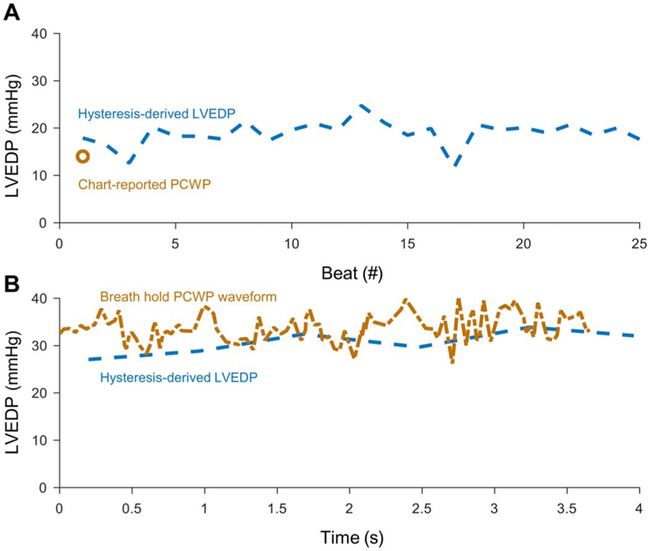
The full potential of mechanical circulatory systems in the treatment of cardiogenic shock is impeded by the lack of accurate measures of cardiac function to guide clinicians in determining when to initiate and how to optimally titrate support. The left ventricular end diastolic pressure (LVEDP) is an established metric of cardiac function that refers to the pressure in the left ventricle at the end of ventricular filling and immediately before ventricular contraction. In clinical practice, LVEDP is typically only inferred from, and poorly correlates with, the pulmonary capillary wedge pressure (PCWP). We leveraged the position of an indwelling percutaneous ventricular assist device and advanced data analysis methods to obtain LVEDP from the hysteretic operating metrics of the device. We validated our hysteresis-derived LVEDP measurement using mock flow loops, an animal model of cardiac dysfunction, and data from a patient in cardiogenic shock to show greater measurement precision and correlation with actual pressures than traditional inferences via PCWP. Delineation of the nonlinear relationship between device and heart adds insight into the interaction between ventricular support devices and the native heart, paving the way for continuous assessment of underlying cardiac state, metrics of cardiac function, potential closed-loop automated control, and rational design of future innovations in mechanical circulatory support systems.


Conflict of interest statement

Competing interests: E.R.E., B.Y.C., N.J., and S.S.B. are co-inventors on pending U.S. patent 15/709,080 submitted by the Massachusetts Institute of Technology that covers extraction of hemodynamic metrics from MCS devices. S.S.B. and N.J. are employees of Abiomed. All other authors have no other conflict of interests.

Figures

Fig. 1.
Fig. 1.. Schematic of Impella placement and operation and the hybrid MCL used for initial device characterization.
(A) The Impella, a catheter-mounted percutaneous mechanical support device that is inserted transvalvularly into the left ventricle, pulls flow from the left ventricle, across the aortic valve, and into the aorta using a mixed flow impeller. (B) External Impella console used to control the Impella device and record operational data, which is displayed with (C) an aortic pressure (red) and motor current (green). (D) In the MCL, the Impella is mounted between actuated pressure chambers to simulate the left ventricle (chamber 1) and aorta (chamber 2). A temperature-controlled blood-mimicking solution is circulated counterclockwise via gear pumps through the system to simulate cardiac ejection and generate pressure in the chambers. Rapid and fine pressure changes in the chambers are generated via voice coil actuators displacing metal bellows.
Fig. 2.
Fig. 2.. Impella function in an MCL.
(A) Varying preload conditions were tested by setting LVEDP to values including 5 mmHg (dotted), 10 mmHg (solid), and 15 mmHg (dashed), which are shown for a single representative run. Peak systolic pressure was held constant with changes in slope to accommodate different values of LVEDP (red dot). (B) In a representative case with Impella speed of 37,000 rpm, LVEDP (red dot) is located at different points on the motor current hysteresis loop with each condition. (C) Left ventricular pressure (LVP) tracings with different slopes of systolic contraction (dP/dt) were used to simulate varying contractility from 1100 mmHg/s (solid) to 1600 mmHg/s (dotted). LVEDP (red dot) is held constant. (D) In a representative case with Impella speed of 37,000 rpm, LVEDP (red dot) does not change with variable contractility.
Fig. 3.
Fig. 3.. The cardiac cycle separated Into phases of ventricular isovolumetric contraction and ejection (ice), isovolumetric relaxation (iso), and diastolic filling (fill).
(A) Left ventricular (LV) (solid line) and aortic (dashed line) pressures over time, (B) left ventricular PV loop corresponding to the time series in (A), and (C) motor current hysteresis loop corresponding to the same heart beat as (A) and (B). This hysteresis loop can be separated into these different phases and cycles in a counterclockwise direction as indicated by the arrows. Phase separation allows easier determination of various effects on the loop from changing cardiac state. LVEDP is indicated in all panels by a red dot.
Fig. 4.
Fig. 4.. Accuracy of hysteresis-derived measurement compared to direct indwelling catheter measurement over multiple animal trials.
Data from five pigs with an implanted Impella operating at 37,000 or 42,000 rpm had varying baseline LVEDP values and effect size from an IVC occlusion. Each point (n = 269) represents a separate measurement comparison, and each marker represents a different case (Table 1), with the 42,000 rpm represented by the downward triangle. (A) Correlation plot comparing hysteresis-derived and directly measured LVEDP (R2 = 0.96) for all animals, with the dashed line representing the unity correlation. (B) Bland-Altman plot for all animals with standard confidence intervals using ±2 SDs of the difference between the hysteresis-derived and directly measured LVEDP over the average result of both methods.
Fig. 5.
Fig. 5.. LVEDP measurement during IVC occlusion.
Hemodynamics at baseline (a, solid blue line) and during IVC occlusion before Impella suction event (b, dotted purple line). (A) Left ventricular PV loops from Millar catheter demonstrate reduction in end diastolic pressure and stroke volume. (B) Hysteresis loops exhibit increased motor current during diastolic filling and a shift in notch (red dot) corresponding to end diastolic pressure from the effects of the IVC occlusion. (C) LVEDP over time via hysteresis-derived method (dashed blue line), direct catheter (solid black line), and PCWP measurement (orange square). (D) Correlation plot of the hysteresis-derived (blue circle; R2 = 0.88) and PCWP (orange square; R2 = 0.04) measurements to direct measurement of LVEDP, with the dashed black line representing the unity correlation.
Fig. 6.
Fig. 6.. LVEDP measurement from retrospective patient data.
Data are shown around discrete time points with available PCWP data. (A) A patient chart–extracted PCWP estimation (orange circle) for LVEDP is compared with the hysteresis-derived LVEDP (dashed blue line) for 25 heart beats. (B) A separate time point with a digitized waveform of PCWP (dashed-dotted orange line) during a breath hold and the hysteresis-derived LVEDP (dashed blue line).

Similar articles

Cited by

References

    1. Mozaffarian D, Benjamin EJ, Go AS, Arnett DK, Blaha MJ, Cushman M, Das SR, de Ferranti S, Després JP, Fullerton HJ, Howard VJ, Huffman MD, Isasi CR, Jiménez MC, Judd SE, Kissela BM, Lichtman JH, Lisabeth LD, Liu S, Mackey RH, Magid DJ, McGuire DK, Mohler ER III, Moy CS, Muntner P, Mussolino ME, Nasir K, Neumar RW, Nichol G, Palaniappan L, Pandey DK, Reeves MJ, Rodriguez CJ, Rosamond W, Sorlie PD, Stein J, Towfighi A, Turan TN, Virani SS, Woo D, Yeh RW, Turner MB; American Heart Association Statistics Committee and Stroke Statistics Subcommittee, Heart disease and stroke statistics—2016 update: A report from the American Heart Association. Circulation 133, e38–e360 (2016). - PubMed
    1. Heidenreich PA, Trogdon JG, Khavjou OA, Butler J, Dracup K, Ezekowitz MD, Finkelstein EA, Hong Y, Johnston SC, Khera A, Lloyd-Jones DM, Nelson SA, Nichol G, Orenstein D, Wilson PWF, Woo YJ, Forecasting the future of cardiovascular disease in the United States: A policy statement from the American Heart Association. Circulation 123, 933–944 (2011). - PubMed
    1. Roger VL, Epidemiology of heart failure. Circ. Res. 113, 646–659 (2013). - PMC - PubMed
    1. Reyentovich A, Barghash MH, Hochman JS, Management of refractory cardiogenic shock. Nat. Rev. Cardiol. 13, 481–492 (2016). - PubMed
    1. De Luca L, Olivari Z, Farina A, Gonzini L, Lucci D, Di Chiara A, Casella G, Chiarella F, Boccanelli A, Di Pasquale G, De Servi S, Bovenzi FM, Gulizia MM, Savonitto S, Temporal trends in the epidemiology, management, and outcome of patients with cardiogenic shock complicating acute coronary syndromes. Eur. J. Heart Fail. 17, 1124–1132 (2015). - PubMed

Publication types