. 2018 Feb 28;9(1):883.
doi: 10.1038/s41467-018-03265-1.

PAN-cancer analysis of S-phase enriched lncRNAs identifies oncogenic drivers and biomarkers

Affiliations

PAN-cancer analysis of S-phase enriched lncRNAs identifies oncogenic drivers and biomarkers

Mohamad Moustafa Ali et al. Nat Commun. .

Abstract

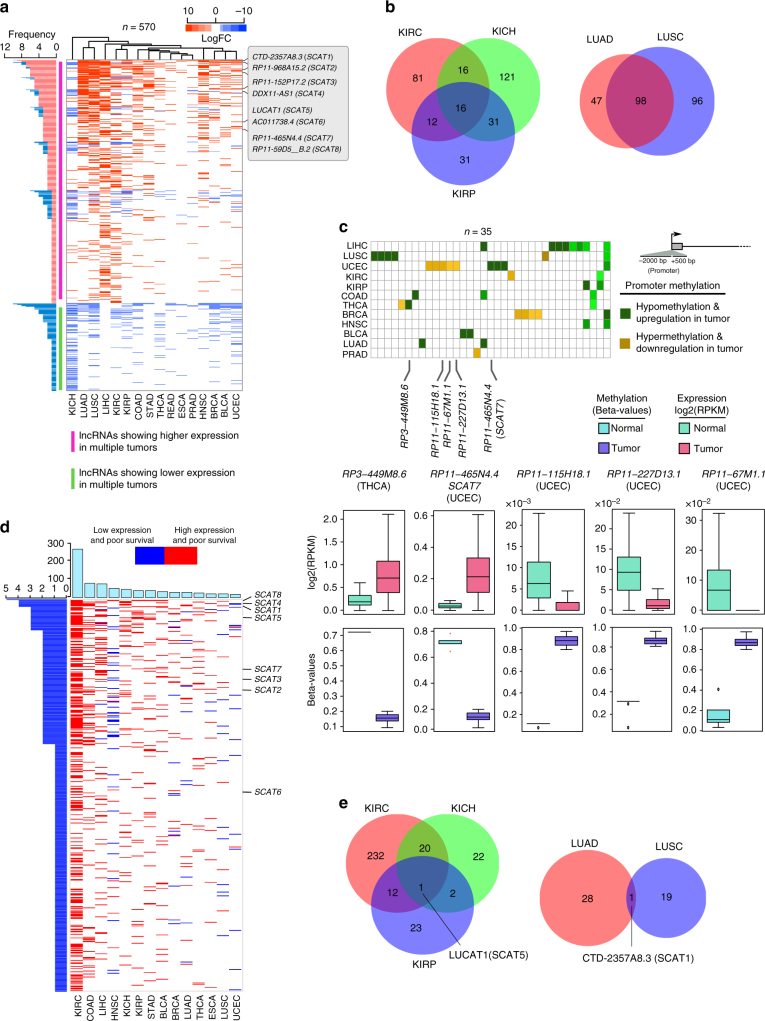
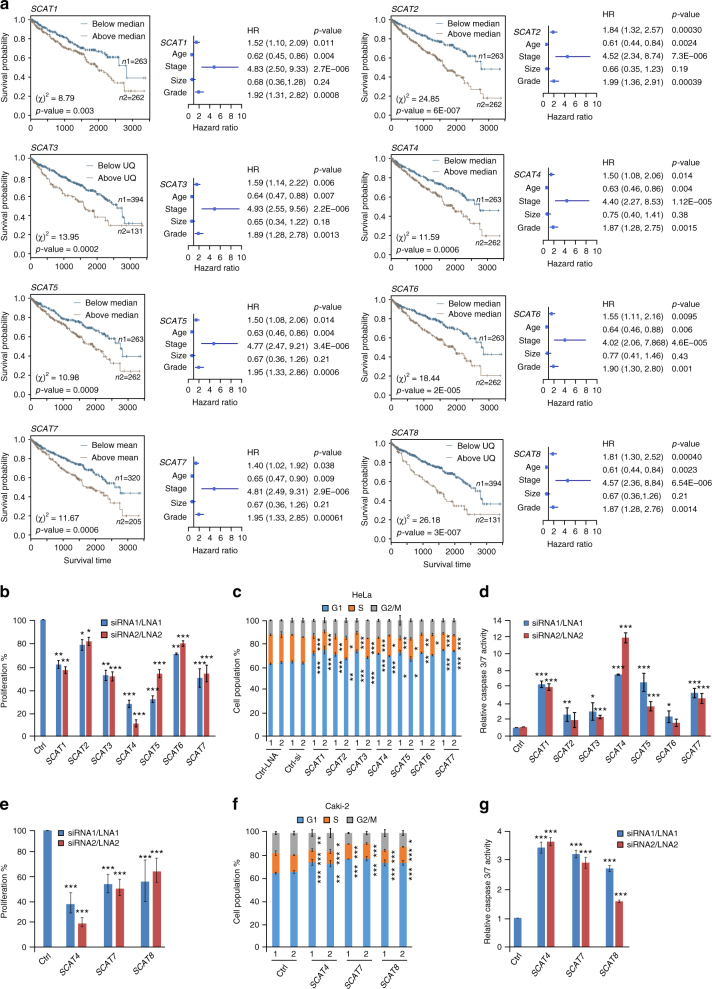
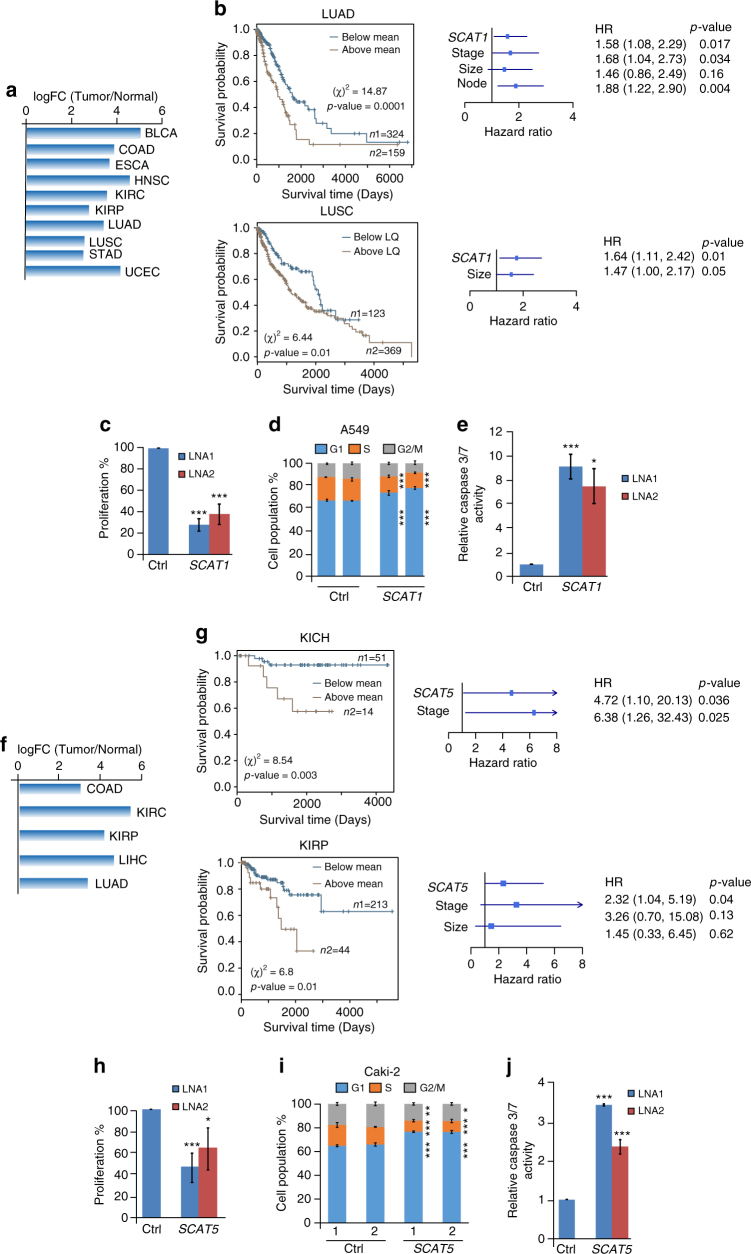
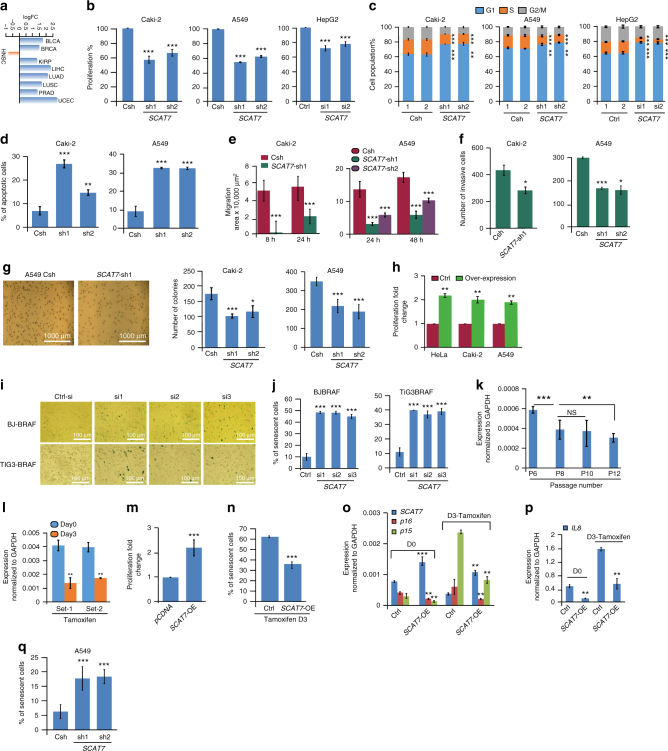
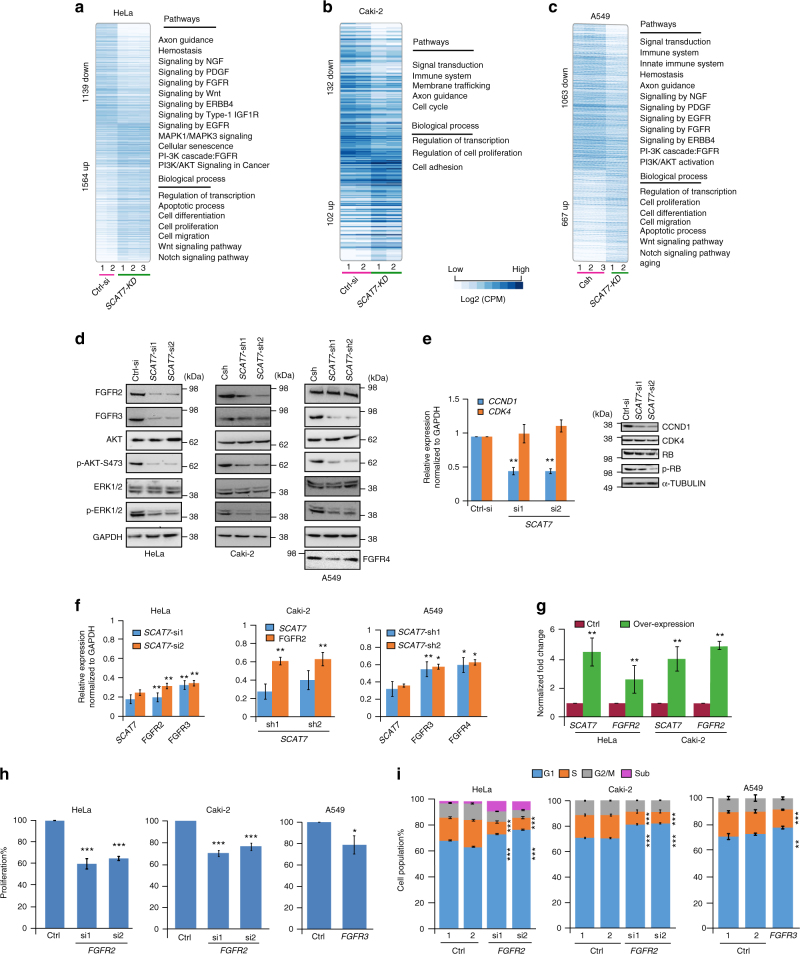
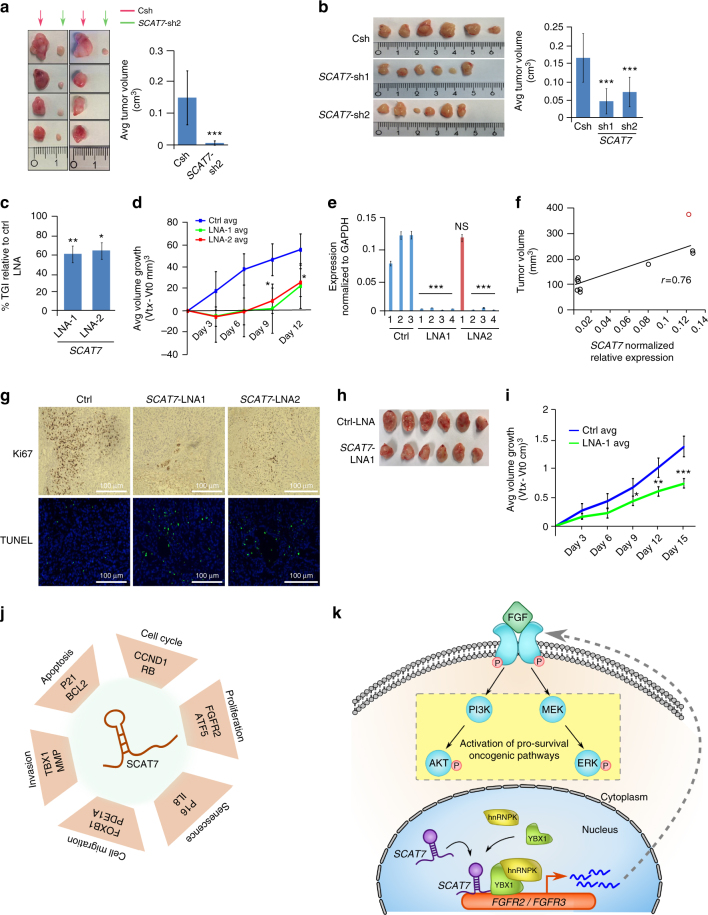
Despite improvement in our understanding of long noncoding RNAs (lncRNAs) role in cancer, efforts to find clinically relevant cancer-associated lncRNAs are still lacking. Here, using nascent RNA capture sequencing, we identify 1145 temporally expressed S-phase-enriched lncRNAs. Among these, 570 lncRNAs show significant differential expression in at least one tumor type across TCGA data sets. Systematic clinical investigation of 14 Pan-Cancer data sets identified 633 independent prognostic markers. Silencing of the top differentially expressed and clinically relevant S-phase-enriched lncRNAs in several cancer models affects crucial cancer cell hallmarks. Mechanistic investigations on SCAT7 in multiple cancer types reveal that it interacts with hnRNPK/YBX1 complex and affects cancer cell hallmarks through the regulation of FGF/FGFR and its downstream PI3K/AKT and MAPK pathways. We also implement a LNA-antisense oligo-based strategy to treat cancer cell line and patient-derived tumor (PDX) xenografts. Thus, this study provides a comprehensive list of lncRNA-based oncogenic drivers with potential prognostic value.


Conflict of interest statement

C.K., M.M.A., V.S.A., S.T.K., S.S. and L.S. have filed a provisional patent (no:1750724-5/160080SE) titled “Long noncoding RNA in Cancer” based on findings from the current manuscript. The remaining authors declare no competing interests.

Figures

Fig. 1
Fig. 1
Identification of temporally expressed lncRNAs across S-phase using nascent RNA capture assay. a Cell cycle diagram showing Nascent RNA capture at three different time points (2, 3.5, and 5 h) of S-phase. b Principle component analysis (PCA) of expression profiles by considering complete profile (noncoding and protein-coding), all noncoding and only lncRNAs. c Time-series analysis of S-phase associated lncRNAs with twofold enrichment at least in one time point over the unsynchronized sample. The S-phase lncRNAs show four significant temporal patterns with STEM clustering. Venn diagram shows the overlap of lncRNAs enriched in EtU labeled and unlabeled samples. The p-values are obtained using permutation tests from STEM clustering. d Molecular pathway analysis (left) and gene ontology (right) enrichment analysis for nearby (<50 kb proximity) protein-coding genes to S-phase associated lncRNAs. The KEGG pathways or biological functions presented in the heatmaps show at least 10 genes with p-value < 0.05. The hypergeometric p-values are obtained from GeneSCF for pathway and GO enrichment analysis. e Workflow of the analysis for the identification of S-phase associated lncRNAs and its significance in different cancers
Fig. 2
Fig. 2
Characterization of S-phase lncRNAs as oncogenic drivers and independent prognostic markers using pan-cancer TCGA data sets. a Heatmap of 570 S-phase lncRNAs showing significant differential expression at least in one cancer type from TCGA. The significance was considered based on log-fold change ± 2 and FDR < 1E–004 (Benjamini–Hochberg’s method). The highlighted lncRNAs are the ones selected for functional validation. The plot on the left side shows the frequency of individual lncRNAs differentially expressed across different cancer types. b Venn diagrams illustrating the overlap between common S-phase lncRNAs which are differentially expressed in different types of kidney and lung cancers. c Heatmap of S-phase lncRNAs with anti-correlative promoter methylation status to the differential expression levels in corresponding cancer. Hypomethylated promoter associated with higher expression and hypermethylation to less expression compared to normal. The highlighted lncRNAs are differentially methylated in more than 100 patients (samples) supporting the methylation pattern in corresponding cancer. Box plots of highlighted lncRNAs denoting the anti-correlative relation between promoter methylation and transcript expression. Box plots middle line shows the median, the box limits are 25th and 75th percentiles, whiskers are nearer quartile ± 1.5 times interquartile range and points beyond whiskers are the outliers. The p-values for the comparisons were obtained using Mann–Whitney test and corrected p-values using Family Wise Error Rate (FWER). The significant differentially methylated regions were filtered on the basis of FWER < 0.05. The above information for statistical analysis was extracted from COSMIC repository. d Heatmap showing the potential independent prognostic values of 520 S-phase lncRNAs based on dichotomization approach. The red color indicates higher expression of lncRNAs that predicts poor survival outcome. The blue color indicates lower expression of lncRNAs associated with poor survival in patients. e Venn diagrams indicating the numbers of S-phase lncRNAs that independently predict the survival outcome in different types of kidney and lung cancers
Fig. 3
Fig. 3
The top clinically relevant S-phase lncRNAs regulate crucial cancer cell hallmarks. a Kaplan–Meier plots of SCAT1SCAT8 indicating overall survival of patients in KIRC. The higher expression of all SCATs is correlated with poor overall survival. The expression cut-off and the significance value for each SCAT are indicated in the plots. UQ represents upper quartile of the patients’ expression levels. The Forest plots represent the multivariate models derived for each SCAT in combination with the significant clinical parameters. The hazard ratio (HR) using Cox proportional hazard analysis and the associated p-values were calculated using Wald statistics. b Proliferation capacity of HeLa cells as measured by MTT colorimetric assay 48 h post-silencing of SCATs using two different LNAs (SCAT1, SCAT2, SCAT4, SCAT5, and SCAT6) or siRNAs (SCAT3 and SCAT7). Data are represented as percentage compared to cells transfected with respect to the negative control. No significant difference was observed between LNA-negative control and siRNA-negative control. c Cell cycle profiles of HeLa cells depleted with two different LNAs or siRNAs targeting the seven SCATs. d Estimation of the caspase 3/7 activities 48 h post-silencing of SCATs in HeLa cells. Data are expressed as fold change with respect to the corresponding negative controls. e MTT proliferation assay of Caki-2 (KIRC) cell line depleted with two independent LNAs (SCAT4, SCAT8) or siRNAs (SCAT7). f Cell cycle profiles of Caki-2 cells depleted with two different LNAs or siRNAs. g Estimation of the caspase 3/7 activities 48 h post-silencing of the corresponding SCAT in Caki-2 cells. Data in bg are shown as mean ± SEM of three independent experiments. Significance levels were derived using unpaired two-tailed Students’ t-test. (*p ≤ 0.05; **p = 0.01 – 0.001; ***p < 0.001)
Fig. 4
Fig. 4
SCAT1 and SCAT5 act as oncogenic drivers and prognostic markers for lung-derived and kidney-derived cancers, respectively. a Bar graph showing the significant differential expression levels of SCAT1 expressed as log2 fold change across 10 different cancer types obtained from TCGA data sets. b Kaplan–Meier plots of SCAT1 indicating overall survival of patients in LUAD (upper left panel) and LUSC (lower left panel) cancer types. The higher expression of the SCAT1 is correlated with poor overall survival. The upper and lower right panels represent the multivariate models of LUAD and LUSC cancers, respectively, derived from Cox proportional hazard analysis and associated p-values were calculated using Wald statistics. c MTT proliferation assay of A549 (LUAD) cell line depleted with two different LNA oligos targeting SCAT1. d Cell cycle profiles of control and SCAT1 KD A549 cells. e Estimation of caspase 3/7 activity in control and SCAT1 KD A549 cells. f Bar graph showing the significant differential expression levels of SCAT5 expressed as log2 fold change across five different cancer types obtained from TCGA data sets. g Kaplan–Meier plots of SCAT5 indicating overall survival of patients in KICH (upper left panel) and KIRP (lower left panel) kidney cancer. The higher expression of the SCAT5 is correlated with poor overall survival. The upper and lower right panels represent the multivariate models of KICH and KIRP cancers, respectively. h MTT proliferation assay of Caki-2 cell line 48 h post-silencing of SCAT5 using two different LNAs. i Cell cycle profiles of control and SCAT5 KD Caki-2 cells. j Estimation of caspase 3/7 activity in Caki-2 cells 48 h post-silencing of SCAT5. The significance in figures a and f was derived using Benjamini–Hochberg’s method. Note that the data presented in ce and hj represents the mean values of three independent experiments and statistical significance was derived using a two-tailed unpaired Student’s t-test. Data are plotted as mean ± SD (*p ≤ 0.05; **p = 0.01 – 0.001; ***p < 0.001)
Fig. 5
Fig. 5
SCAT7 acts as an oncogenic driver in renal, lung, and liver cancers. a SCAT7 expression as log2 fold change across cancer types from TCGA data sets. The significance was obtained using Benjamini–Hochberg’s method. b MTT of Caki-2, A549, and HepG2 cells upon SCAT7 KD with two shRNAs or siRNAs. c Cell cycle profiles of Caki-2, A549, and HepG2 cells after shRNA or siRNA-based SCAT7 KD. d Percentage of apoptotic cells in SCAT7 KD Caki-2 and A549 48 h post-seeding. e Migration areas for stable SCAT7 KD Caki-2 and A549 cells were calculated with respect to a starting (t = 0) migration control area for each cell line. f Matrigel transwell assay in Caki-2 and A549 SCAT7 stable KD cells. The number of invasive cells was counted 24 h post-seeding. g Soft agar colony-forming assay using Caki-2 and A549 KD cells. h MTT of HeLa, Caki-2, and A549 cells overexpressing SCAT7. i Colorimetric β-galactosidase staining of BJ-BRAF and TIG3-BRAF human fibroblasts 72 h post-silencing SCAT7 using three siRNAs. Senescent cells are in dark blue color. j Quantification of senescent cells upon SCAT7 KD in BJ-BRAF and TIG3-BRAF cells shown as percentage of the whole cells populations. k SCAT7 qPCR in serial passages of BJ-BRAF cells. NS, not significant. l SCAT7 expression in BJ-BRAF cells at day 0 and day 3 upon tamoxifen-induced senescence (200 nM) at one passage interval. m MTT assay of BJ-BRAF cells overexpressing SCAT7 compared to empty vector. n Percentage of positively stained senescent cells 3 days post-tamoxifen treatment in control and SCAT7-overexpressing BJ-BRAF cells. o, p Expression of SCAT7, p16, p15 (o) and IL8 (p) in control BJ-BRAF and SCAT7-overexpressing cells at day 0 and day 3 post-treatment with tamoxifen. q Quantification of senescent cells upon SCAT7 KD in A549 cells. The values are expressed as percentage of the whole cell population. Note that the data presented in bh and jq represents mean values of three independent experiments and the statistical significance was derived using a two-tailed unpaired Student’s t-test. Data are plotted as mean ± SD (*p ≤ 0.05; **p = 0.01 – 0.001; ***p < 0.001)
Fig. 6
Fig. 6
SCAT7 regulates cell cycle progression and cell proliferation via FGF signaling. ac Heatmaps showing upregulated and downregulated genes with corresponding molecular pathways and biological processes upon silencing of SCAT7 in HeLa (a), Caki-2 (b), and A549 (c) cell lines. d Western blot showing the proteins levels of FGFR2, FGFR3, AKT, Ser 473 Phospho-AKT (p-AKT S473), ERK1/2, and Phoshpo-ERK1/2 (p-ERK 1/2) upon silencing of SCAT7 in HeLa, Caki-2, and A549 cell lines. FGFR4 protein levels were only investigated in A549 cells. e Real-time qPCR validation (left panel) and Western blot (right panel) showing a significant reduction in the expression levels of CCND1 but not CDK4. f Real-time qPCR validation of the expression levels of SCAT7 and its targets FGFR2, FGFR3, and FGFR4 in HeLa, Caki-2, and A549 cells upon SCAT7 KD with two independent siRNAs or shRNAs. g Expression of SCAT7 and its target FGFR2 in HeLa and Caki-2 cells overexpressing SCAT7. Data are shown as relative fold change normalized to GAPDH. h MTT assay in HeLa and Caki-2 cells, after transfection with siRNAs targeting FGFR2, and A549 cells, transfected with esiRNA to silence FGFR3. i Cell cycle profiles of HeLa and Caki-2 cells transfected with siRNAs targeting FGFR2 (left and middle). The right panel shows the cell cycle profile of A549 cells transfected with FGFR3 esiRNA. Note that the data presented in ei represent mean values of three independent experiments and the statistical significance was derived using a two-tailed unpaired Student’s t-test. Data are plotted as mean ± SD (*p ≤ 0.05; **p = 0.01 – 0.001; ***p < 0.001)
Fig. 7
Fig. 7
SCAT7 interacts with hnRNPK and YBX1 to regulate cell proliferation and cell cycle progression. a Venn diagram showing SCAT7 interacting proteins in HeLa cells identified using ChOP-MS in two independent biological replicates. b RIP using hnRNPK or YBX1 antibody followed by qPCR for SCAT7. c Validation of SCAT7 interaction with hnRNPK and YBX1 by ChOP followed by immunoblotting in HeLa cells. LacZ and SCAT7 reverse biotinylated probes were used as negative controls. d MTT in HeLa cells after transfection with two siRNAs targeting hnRNPK or YBX1. e Cell cycle analysis upon hnRNPK and YBX1 KD in HeLa cells. f FGFR2 expression by real-time qPCR in hnRNPK and YBX1 KD HeLa cells. g Western blot of FGFR2, FGFR3, AKT, Ser 473 Phospho-AKT (p-AKT S473), ERK1/2, and Phoshpo-ERK1/2 (p-ERK 1/2) in hnRNPK and YBX1 KD HeLa cells. h, i ChOP followed by qPCR for SCAT7 enrichment at FGFR2 (h) and FGFR3 (i) promoters in HeLa cells. Four primer pairs were used to assess the occupancy at every 250 bp upstream of FGFR2 and FGFR3 TSS. j, k ChIP using hnRNPK or YBX1 antibody followed by qPCR for hnRNPK and YBX1 occupancy at FGFR2 (j) and FGFR3 (k) promoters in control and SCAT7 KD HeLa cells. l Interaction of SCAT7 with hnRNPK and YBX1 by SCAT7 ChOP followed by immunoblotting in A549 cells. m ChOP followed by qPCR for SCAT7 enrichment at FGFR3 promoter in A549 cells. n hnRNPK or YBX1 ChIP followed by qPCR depicting the occupancy of hnRNPK and YBX1 at the FGFR3 promoter in control and SCAT7 KD A549 cells. o SCAT7 ChOP followed by immunoblotting with hnRNPK or YBX1 antibody in Caki-2 cells. p ChOP followed by qPCR quantification of SCAT7 enrichment at FGFR2 promoter in Caki-2 cells. q hnRNPK ChIP followed by qPCR depicting the occupancy of hnRNPK at FGFR2 promoter in control and SCAT7 KD Caki-2 cells. Note that the data presented in b, df, hk, m, n, p, and q represent mean values of three independent experiments and the statistical significance was derived using a two-tailed unpaired Student’s t-test. Data are plotted as mean ± SD (*p ≤ 0.05; **p = 0.01 – 0.001; ***p < 0.001)
Fig. 8
Fig. 8
SCAT7 is a potential therapeutic target for different tumor types. a Tumor growth in Balb/c nude mice 8 weeks after subcutaneous inoculation of 1 × 106 Csh or SCAT7-sh2 786-O cells (n = 8 each group). b Tumors from Balb/c nude mice after subcutaneous injection of 1 × 106 Csh or SCAT7-sh1 or SCAT7-sh2 A549 cells for 8 weeks (n = 6 for each group). In a and b tumor volumes (cm3) are expressed as mean ± SD, compared with Csh. c Tumor growth inhibition (TGI) for A549 subcutaneous Balb/c nude xenografts treated with 60 pmol of SCAT7 antisense oligonucleotides, LNA-1 and LNA-2, respectively, for a total of four injections (n = 5 for each group). d Average tumor growth of the xenografts treated with control or SCAT7 LNAs was calculated at each injection as follows: Vtx-Vt0. e Real-time qPCR of SCAT7 in A549 tumors collected after treatment with Ctrl-LNA, SCAT7-LNA1, and SCAT7-LNA2. The red bar represents a tumor treated with LNA2, but no downregulation was observed. Values are normalized to endogenous GAPDH. f Scatter plot showing the correlation between SCAT7 expression in vivo and the tumor volumes. The red dot represents the tumor that had no significant downregulation of SCAT7 upon LNA treatment. g Immunohistochemistry images of Ki67 staining and TUNEL assay for A549 xenografts treated with Ctrl-LNA, SCAT7-LNA-1, and SCAT7-LNA-2 (blue: DAPI, green: TUNEL-GFP). h Patient-derived xenograft (PDX) of NSG mice models treated with 100 pmol of Ctrl-LNA or SCAT7-LNA1 for a total of five injections (n = 6 for each group). i Average growth of tumor volumes of the PDX models treated with control or SCAT7 LNAs. j, k Model depicting the functional involvement of SCAT7 in regulating cancer hallmarks (j) and mechanism of FGF/FGFR signaling regulation by SCAT7 (k). The statistical significance shown in be and i was derived using a two-tailed unpaired Student’s t-test. Data are plotted as mean ± SD (*p ≤ 0.05; **p = 0.01 – 0.001; ***p < 0.001)

Comment in

  • S-phase cancer associated lncRNAs.
    Subhash S, Ali MM, Kanduri C. Subhash S, et al. Cell Cycle. 2018;17(23):2517-2519. doi: 10.1080/15384101.2018.1553356. Epub 2018 Dec 3. Cell Cycle. 2018. PMID: 30482083 Free PMC article.

References

    1. Iyer MK, et al. The landscape of long noncoding RNAs in the human transcriptome. Nat. Genet. 2015;47:199–208. doi: 10.1038/ng.3192. - DOI - PMC - PubMed
    1. Kanduri C. Long noncoding RNAs: Lessons from genomic imprinting. Biochim. Biophys. Acta. 2016;1859:102–111. doi: 10.1016/j.bbagrm.2015.05.006. - DOI - PubMed
    1. Mercer TR, Dinger ME, Mattick JS. Long non-coding RNAs: insights into functions. Nat. Rev. Genet. 2009;10:155–159. doi: 10.1038/nrg2521. - DOI - PubMed
    1. Rinn JL, Chang HY. Genome regulation by long noncoding RNAs. Annu. Rev. Biochem. 2012;81:145–166. doi: 10.1146/annurev-biochem-051410-092902. - DOI - PMC - PubMed
    1. Pandey RR, Kanduri C. Transcriptional and posttranscriptional programming by long noncoding RNAs. Prog. Mol. Subcell. Biol. 2011;51:1–27. doi: 10.1007/978-3-642-16502-3_1. - DOI - PubMed

Publication types

MeSH terms