. 2018 Feb 28;9(1):882.
doi: 10.1038/s41467-018-03367-w.

Nanodroplet processing platform for deep and quantitative proteome profiling of 10-100 mammalian cells

Affiliations

Nanodroplet processing platform for deep and quantitative proteome profiling of 10-100 mammalian cells

Ying Zhu et al. Nat Commun. .

Abstract

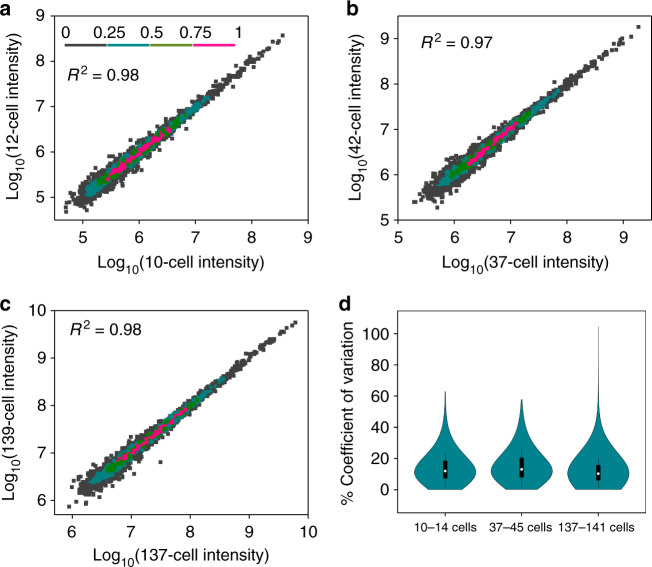
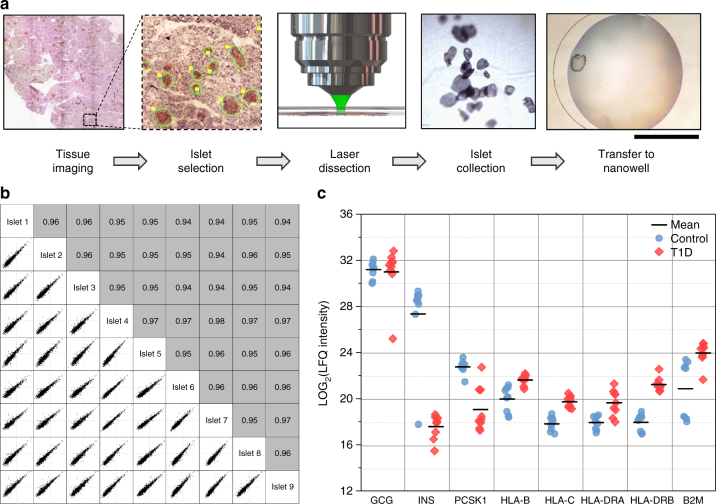
Nanoscale or single-cell technologies are critical for biomedical applications. However, current mass spectrometry (MS)-based proteomic approaches require samples comprising a minimum of thousands of cells to provide in-depth profiling. Here, we report the development of a nanoPOTS (nanodroplet processing in one pot for trace samples) platform for small cell population proteomics analysis. NanoPOTS enhances the efficiency and recovery of sample processing by downscaling processing volumes to <200 nL to minimize surface losses. When combined with ultrasensitive liquid chromatography-MS, nanoPOTS allows identification of ~1500 to ~3000 proteins from ~10 to ~140 cells, respectively. By incorporating the Match Between Runs algorithm of MaxQuant, >3000 proteins are consistently identified from as few as 10 cells. Furthermore, we demonstrate quantification of ~2400 proteins from single human pancreatic islet thin sections from type 1 diabetic and control donors, illustrating the application of nanoPOTS for spatially resolved proteome measurements from clinical tissues.


Conflict of interest statement

The authors declare no competing interests.

Figures

Fig. 1
Fig. 1
Proteomic sample preparation with nanoPOTS. a Schematic drawing and (b) photograph showing the nanoPOTS chip with each nanowell filled with 200 nL of colored dye. The cover slide can be removed and resealed for dispensing and incubation. c One-pot protocol for proteomic sample preparation and capillary-based sample collection
Fig. 2
Fig. 2
Evaluation of sensitivity and reproducibility for the nanoPOTS platform. a Images of 12, 42, and 139 HeLa cells in nanowells before processing and (b) their corresponding base peak chromatograms. The y-axis was held constant to show signal variation with different cell loadings. c Number of unique peptides and (d) proteins identified from different cell loadings. Three samples containing similar cell numbers were grouped together to determine reproducibility. For the 10–14 cells group, the cell numbers were 10, 12, and 14 cells. For 37–45 cells group, the cell numbers were 37, 42, and 45 cells. For 137–141 cells group, the cell numbers were 137, 139, and 141 cells. e Number of unique peptides and (f) proteins identified from cell lysate equivalent to 10, 40, and 140 cells. The cell lysates were prepared in regular Eppendorf low-binding vials with 25 µL of total processing volume. Data are expressed as means ± SD for experimental triplicates. Scale bar in (a) is 500 µm
Fig. 3
Fig. 3
Distribution of protein abundances identified from 10 to 14 HeLa cells. a Identified proteins from among the 40 proteins quantified using the PrEST-SILAC method. b Comparison with the 5443 proteins quantified using the histone-based “proteomic ruler” method. Protein copy numbers per cell were obtained by matching them with previously reported databases
Fig. 4
Fig. 4
Label-free quantification reproducibility. Pairwise correlation of protein LFQ intensities between (a) 10-cell and 12-cell samples, (b) 37-cell and 42-cell samples, (c) 137-cell and 141-cell samples. Data point densities are color-coded as shown in (a). d Violin plot showing the distributions of coefficients of variation of protein LFQ intensities for the three cell loading groups. Center lines show the medians; box limits indicate the 25th and 75th percentiles as determined by R software; whiskers extend 1.5 times the interquartile range from the 25th and 75th percentiles
Fig. 5
Fig. 5
Proteomic profiling of single human pancreatic islet sections. a Schematic workflow showing the identification, laser microdissection, collection, and transfer of human islet sections into nanowells. b Pairwise correlation analysis of protein expression level in nine human islet sections from a non-diabetic donor. c Comparison of protein abundances in single islet sections between a non-diabetic donor (control) and a T1D donor. Scale bar is 500 µm

References

    1. Achim K, et al. High-throughput spatial mapping of single-cell RNA-seq data to tissue of origin. Nat. Biotechnol. 2015;33:503–509. doi: 10.1038/nbt.3209. - DOI - PubMed
    1. Jaitin DA, et al. Massively parallel single-cell RNA-seq for marker-free decomposition of tissues into cell types. Science. 2014;343:776–779. doi: 10.1126/science.1247651. - DOI - PMC - PubMed
    1. Shapiro E, Biezuner T, Linnarsson S. Single-cell sequencing-based technologies will revolutionize whole-organism science. Nat. Rev. Genet. 2013;14:618–630. doi: 10.1038/nrg3542. - DOI - PubMed
    1. Bendall SC, et al. Single-cell mass cytometry of differential immune and drug responses across a human hematopoietic continuum. Science. 2011;332:687–696. doi: 10.1126/science.1198704. - DOI - PMC - PubMed
    1. Smith RD, Shen Y, Tang K. Ultrasensitive and quantitative analyses from combined separations—mass spectrometry for the characterization of proteomes. Acc. Chem. Res. 2004;37:269–278. doi: 10.1021/ar0301330. - DOI - PubMed

Publication types