

Deep Residual Network Predicts Cortical Representation and Organization of Visual Features for Rapid Categorization
- PMID: 29491405
- PMCID: PMC5830584
- DOI: 10.1038/s41598-018-22160-9
Deep Residual Network Predicts Cortical Representation and Organization of Visual Features for Rapid Categorization
Abstract
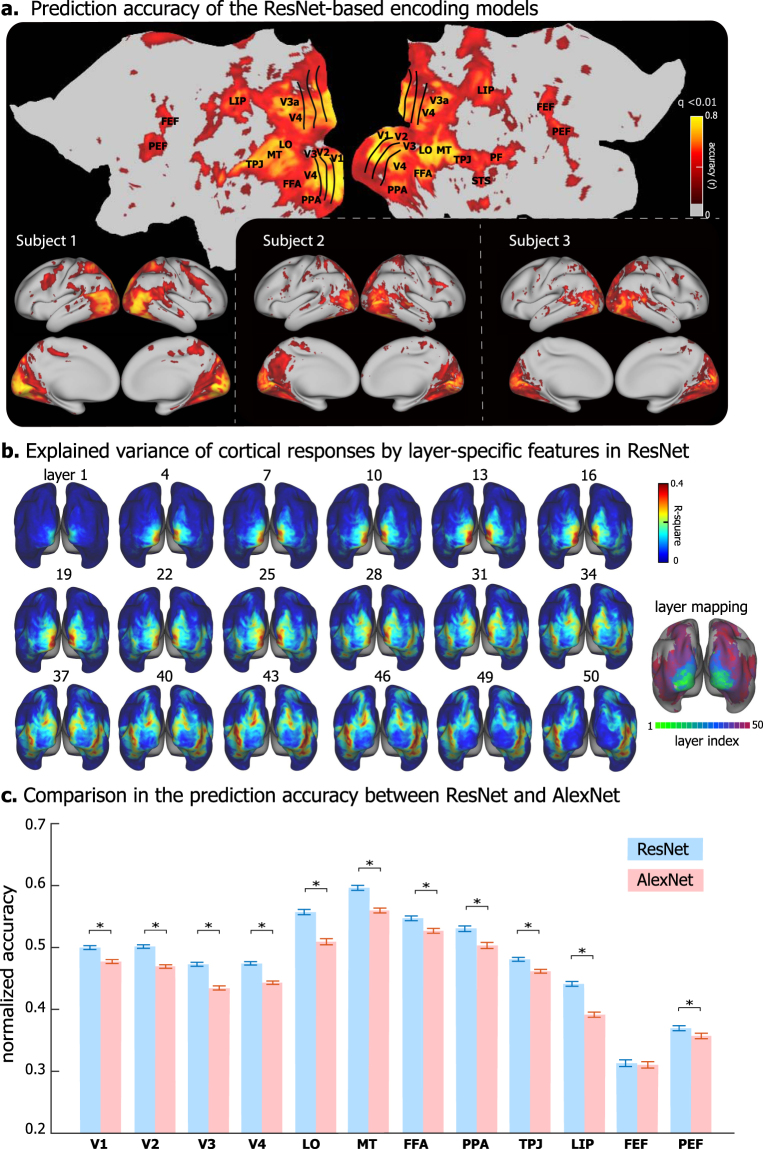
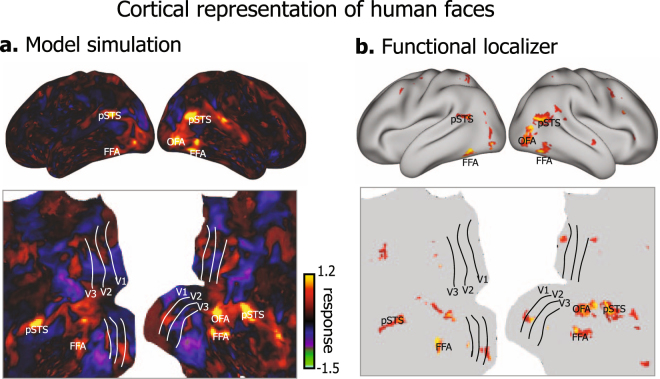
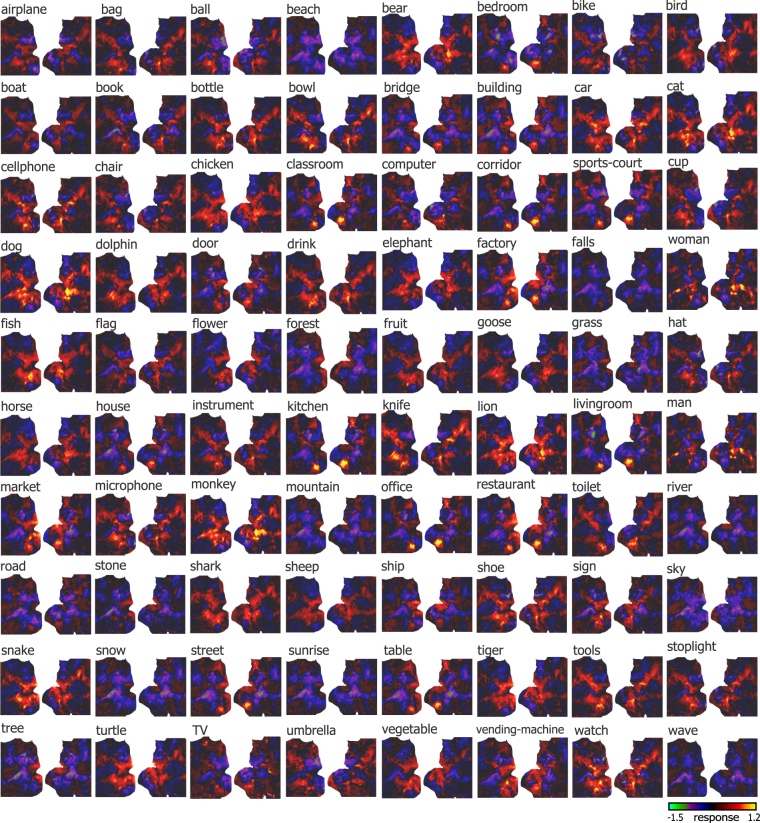
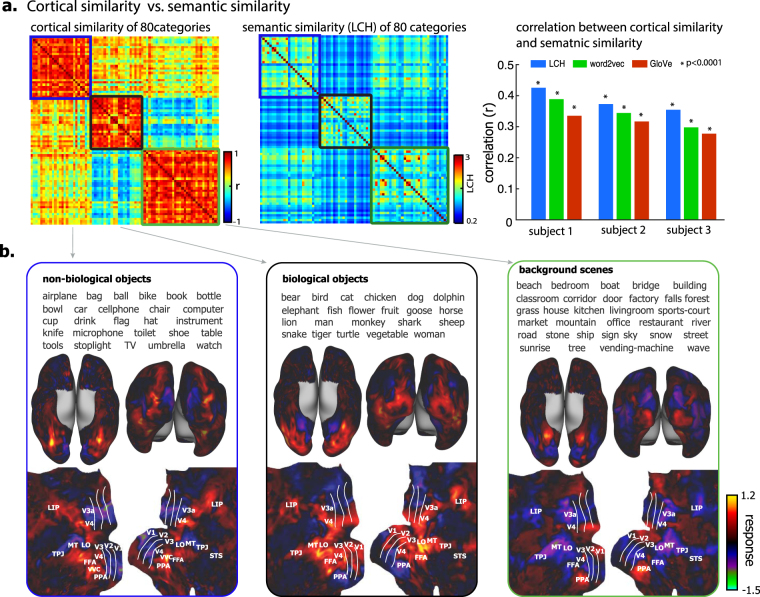
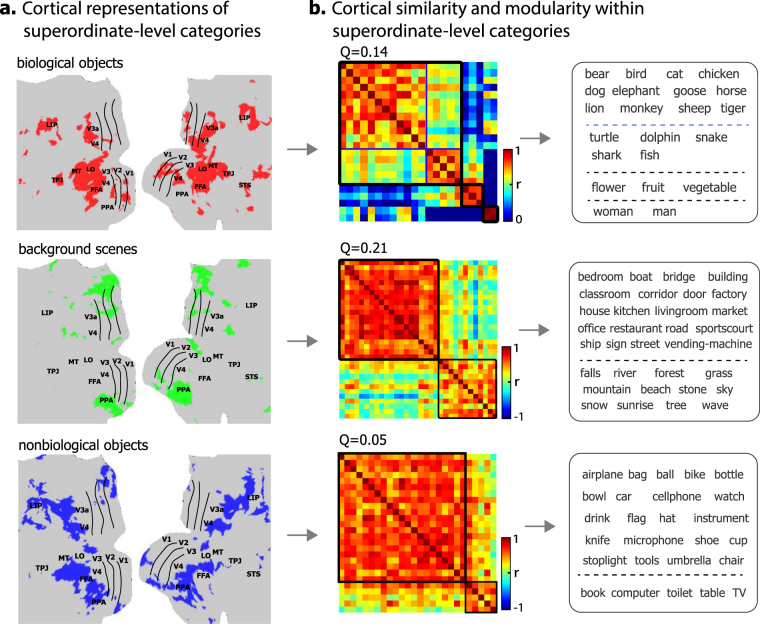
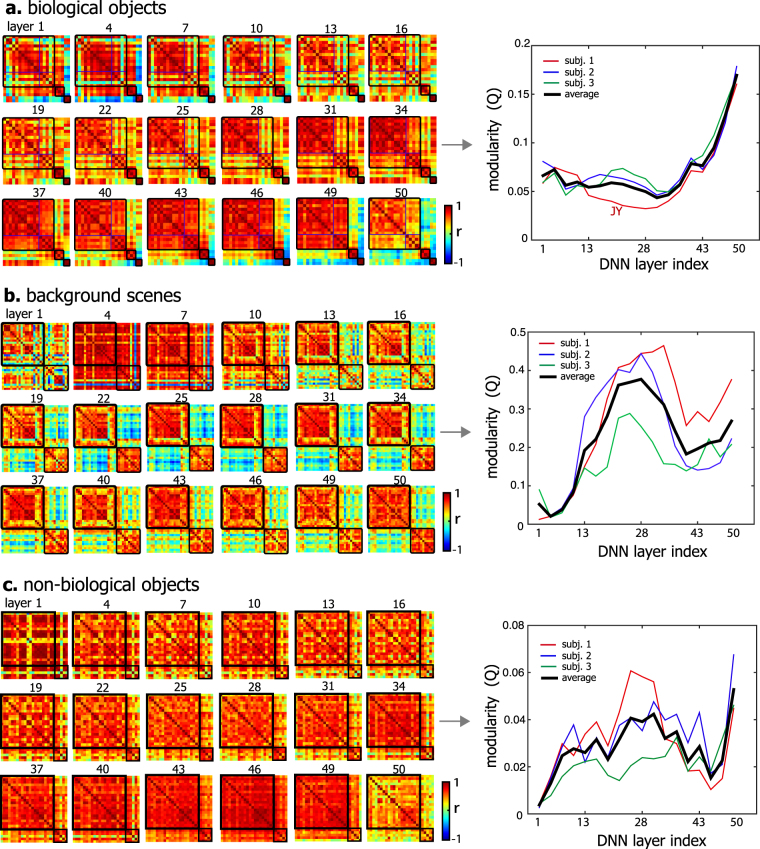
The brain represents visual objects with topographic cortical patterns. To address how distributed visual representations enable object categorization, we established predictive encoding models based on a deep residual network, and trained them to predict cortical responses to natural movies. Using this predictive model, we mapped human cortical representations to 64,000 visual objects from 80 categories with high throughput and accuracy. Such representations covered both the ventral and dorsal pathways, reflected multiple levels of object features, and preserved semantic relationships between categories. In the entire visual cortex, object representations were organized into three clusters of categories: biological objects, non-biological objects, and background scenes. In a finer scale specific to each cluster, object representations revealed sub-clusters for further categorization. Such hierarchical clustering of category representations was mostly contributed by cortical representations of object features from middle to high levels. In summary, this study demonstrates a useful computational strategy to characterize the cortical organization and representations of visual features for rapid categorization.
Conflict of interest statement
The authors declare no competing interests.
Figures


Similar articles
-
The Ventral Visual Pathway Represents Animal Appearance over Animacy, Unlike Human Behavior and Deep Neural Networks.J Neurosci. 2019 Aug 14;39(33):6513-6525. doi: 10.1523/JNEUROSCI.1714-18.2019. Epub 2019 Jun 13. J Neurosci. 2019. PMID: 31196934 Free PMC article.
-
Emergence of Visual Center-Periphery Spatial Organization in Deep Convolutional Neural Networks.Sci Rep. 2020 Mar 13;10(1):4638. doi: 10.1038/s41598-020-61409-0. Sci Rep. 2020. PMID: 32170209 Free PMC article.
-
Texture-like representation of objects in human visual cortex.Proc Natl Acad Sci U S A. 2022 Apr 26;119(17):e2115302119. doi: 10.1073/pnas.2115302119. Epub 2022 Apr 19. Proc Natl Acad Sci U S A. 2022. PMID: 35439063 Free PMC article.
-
Category selectivity in human visual cortex: Beyond visual object recognition.Neuropsychologia. 2017 Oct;105:177-183. doi: 10.1016/j.neuropsychologia.2017.03.033. Epub 2017 Apr 2. Neuropsychologia. 2017. PMID: 28377161 Review.
-
Invariant visual object recognition: a model, with lighting invariance.J Physiol Paris. 2006 Jul-Sep;100(1-3):43-62. doi: 10.1016/j.jphysparis.2006.09.004. Epub 2006 Oct 30. J Physiol Paris. 2006. PMID: 17071062 Review.
Cited by
-
Computational models of category-selective brain regions enable high-throughput tests of selectivity.Nat Commun. 2021 Sep 20;12(1):5540. doi: 10.1038/s41467-021-25409-6. Nat Commun. 2021. PMID: 34545079 Free PMC article.
-
Informed feature regularization in voxelwise modeling for naturalistic fMRI experiments.Eur J Neurosci. 2020 Sep;52(5):3394-3410. doi: 10.1111/ejn.14760. Epub 2020 May 22. Eur J Neurosci. 2020. PMID: 32343012 Free PMC article.
-
Methods for computing the maximum performance of computational models of fMRI responses.PLoS Comput Biol. 2019 Mar 8;15(3):e1006397. doi: 10.1371/journal.pcbi.1006397. eCollection 2019 Mar. PLoS Comput Biol. 2019. PMID: 30849071 Free PMC article.
-
Compression-enabled interpretability of voxelwise encoding models.PLoS Comput Biol. 2025 Feb 19;21(2):e1012822. doi: 10.1371/journal.pcbi.1012822. eCollection 2025 Feb. PLoS Comput Biol. 2025. PMID: 39970189 Free PMC article.
-
Self-supervised Natural Image Reconstruction and Large-scale Semantic Classification from Brain Activity.Neuroimage. 2022 Jul 1;254:119121. doi: 10.1016/j.neuroimage.2022.119121. Epub 2022 Mar 24. Neuroimage. 2022. PMID: 35342004 Free PMC article.
References
Publication types
MeSH terms
Grants and funding
LinkOut - more resources
Full Text Sources
Other Literature Sources
