. 2018 Feb 28;9(1):859.
doi: 10.1038/s41467-017-02809-1.

Sheep genome functional annotation reveals proximal regulatory elements contributed to the evolution of modern breeds

Affiliations

Sheep genome functional annotation reveals proximal regulatory elements contributed to the evolution of modern breeds

Marina Naval-Sanchez et al. Nat Commun. .

Abstract

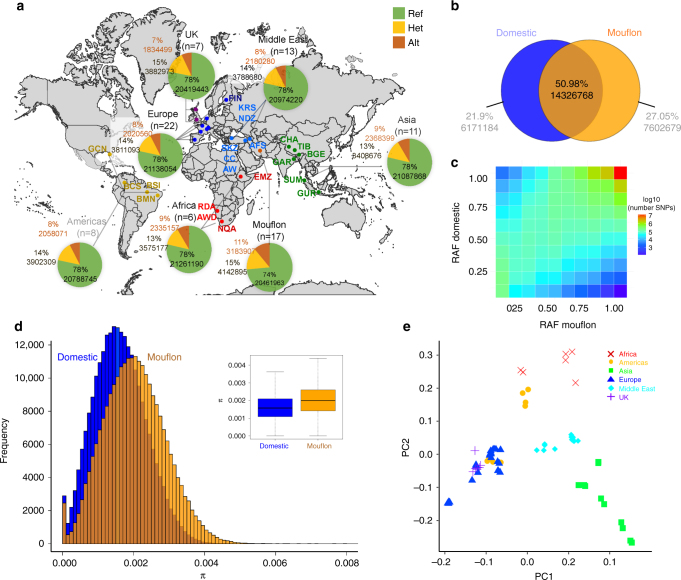
Domestication fundamentally reshaped animal morphology, physiology and behaviour, offering the opportunity to investigate the molecular processes driving evolutionary change. Here we assess sheep domestication and artificial selection by comparing genome sequence from 43 modern breeds (Ovis aries) and their Asian mouflon ancestor (O. orientalis) to identify selection sweeps. Next, we provide a comparative functional annotation of the sheep genome, validated using experimental ChIP-Seq of sheep tissue. Using these annotations, we evaluate the impact of selection and domestication on regulatory sequences and find that sweeps are significantly enriched for protein coding genes, proximal regulatory elements of genes and genome features associated with active transcription. Finally, we find individual sites displaying strong allele frequency divergence are enriched for the same regulatory features. Our data demonstrate that remodelling of gene expression is likely to have been one of the evolutionary forces that drove phenotypic diversification of this common livestock species.


Conflict of interest statement

The authors declare no competing financial interests.

Figures

Fig. 1
Fig. 1
Genome diversity and relatedness of wild and domestic sheep. a The geographic distribution of 43 breeds sampled for whole-genome sequencing. Population based proportion of allele type is given for each major geographic group of breeds, after calling reference variants present in the Texel derived genome assembly OARv3.1. b Proportion and number of private and shared SNP for the collection of wild and domestic sheep genomes. c Reference allele frequency (RAF) correlation between domestic and mouflon populations. RAF domestic and mouflon represent the frequency of the reference allele in domestic and mouflon populations respectively. (Pearson correlation: 76.36% p-value <2.2E−16). d Distribution of nucleotide diversity (π) within species, estimated within 20 kb bins. The boxplot compares the bin mean and variance. The distribution means, evaluated using the Wilcoxon rank-sum test, are significantly difference (p-value <2.2E−16). e Principal component (PC) analysis clustering individual domestic sheep coloured to reflect the geographic origin of breed development
Fig. 2
Fig. 2
Genomic regions putatively under positive selection in sheep. a Population differentiation (FST) and relative nucleotide diversity between wild and domestic sheep (πmouflon/πdomestic) was estimated in 20 kb genomic bins. A total of 1420 outlier bins exhibiting evidence for selection in domestic sheep genomes are indicated in red (corresponding to Z-test P < 0.001, where FST > 0.156 and ln ratio >0.672). b Genome-wide distribution of relative nucleotide diversity. Positive values identify genomic bins with depressed diversity in domestic sheep compared with mouflon, consistent with positive selection sweeps involved with domestication and selection (Table 1, Supplementary Table 4). c Selective sweeps located either side of KITLG coding exons. Integrated Genome Visualisation (IGV) screenshot of chromosome 3:124236035–125400001 illustrates the reduction of SNP variation in 67 domestic genomes compared with 17 Mouflon. The two regions identified by our selection metrics are shown inside the dashed red boxes
Fig. 3
Fig. 3
Prediction and validation of sheep gene regulatory elements. a Human Epigenome Roadmap chromatin states and ENCODE features used in a reciprocal liftOver protocol to predict regulatory regions in sheep. b Overlap between chromosomal locations identified by experimental sheep tissue ChIP-Seq (H3K4me3 and H3K27ac) and regions predicted by liftOver. H3K4me3 peaks are compared against predicted Roadmap chromatin state TssA identifying active promoters (left) and unique H3K27ac peaks are compared to the Roadmap Enh state, excluding those regions overlapping with predicted TssAs, identifying distal enhancers (right). c The proportion of predicted promoters (left) and enhancers (right) recovered by ChIP-Seq using either H3K4me3 peaks (blue bar) or unique H3K27ac peaks (orange bar). This demonstrates the predicted annotations retain a level of specificity between components of the gene regulatory apparatus. d An example annotated region containing LCORL highlights the correspondence between ChIP-Seq data (Sheep H3K27ac) and liftOver predictions (TSSA, TSSAFlnk, ENCODE proximal, Enh, ENCODE distal)
Fig. 4
Fig. 4
Genomic feature enrichment in selection sweeps and differentiated sites. a Strength of enrichment for 29 genome features within 1420 sweep bins assessed by location overlap. Genome features were derived from four different sources. The significance threshold from multiple testing is represented by the horizontal line. b Intersection of delta allele frequency (ΔAF) with protein coding gene annotations from reference OARv3.1. The number of SNP in ΔAF bins is given at left, and the M-value (at right) was calculated by comparing the frequency of SNP in each genome feature and ΔAF bin with the corresponding frequency across all bins. c As for b using chromatin state annotations derived from the Roadmap dataset. Additional M-value results using predicted ENCODE marks are provided in Supplementary Fig. 13
Fig. 5
Fig. 5
Candidate causal missense mutation in FBXL3. a FBXL3 gene representation in human hg19 coordinates chr13:77579389-77601337. b Multiple sequence alignment of SNP across representative vertebrates. c Allele frequency of the G (reference) or A (alternative) allele in domestic sheep (O. aries) (n = 67) or mouflon (O. orientalis) (n = 17). d FBXL3 amino acid sequence with the substitution at residue 182 highlighted in red. Residue 358 (green) is associated with the mouse After hour (Afh) phenotype residue 364 with the overtime phenotype (Ovt)

References

    1. Diamond J. Evolution, consequences and future of plant and animal domestication. Nature. 2002;418:700–707. doi: 10.1038/nature01019. - DOI - PubMed
    1. Larson G, et al. Current perspectives and the future of domestication studies. Proc. Natl Acad. Sci. USA. 2014;111:6139–6146. doi: 10.1073/pnas.1323964111. - DOI - PMC - PubMed
    1. Ramey HR, et al. Detection of selective sweeps in cattle using genome-wide SNP data. BMC Genom. 2013;14:382. doi: 10.1186/1471-2164-14-382. - DOI - PMC - PubMed
    1. Kijas JW, et al. Genome-wide analysis of the world’s sheep breeds reveals high levels of historic mixture and strong recent selection. PLoS Biol. 2012;10:e1001258. doi: 10.1371/journal.pbio.1001258. - DOI - PMC - PubMed
    1. Elferink MG, et al. Signatures of selection in the genomes of commercial and non-commercial chicken breeds. PLoS ONE. 2012;7:e32720. doi: 10.1371/journal.pone.0032720. - DOI - PMC - PubMed

Publication types