. 2018 Feb 28;8(1):3798.
doi: 10.1038/s41598-018-22047-9.

Absence of Claudin 11 in CNS Myelin Perturbs Behavior and Neurotransmitter Levels in Mice

Affiliations

Absence of Claudin 11 in CNS Myelin Perturbs Behavior and Neurotransmitter Levels in Mice

Kathleen J Maheras et al. Sci Rep. .

Abstract

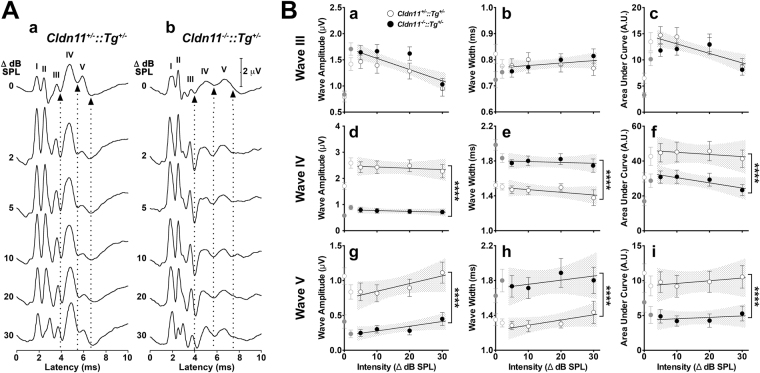
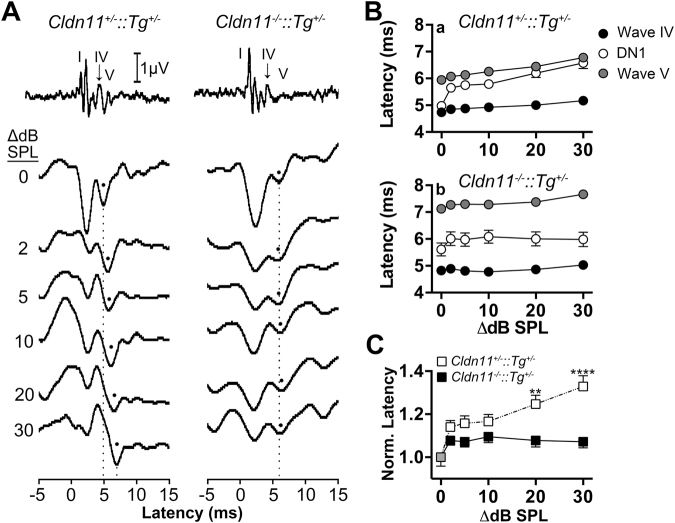
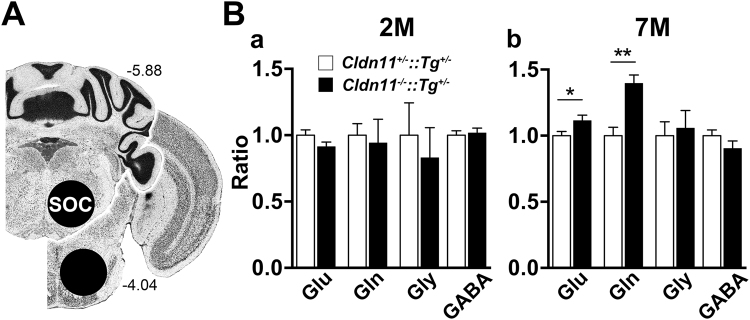
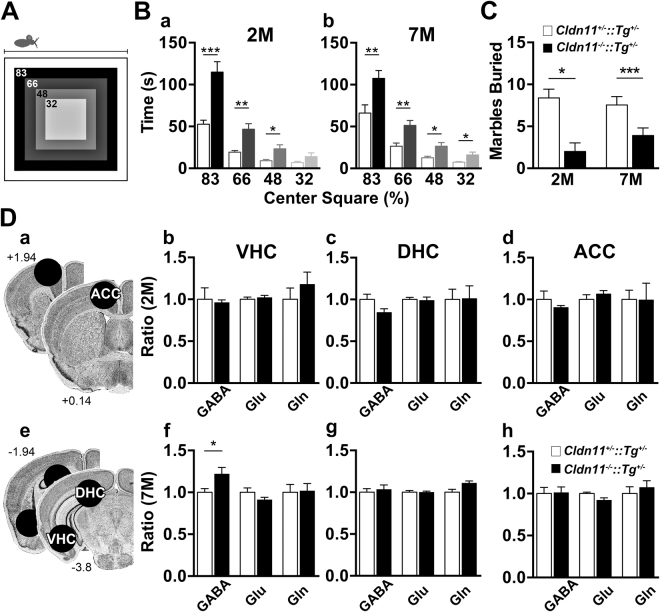
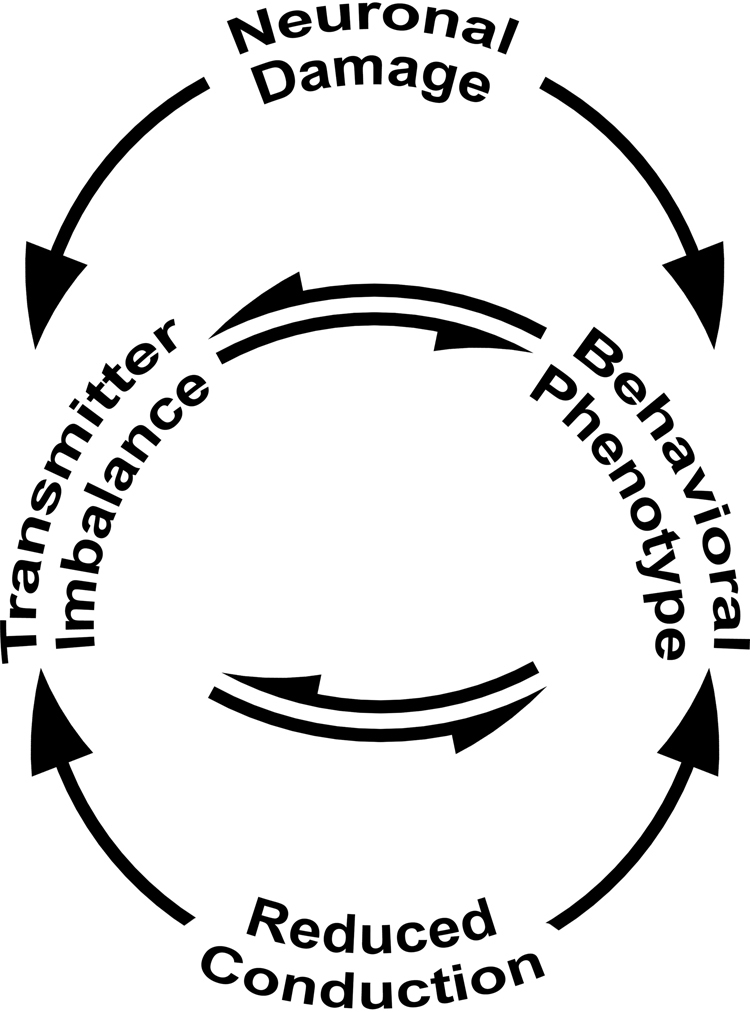
Neuronal origins of behavioral disorders have been examined for decades to construct frameworks for understanding psychiatric diseases and developing useful therapeutic strategies with clinical application. Despite abundant anecdotal evidence for white matter etiologies, including altered tractography in neuroimaging and diminished oligodendrocyte-specific gene expression in autopsy studies, mechanistic data demonstrating that dysfunctional myelin sheaths can cause behavioral deficits and perturb neurotransmitter biochemistry have not been forthcoming. At least in part, this impasse stems from difficulties in identifying model systems free of degenerative pathology to enable unambiguous assessment of neuron biology and behavior in a background of myelin dysfunction. Herein we examine myelin mutant mice lacking expression of the Claudin11 gene in oligodendrocytes and characterize two behavioral endophenotypes: perturbed auditory processing and reduced anxiety/avoidance. Importantly, these behaviors are associated with increased transmission time along myelinated fibers as well as glutamate and GABA neurotransmitter imbalances in auditory brainstem and amygdala, in the absence of neurodegeneration. Thus, our findings broaden the etiology of neuropsychiatric disease to include dysfunctional myelin, and identify a preclinical model for the development of novel disease-modifying therapies.


Conflict of interest statement

The authors declare no competing interests.

Figures

Figure 1
Figure 1
Key nuclei and fiber tracts for binaural transmission in adult mouse auditory brainstem. (A) Calbindin staining labels most of the key bilateral brainstem nuclei in the superior olivary complex (SOC). Principal neurons of the medial nuclei of the trapezoid body (MNTB) are nearest to the midline and form the calyxes of Held. The lateral superior olive (LSO) are the lateral nuclei, and are major signal integrators of binaural signals from the cochleae. The medial superior olive (MSO, not labeled) is poorly developed in mice (approximately 200 neurons) and may only play a minor role in integrating binaural signals. The periolivary nuclei (PON) are likely modulatory but their dispersed cell bodies suggests they generate signals with insufficient synchrony to be detected in far field recordings such as ABRs. (B) Lower brainstem schematic of three major myelinated fiber tracts and their connections that transmit binaural information to principal cell integrators in the LSO. Only the fiber tracts from the left cochlea to the right LSO (comprising the contralateral pathway), and the right cochlea to the right LSO (the ipsilateral pathway), are shown for clarity. The AVCN – MNTB tract of the trapezoid body (blue) is comprised of large diameter axons and transmits contralateral signals using the excitatory neurotransmitter glutamate; the MNTB – LSO tract (pink) is comprised of intermediate size axons and relays ipsilateral inhibitory signals (glycinergic) in adults; the AVCN – LSO tract (green) is comprised of small axons and transmits excitatory ipsilateral signals (glutamatergic). Each of these nuclei are signal generators for ABR waves. Thus, the cochlear nucleus is associated with wave II, the MNTB with wave III and the SOC with wave IV. Wave V arises from the transmission of signals to the inferior colliculus. Scale bar, 200 μm. Insert in A: Image Credit, Allen Institute.
Figure 2
Figure 2
Myelinated axons in the auditory pathway. (A) Representative sagittal brainstem section of the trapezoid body fiber tract (see insert). Anti-neurofilament light chain (NFL, red) antibodies label all axons. The major structural myelin protein, myelin basic protein (MBP) labels myelin sheaths (green) and nuclei are labeled with DAPI (blue). Distinct transverse fiber bundles are shown, cut in cross-section. The arrowhead and arrow show small (1 μm) and large (5 μm) diameter transverse fibers. (B) Proportion of myelinated fibers traversing the trapezoid body tract in (Ba) Cldn11+/−::Tg+/− and (Bb) Cldn11−/−::Tg+/− mice. We quantified fibers from a single sagittal section/mouse (−), which was medial to MNTB principal neuron cell bodies in the calyx of Held and included contralateral afferents from the cochlear nucleus. We also quantified fibers from 3 sections/mouse, spaced 50 μm apart (+), within the MNTB and included calyx of Held principal neuron cell bodies. Data plotted as mean ± SEM; n = 3 fields/slide totaling ~150 axons. Scale bars, 20 μm. Insert in A: Image Credit, Allen Institute.
Figure 3
Figure 3
Morphometric analyses of auditory brainstem fiber tracts reveal contralateral axons are large diameter and ipsilateral axons are small. (A) Within the MNTB, a representative contralateral dextran labeled fiber (green) is seen forming the characteristic calyx of Held synapse around a Calbindin + MNTB principal cell (red). Nuclei are stained using DAPI (blue). (B) Distribution of contralateral diameters from dextran-dye labeled axons. The histogram is comprised of 59 axons from 3 mice, 0.2 μm bins, and fit with a normal Gaussian distribution. Mean contralateral fiber diameter is considered large: 3.3 μm. The Q-Q plot (inset) shows most residuals are distributed along the Gaussian diagonal within the 95% confidence envelope (parametric bootstrapping, red dashed lines) as expected for a unimodal distribution. (C) Representative ipsilateral fibers (green) are seen entering the LSO outlined by Calbindin staining (red, white dots). Nuclei are stained using DAPI (blue). (D) Distribution of ipsilateral diameters from dextran-dye labeled axons viewed entering the LSO. Histogram is comprised of 73 axons from 5 mice, 0.2 μm bins, and fit with a normal Gaussian distribution. Mean ipsilateral axon diameter is considered small: 0.91 μm and the Q-Q plot indicates a unimodal distribution. Scale bars, 20 μm.
Figure 4
Figure 4
The Tg(Cldn11)605Gow transgene (Tg+/−) restores hearing thresholds, but not wave V latencies in Cldn11−/−::Tg+/− mice. (A) Representative ABR series from Cldn11+/−::Tg+/−, Cldn11−/− and Cldn11−/−::Tg+/− mice at 32 kHz. Wave guidelines in each series highlight the right-shift in wave latency as stimulus intensity decreases for waves I, III, and V. Bold white ‘X’ emphasizes wave V latency at 80 dB SPL for each threshold series. (B) Quantified latency/intensity series for Cldn11+/−::Tg+/− and Cldn11−/−::Tg+/− mice for ABR wave traces at 32 kHz; 80–40 dB SPL. Peripherally-derived wave I latency-intensity shifts (Ba) are similar between Cldn11+/−::Tg+/− and Cldn11−/−::Tg+/− mice [F(1,20) = 0.13, p = 0.72]. Centrally-derived waves II (Bb), III (Bc) and IV (Bd) are also comparable [F(1,20) = 0.625, p = 0.25, F(1,20) = 0.14, p = 0.71 and F(1,20) = 2.36, p = 0.14 respectively]; however wave V latency-intensity shifts (Be) are significantly increased at each stimulus intensity [F(1,20) = 37.3, p < 0.0001]. Data plotted as mean ± SEM 10 ≤ n ≤ 12; ****p < 0.0001. (C,D) ABR series at 16 (C) and 8 kHz (D) from the mice in (A), are similar to the 32 kHz data, reflecting transgene-mediated rescue of peripheral hearing across much of the frequency spectrum.
Figure 5
Figure 5
Altered temporal-dispersion of latter binaural ABR waves in Cldn11−/−::Tg+/− mice. (A) Representative binaural ABR wave graphs from 6–8 week old (a) control Cldn11+/−::Tg+/− and (b) Cldn11−/−::Tg+/− mice showing changes in ABRs with sound lateralization between 0–30 dB SPL. ABR waves I–V are indicated by roman numerals. Arrowheads and dotted lines show the latencies for the minima of waves III-V (designated waves III’–V’). The widths of waves IV and V appear to be larger for the mutants than the controls, which suggests temporal dispersion. (B) Evolution of the characteristics of waves III – V with sound lateralization from 0–30 dB SPL. (a,d,g) Amplitudes for waves III – V measured from each wave maxima to the succeeding III’–V’ troughs. Amplitudes of waves III are comparable for controls versus Cldn11−/−::Tg+/− mice as sound is lateralized [F(2,83) = 2.59, p = 0.08], but we observe significant decreases for waves IV [F(2,83) = 107.6, p < 0.0001] and V [F(2,82) = 38.4, p < 0.0001]. (b,e,h) Widths of waves III – V measured between the preceding and succeeding wave trough minima. Widths of waves III are consistent between genotypes [F(2,83) = 1.42, p < 0.25], but there are significant increases for waves IV [F(2,83) = 32.9, p < 0.0001] and V [F(2,82) = 15.5, p < 0.0001]. (c,f,i) Area under the curve for waves III–V measured with baselines drawn between the preceding and succeeding troughs. Areas are indistinguishable for waves III [F(2,80) = 1.47, p = 0.24] but are increased for waves IV [F(2,80) = 12.8, p < 0.0001] and V [F(2,80) = 17.9, p < 0.0001]. Data points from 5–30 dB SPL intensity differences analyzed using linear regression least-squares fits to determine if the slopes and Y-intercepts differ between control (n = 10) and mutant (n = 11–12) mice. Stippled regions reflect 95% confidence intervals for the linear regression fits. Slopes and Y-intercepts are indistinguishable between genotypes for all wave III characteristics [F(2,80–82); p > 0.08]. Slopes and Y-intercepts are not shared between genotypes for any characteristics of waves IV or V [F(2,80–83); p < 0.0001]. The Y-intercepts show lower amplitudes for the knockouts (wave IV = 32%; wave V = 28%), increased wave widths (wave IV = 120%; wave V = 139%) and reduced areas under the curve (wave IV = 72%; wave V = 47%). Data in (B) plotted as mean ± SEM.
Figure 6
Figure 6
Cldn11−/−::Tg+/− mice exhibit abnormal sound lateralization. (A) Representative binaural interaction component (BIC) traces from Cldn11+/−::Tg+/− and Cldn11−/−::Tg+/− mice calculated for stimulus intensity differences between each ear of 0–30 dB SPL. Black dots identify the processed binaural output from those intensity differences, which are the DN1 troughs. Monaural ABR traces (top) are in temporal alignment with the BICs to highlight the latency of the processed binaural DN1 trough, which occurs between monaural evoked latencies of waves IV and V. Dashed lines highlight the latency of DN1 for Cldn11+/−::Tg+/− mice as sound is lateralized (Δ0 to Δ30 dB SPL respectively) and draw attention to the lack of shift in Cldn11−/−::Tg+/− mice. (B) Latency/intensity series comparing latency of ABR waves IV (black circles) and V (grey circles) to the calculated DN1 trough (white circles) for (Ba) Cldn11+/−::Tg+/− and (Bb) Cldn11−/−::Tg+/− mice. Note the pathological increased wave V latency for Cldn11−/−::Tg+/− mice. (C) Comparison of DN1 trough latencies for Cldn11+/−::Tg+/− and Cldn11−/−::Tg+/− mice. Lateralized DN1 trough latencies (Δ2–30 dB SPL) were normalized to the midline response latency (Δ0 dB SPL) for each animal. As sound is lateralized, the DN1 interaction trough latency is significantly different between Cldn11+/−::Tg+/− and Cldn11−/−::Tg+/− mice [F(1,20) = 10.3, p = 0.005]. Grey circles represent the normalized value for both Cldn11+/−::Tg+/− and Cldn11−/−::Tg+/− mice. Data plotted as mean ± SEM; 10 ≤ n ≤ 12; **p < 0.01, ****p < 0.0001.
Figure 7
Figure 7
1H-MRS analysis of the SOC indicates altered neurotransmitter levels in Cldn11−/−::Tg+/− mice. (A) Schematic demarcating the rostral/caudal Bregma boundaries of brain slices and SOC tissue punch locations for ex vivo neurochemistry analysis using magic-angle 1H-MRS at 11.7 Tesla. (B) Select metabolite analysis in Cldn11+/−::Tg+/− and Cldn11−/−::Tg+/− mice. (Ba) Relevant inhibitory and excitatory neurotransmitter levels normalized to creatine in 2 month old (2 M) SOC. No changes in neurotransmitter level are observed for glutamate [t(9) = 1.58, p = 0.15], glutamine [t(9) = 0.308, p = 0.77], glycine [t(9) = 0.512, p = 0.63], or GABA [t(9) = 0.334, p = 0.75]. (Bb) Relevant inhibitory and excitatory neurotransmitter levels normalized to creatine in 7 M SOC. Significant increases in glutamate [t(9) = 2.24, p = 0.048] and its precursor glutamine [t(9) = 4.40, p = 0.0013] were detected, but inhibitory neurotransmitter levels remain similar; glycine: t(9) = 0.332, p = 0.747, GABA: t(9) = 1.33, p = 0.21. Neurochemical levels for each mouse are internally normalized to creatine and Cldn11−/−::Tg+/− values are expressed relative to Cldn11+/−::Tg+/− and plotted as mean ± SEM; n = 6; *p < 0.05, **p < 0.01. Panel A: Image Credit, Allen Institute.
Figure 8
Figure 8
Cldn11-/–::Tg+/− mice have a decreased anxiety-like endophenotype. (A) Schematic depicting the open field (OF) arena and four virtual concentric center squares. (B) Analyses for each virtual center square for Cldn11+/−::Tg+/− and Cldn11−/−::Tg+/− mice at (Ba) 2 month old (2 M) and (Bb) 7 M. At both ages, Cldn11−/−::Tg+/− mice spend significantly more time near the center of the arena compared to controls. At 2 M: 83%, t(17) = 4.50, p = 0.0003; 63%, t(17) = 3.78, p = 0.0015; 48%, t(17) = 2.66, p = 0.017; 32%, t(17) = 1.41, p = 0.18. At 7 M: 83%, t(18) = 3.07 p = 0.007; 63%, t(18) = 3.35, p = 0.004; 48%, t(18) = 2.75, p = 0.014; 32%, t(18) = 2.49, p = 0.024. (C) Marble burying (MB) analyses for Cldn11+/−::Tg+/− and Cldn11−/−::Tg+/− mice at 2 and 7 M. The Cldn11−/−::Tg+/− mice bury significantly fewer marbles than controls at both ages [2 M, t(17) = 2.72, p = 0.015; 7 M, t(18) = 4.40, p = 0.0003], which corroborates the reduced anxiety phenotype. (D) Analysis of key brain regions relevant to anxiety state for Cldn11+/−::Tg+/− and Cldn11−/−::Tg+/− mice. (Da,e) Schematics delineate rostral and caudal stereotaxic boundaries (with respect to Bregma) and tissue punch locations for ex vivo analysis of 19 neurochemicals (normalized to creatine levels) using 1H-MRS at 500 MHz (11.7 Tesla). (Db–d) Relative inhibitory and excitatory neurotransmitter levels measured at 2 M in amygdala/ventral hippocampus (VHC) (b), dorsal hippocampus (DHC) (c) and anterior cingulate cortex (ACC) (d). Similar levels of all neurotransmitters are observed between Cldn11+/−::Tg+/− and Cldn11−/−::Tg+/− mice [VHC: GABA, t(10) = 0.27, p = 0.79; Glu, t(10) = 0.54, p = 0.60, Gln, t(10) = 0.90, p = 0.39. DHC: GABA, t(10) = 2.10, p = 0.065; Glu: t(10) = 0.24, p = 0.82; Gln: t(10) = 0.06, p = 0.96. ACC: GABA, t(10) = 0.33, p = 0.75; Glu, t(10) = 1.58, p = 0.15; Gln, t(10) = 0.31, p = 0.77]. (Df–h) Relative inhibitory and excitatory neurotransmitter levels measured at 7 M in VHC (b), DHC (c) and ACC (d). GABA levels are significantly increased in VHC of Cldn11−/−::Tg+/− mice [t(9) = 1.50, p = 0.034] but normal in DHC [t(9) = 0.49, p = 0.64] and ACC [t(9) = 0.112, p = 0.91]. Excitatory neurotransmitters are comparable to controls [VHC: Glu, t(9) = 1.36, p = 0.21; Gln, t(9) = 0.132, p = 0.90. DHC: Glu, t(9) = 0.037, p = 0.97; Gln, t(9) = 2.43, p = 0.038. ACC: Glu, t(9) = 2.30, p = 0.05; Gln, t(9) = 0.630, p = 0.54]. Neurochemical levels for each mouse are internally normalized to creatine and Cldn11−/−::Tg+/− values are expressed relative to Cldn11+/−::Tg+/− and plotted as mean ± SEM; 5 ≤ n ≤ 6; *p < 0.05, **p < 0.01. Panels Da and De: Image Credit, Allen Institute.
Figure 9
Figure 9
Mechanisms of altered behavior and neurochemistry. The disconnection hypothesis highlights the importance of temporally-coordinated sensory information transfer and processing in spatially-distributed brain circuits for normal behavior. In this framework, psychiatric disease is proposed to arise from the disconnection of different brain regions, and well-known mechanisms include abnormal neuronal targeting during development, loss of cortical or other types of neurons and neurotransmitter imbalances. The schematic includes an additional mechanism by which neural circuits can be disconnected, embodied by the disconnection syndrome,. This mechanism is demonstrated for two brain regions in the current study, whereby altered transmission time along myelinated axons disrupts communication within spatially distributed circuits. We demonstrate that different neurotransmitter systems are impacted in the different brain regions and that temporal disconnection, even in the absence of degeneration, causes behavioral changes and neurotransmitter imbalance.

References

    1. Friston KJ. The disconnection hypothesis. Schizophr Res. 1998;30:115–125. doi: 10.1016/S0920-9964(97)00140-0. - DOI - PubMed
    1. Schwartz AB. Movement: How the Brain Communicates with the World. Cell. 2016;164:1122–1135. doi: 10.1016/j.cell.2016.02.038. - DOI - PMC - PubMed
    1. Woolley DW, Shaw E. A Biochemical and Pharmacological Suggestion About Certain Mental Disorders. Proc Natl Acad Sci USA. 1954;40:228–231. doi: 10.1073/pnas.40.4.228. - DOI - PMC - PubMed
    1. Williams RW, Herrup K. The control of neuron number. Annu Rev Neurosci. 1988;11:423–453. doi: 10.1146/annurev.ne.11.030188.002231. - DOI - PubMed
    1. Flagstad P, et al. Disruption of neurogenesis on gestational day 17 in the rat causes behavioral changes relevant to positive and negative schizophrenia symptoms and alters amphetamine-induced dopamine release in nucleus accumbens. Neuropsychopharmacology. 2004;29:2052–2064. doi: 10.1038/sj.npp.1300516. - DOI - PubMed

Publication types

LinkOut - more resources