. 2018 Feb 28;8(1):3825.
doi: 10.1038/s41598-018-22051-z.

New thin-film surface electrode array enables brain mapping with high spatial acuity in rodents

Affiliations

New thin-film surface electrode array enables brain mapping with high spatial acuity in rodents

W S Konerding et al. Sci Rep. .

Abstract

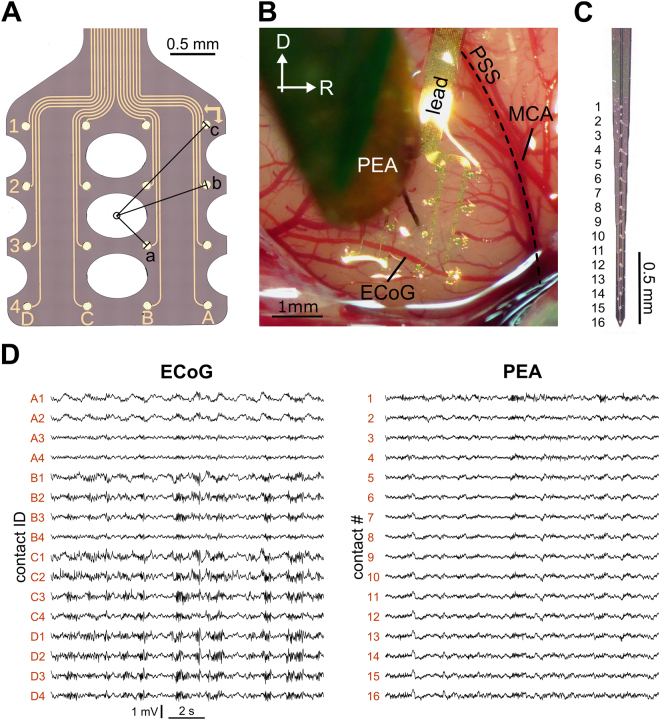
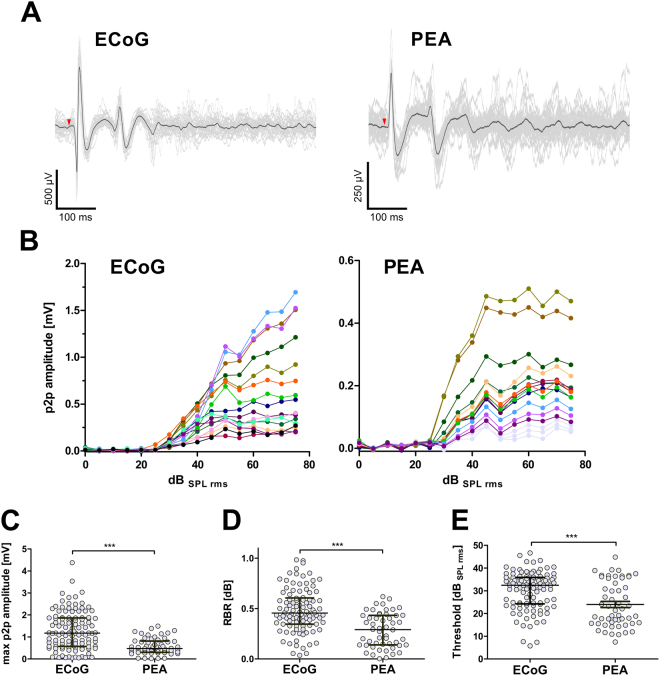
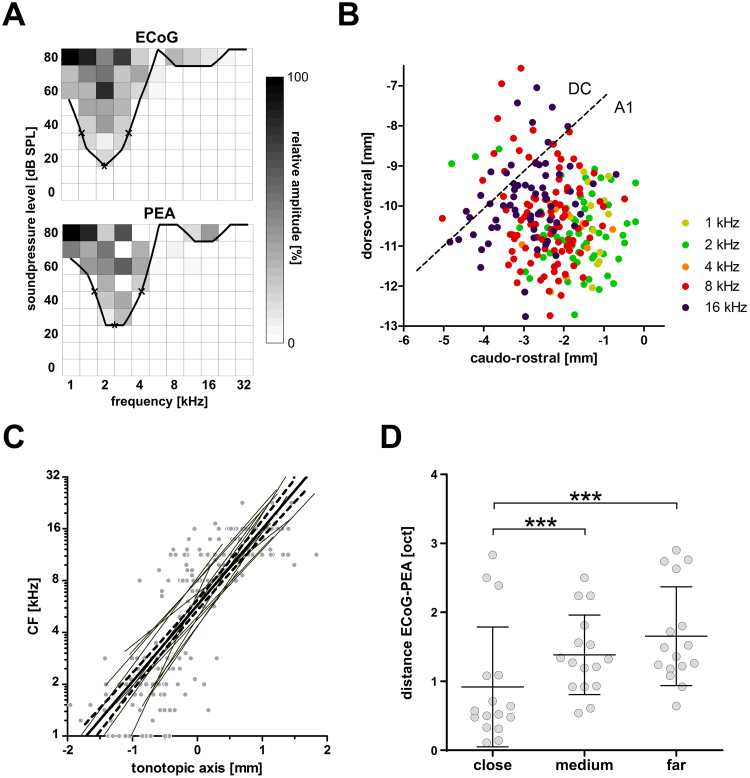
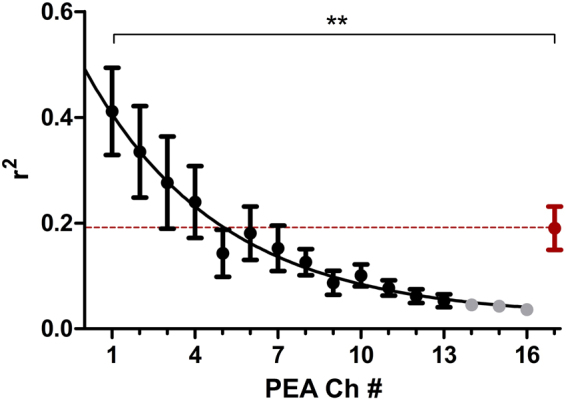
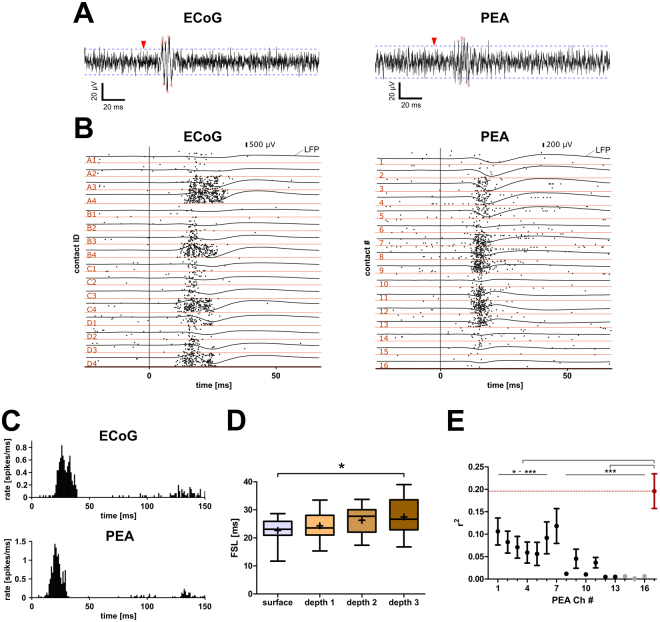
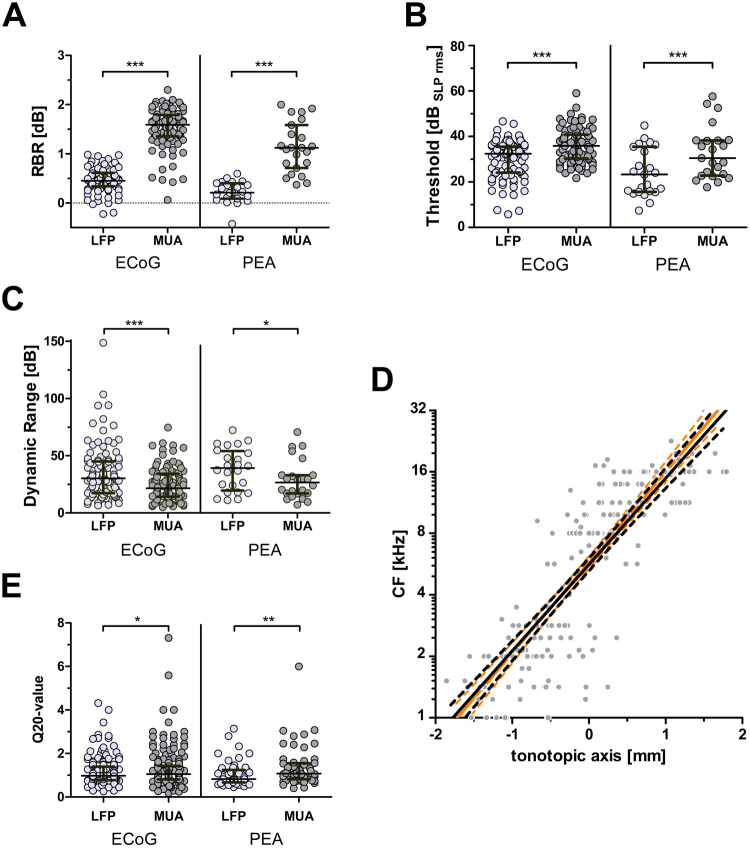
In neuroscience, single-shank penetrating multi-electrode arrays are standard for sequentially sampling several cortical sites with high spatial and temporal resolution, with the disadvantage of neuronal damage. Non-penetrating surface grids used in electrocorticography (ECoG) permit simultaneous recording of multiple cortical sites, with limited spatial resolution, due to distance to neuronal tissue, large contact size and high impedances. Here we compared new thin-film parylene C ECoG grids, covering the guinea pig primary auditory cortex, with simultaneous recordings from penetrating electrode array (PEAs), inserted through openings in the grid material. ECoG grid local field potentials (LFP) showed higher response thresholds and amplitudes compared to PEAs. They enabled, however, fast and reliable tonotopic mapping of the auditory cortex (place-frequency slope: 0.7 mm/octave), with tuning widths similar to PEAs. The ECoG signal correlated best with supragranular layers, exponentially decreasing with cortical depth. The grids also enabled recording of multi-unit activity (MUA), yielding several advantages over LFP recordings, including sharper frequency tunings. ECoG first spike latency showed highest similarity to superficial PEA contacts and MUA traces maximally correlated with PEA recordings from the granular layer. These results confirm high quality of the ECoG grid recordings and the possibility to collect LFP and MUA simultaneously.


Conflict of interest statement

At the time of the ECoG development, U.P.F. was employed by Blackrock Microsystems Europe. The authors declare no further conflict of interest. This project was supported by the German Federal Ministry of Education and Research KMU-Innovativ: Medizintechnik FKZ 13GW0050B and by the Deutsche Forschungsgemeinschaft (DFG) EXC 1077/1 Hearing4all. Other than providing financial support, the funding sources had no part in the study.

Figures

Figure 1
Figure 1
Recordings from the newly developed ECoG grid were possible for all 16 surface contacts and were similar to simultaneous recordings from a conventional penetrating multi-electrode array. (A) Sketch of the subdural ECoG grid. Markers on the grid facilitate the allocation to the respective surface locations. The distances to the central insertion point are indicated (a = 0.5 mm, b = 1.0 mm, c = 1.3 mm) (B) The penetrating multi-electrode array (PEA) is inserted through an opening in the ECoG grid substrate. Marked are the pseudo sylvian sulcus (PSS) and the middle cerebral artery (MCA), which served as landmarks for spatial alignment of different recording positions. (C) Example image of a 16 channel single shank PEA. (D) Examples of traces (raw signal) for an ECoG grid and a penetrating multi-electrode array from the same cortical recording during spontaneous activity.
Figure 2
Figure 2
The new ECoG grid enabled recordings of evoked LFP responses similar to conventional penetrating multi-electrode arrays. (A) Examples of evoked responses to a 100 ms broad-band stimulus for an ECoG grid and a penetrating multi-electrode array (PEA) from the same cortical recording. Given are 30 single sweeps (thin grey lines) and an averaged signal (thick black line). Stimulus onset is indicated (red arrow head). (B) Input-output functions of LFP peak-to-peak (p2p) amplitudes in response to a broad-band stimulus. The colors represent different recording positions; the three deepest PEA contacts (excluded from further analysis) are indicated in light grey. The amplitudes at the penetrating electrode (PEA) are significantly smaller than those at the ECoG grid (C and D). (E) The response thresholds at ECoG grid contacts was slightly higher (i.e. worse) than those recorded at the penetrating electrode (PEA) contacts. (C) The maximal peak to peak (p2p) amplitude at ECoG grid contacts was significantly higher than those recorded at the penetrating electrode (PEA) contacts. (D) The response-background ratio (RBR) at 20 dB above response threshold was significantly higher at ECoG than at PEA contacts. (CE) Given are individual data (dots) and medians with IQR (lines). Mann-Whitney U test: ***p < 0.0001.
Figure 3
Figure 3
The ECoG grid enabled fine-scale tonotopic mapping of the GP auditory cortex based on LFP recordings. (A) Example of frequency response curves derived by ECoG grid recordings and recordings from penetrating electrodes. Indicated are the CF and the lower and upper value 20 dB above CF, from which Q20-values were calculated. (B) Tonotopic map of the auditory cortex. For each ECoG grid contact (NLFP = 241) the CF in octave increments was plotted over the respective cortical coordinate. A frequency reversal (dashed line) marks the transition from the primary auditory (A1) to the dorsocaudal cortex (DC). (C) Correlation of CF with the tonotopic axis of A1 for LFP recordings from all ECoG grid recording sites. Given are individual data (dots) and regression lines per individual (gray, thin lines), as well as the overall regression (thick solid line) with the 95% confidence interval (dashed lines). (D) The CF distance in octaves between ECoG grid recording sites and penetrating multi-electrode array (PEA) increased with increasing surface distance. Given are individual data (dots) and mean with SD (lines). Repeated measure 1-way ANOVA p < 0.002 with Bonferroni post-test: ***p < 0.001.
Figure 4
Figure 4
Correlation strength (r2) between grid and penetrating electrode recordings for LFP. Given are mean (dot) and SEM (whisker) and the non-linear regression line (One-phase exponential decay: r2 = 0.370). Based on the raw signal, we revealed that recordings of the grid and the penetrating (PEA) contacts significantly declined with cortical depth (contacts #14–16, indicated in light grey, were excluded from further analyses). Beyond 5 contacts (~ 750 µm), r2 fell below the summed sweep-by-sweep correlation strength over all 16 penetrating contacts (red). ANOVA with Bonferroni corrected posttest: **p < 0.01.
Figure 5
Figure 5
The newly developed ECoG grid enabled recordings of evoked MUA similar to conventional penetrating multi-electrode arrays. (A) Examples of filtered (300–3000 Hz) traces with detected spikes (red circles) above detection threshold (dashed line) for both ECoG and penetrating multi-electrode array (PEA). Stimulus onset is indicated (red arrow head). (B) Representative examples of averaged LFP and raster-plots of MUA in response to a broad-band noise stimulus of 80 dBSPL rms. The raster-plots indicate the time points of every detected spike in each of the 30 repetitions. Stimulus onset is indicated (vertical line). (C) The peri-stimulus time histograms (psth) show representative responses to a 100 ms broad-band stimulus, for the ECoG grid and the penetrating electrode (PEA), respectively. Usually a strong onset response and a weak offset response were discernable. (D) Similarity between first spike latency (FSL) for ECoG grid and penetrating multi-electrode array contacts decreases with cortical depth (depth3 = infragranular layer). Given are median FSLs at the best frequency threshold level (i.e. 10% of max MUA, comparable to the CF threshold) for ECoG grid recording sites close to the insertion point and for different depths at the PEA (depth 1: 0–600 µm, depth 2: 750–1200 µm, depth 3: 1350–1800 µm). Box-plots with min and max values (whisker) and mean (cross). The FSL at the surface was significantly shorter than the one recorded in deep layers of the AC; dependent t-tests with Bonferroni correction *p < 0.05. (E) Correlation strength (r2) between grid and penetrating electrode recordings for MUA is highest for granular layers (contact #7). Given are mean (dot) and SEM (whisker). After an initial decline in correlation strength, the maximal correlation was reached at the 7th contact and sharply declined with increasing cortical depth (contacts #14–16, indicated in light grey, were excluded from further analyses). ANOVA with Bonferroni corrected posttest: *p < 0.05, **p < 0.01, ***p < 0.001.
Figure 6
Figure 6
The characterization of the surface responses differed significantly between MUA and LFP measures at the same contacts. (A) The response-background ratio (RBR) 20 dB above response threshold was significantly higher (i.e. better) for MUA (based on rate) as compared to LFP (based on amplitude). Given are individual data (dots) and medians with IQR (lines). Wilcoxon test: ***p < 0.0001. (B) The response threshold was significantly higher (i.e. worse) for MUA as compared to LFP measures. Given are individual data (dots) and medians with IQR (lines). Wilcoxon test: ***p < 0.0001. (C) The dynamic range was significantly lower for MUA as compared to LFP measures. Given are individual data (dots) and medians with IQR (lines). Wilcoxon test: *p < 0.05, ***p < 0.0001. (D) The MUA Q20-values were significantly larger (i.e. sharper tuning) compared to LFP Q20-values. Given are individual data (dots) and median with IQR (lines). Wilcoxon test: *p < 0.05, ***p < 0.0001. (E) The tonotopy derived by MUA measures (black) at the ECoG grid was similar to the one derived by LFP measures (light orange). Given are individual data (dots) and the linear regression with the 95% confidence interval (solid and dashed lines).

References

    1. Kral A, et al. Spatiotemporal patterns of cortical activity with bilateral cochlear implants in congenital deafness. Journal of Neuroscience. 2009;29:811–827. doi: 10.1523/JNEUROSCI.2424-08.2009. - DOI - PMC - PubMed
    1. Ward MP, Rajdev P, Ellison C, Irazoqui PP. Toward a comparison of microelectrodes for acute and chronic recordings. Brain Research. 2009;1282:183–200. doi: 10.1016/j.brainres.2009.05.052. - DOI - PubMed
    1. Biran R, Martin DC, Tresco PA. Neuronal cell loss accompanies the brain tissue response to chronically implanted silicon microelectrode arrays. Experimental neurology. 2005;195:115–126. doi: 10.1016/j.expneurol.2005.04.020. - DOI - PubMed
    1. Lebedev MA, Nicolelis MAL. Brain-Machine Interfaces: From Basic Science to Neuroprostheses and Neurorehabilitation. Physiological Reviews. 2017;97:767–837. doi: 10.1152/physrev.00027.2016. - DOI - PubMed
    1. Meredith MA, Allman BL. Single-unit Analysis of Somatosensory Processing in Core Auditory Cortex of Hearing Ferrets. The European journal of neuroscience. 2015;41:686–698. doi: 10.1111/ejn.12828. - DOI - PMC - PubMed

LinkOut - more resources