. 2018 Feb 28;9(1):876.
doi: 10.1038/s41467-018-02868-y.

High capacity in G protein-coupled receptor signaling

Affiliations

High capacity in G protein-coupled receptor signaling

Amiran Keshelava et al. Nat Commun. .

Abstract

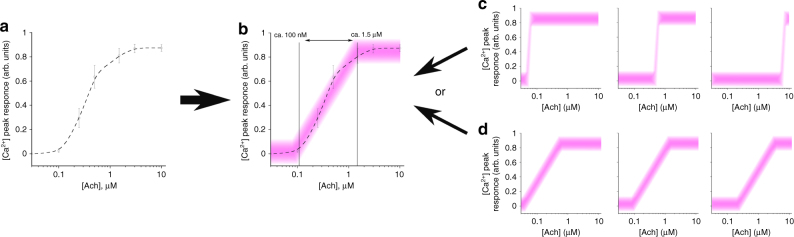
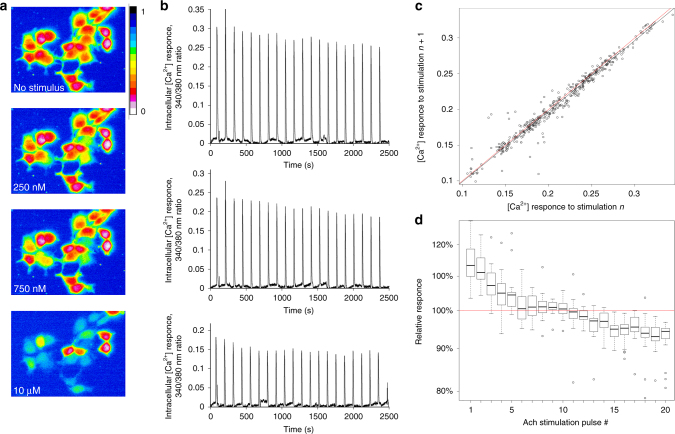
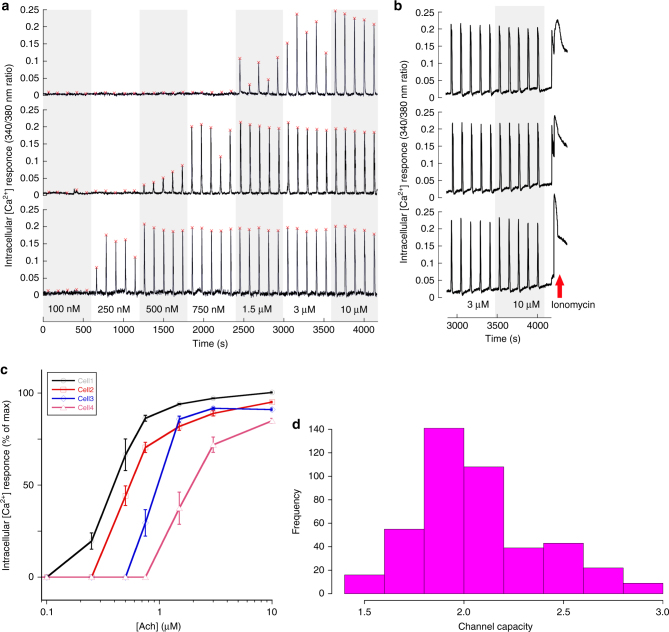
G protein-coupled receptors (GPCRs) constitute a large family of receptors that activate intracellular signaling pathways upon detecting specific extracellular ligands. While many aspects of GPCR signaling have been uncovered through decades of studies, some fundamental properties, like its channel capacity-a measure of how much information a given transmission system can reliably transduce-are still debated. Previous studies concluded that GPCRs in individual cells could transmit around one bit of information about the concentration of the ligands, allowing only for a reliable on or off response. Using muscarinic receptor-induced calcium response measured in individual cells upon repeated stimulation, we show that GPCR signaling systems possess a significantly higher capacity. We estimate the channel capacity of this system to be above two, implying that at least four concentration levels of the agonist can be distinguished reliably. These findings shed light on the basic principles of GPCR signaling.


Conflict of interest statement

The authors declare no competing financial interests.

Figures

Fig. 1
Fig. 1
Population and individual cell responses. a Population of HEK293 cells elicits an intracellular Ca2+ response to increasing concentrations of acetylcholine (Ach). Data are provided from cell responses averaged over four independent experiments, randomly selected from the full data set, 20–30 cells in each experiment, as mean ± sem. b This response has a certain dynamic range (marked by the vertical lines and double arrow), where the response strength is proportional to Ach concentration. c, d Two scenarios behind this population response can be envisioned. In the first c, each cell may possess a sharp threshold of a “yes-or-no” response, shifted differently along the agonist concentration scale. Alternatively d, each cell has its own dynamic range, also shifted differently along the agonist concentration scale. Broadness of the pink lines schematically illustrates the noise in the individual cell responses, provided by deviations from the mean response strength in the experiment whereby cells are stimulated multiple times
Fig. 2
Fig. 2
Single-cell analysis of response to repeated stimulations. a Example of the experimental setup. A field of HEK293 cells loaded with Fura-2 AM is microscopically captured and imaged after buffer only perfusion (no stimulus), or perfusion with 250 nM, 750 nM, and 10 µM Ach. The intracellular Ca2+ response is given as the 340/380 nm ratio in the pseudocolor (scale given to the right of the top panel). Cell stimulation is seen as the change in the cell color from red (ratio close to zero) to yellow or blue. The images given here are captured from Supplementary Movie 1. b Three examples of individual cell’s responses to repeated (×20) stimulations with 250 nM Ach. Well-responding cells are selected for clarity. It is apparent that: (i) different cells respond with different strengths to the same agonist concentration; (ii) the response strength of the same cell is reproducible over multiple stimulations; (iii) a slight trend of a decrease in the response strength is seen from early pulses to later pulses of stimulation. c Correlation analysis of the reproducibility in individual cell’s responses to repeated stimulations. Each circle represents a pair of consecutive response to the same stimulation in the same cell. The responses are highly conserved but tends to dampen as can be observed from the linear regression (black line), which has a slope significantly lower than one (red line shows the diagonal). d Cells adapt (desensitize) their Ca2+ response over time, as repeated equal stimulations lead to a slight but significant dampening of the response
Fig. 3
Fig. 3
Individual cells have individual dynamic ranges and high channel capacity. a Three examples of different single cell’s Ca2+ responses to repeated stimulations with increasing concentrations of Ach. It is evident that some cells respond only to high Ach concentrations (top example), while others are sensitive already to the low concentrations but rapidly reach the plateau in their response strength (bottom example). The example in the middle is an intermediate. See also Fig. 2a. b To prove that cells indeed reach the plateau in their response capacity at high Ach concentrations, the Ca2+ ionophore ionomycin (2 μM) was added at the end of the experimental series in some experiments. Three examples are provided, illustrating the typical cell response to ionomycin. c Examples of cells possessing dynamic ranges shifted along the agonist concentration scale but all capable of responding reliably and differently to different agonist concentrations. d Histogram of estimated channel capacities estimates. The average estimate of channel capacity is 2.06 ± 0.31 (mean ± sd) bits, whereas the lower bound lies at 1.65 ± 0.18 (mean ± sd; see Supplementary Figure 1b)

References

    1. Fredriksson R, Lagerstrom MC, Lundin LG, Schioth HB. The G-protein-coupled receptors in the human genome form five main families. Phylogenetic analysis, paralogon groups, and fingerprints. Mol. Pharmacol. 2003;63:1256–1272. doi: 10.1124/mol.63.6.1256. - DOI - PubMed
    1. Nambi P, Aiyar N. G protein-coupled receptors in drug discovery. Assay Drug Dev. Technol. 2003;1:305–310. doi: 10.1089/15406580360545116. - DOI - PubMed
    1. Gilman AG. G proteins: transducers of receptor-generated signals. Annu. Rev. Biochem. 1987;56:615–649. doi: 10.1146/annurev.bi.56.070187.003151. - DOI - PubMed
    1. Ross EM, Wilkie TM. GTPase-activating proteins for heterotrimeric G proteins: regulators of G protein signaling (RGS) and RGS-like proteins. Annu. Rev. Biochem. 2000;69:795–827. doi: 10.1146/annurev.biochem.69.1.795. - DOI - PubMed
    1. Lin C, et al. Double suppression of the Gɑ protein activity by RGS proteins. Mol. Cell. 2014;53:663–671. doi: 10.1016/j.molcel.2014.01.014. - DOI - PubMed

Publication types

MeSH terms

LinkOut - more resources