. 2018 Feb 14:9:213.
doi: 10.3389/fmicb.2018.00213. eCollection 2018.

Body Mass Index and Sex Affect Diverse Microbial Niches within the Gut

Affiliations

Body Mass Index and Sex Affect Diverse Microbial Niches within the Gut

Francesca Borgo et al. Front Microbiol. .

Abstract

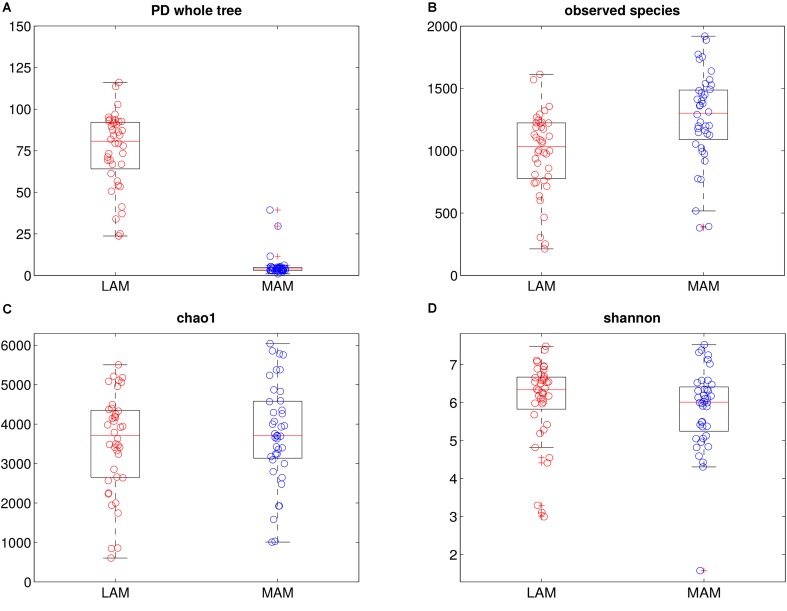
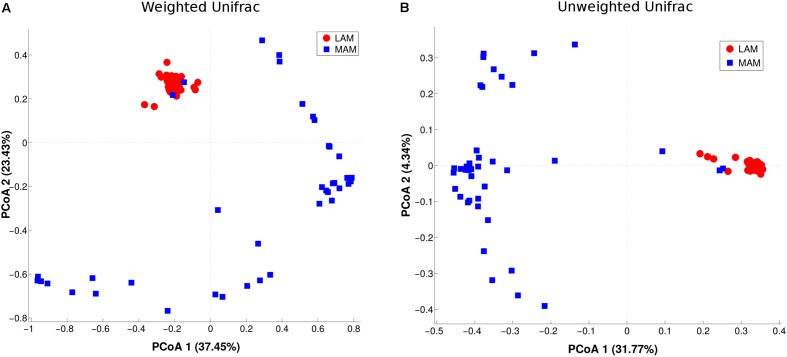
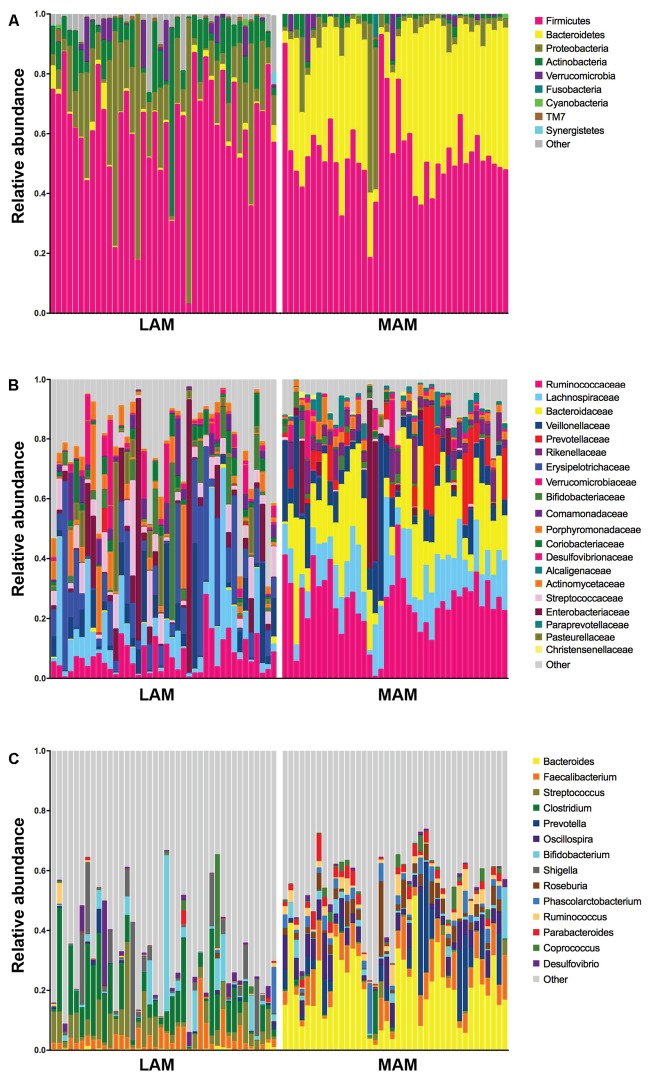
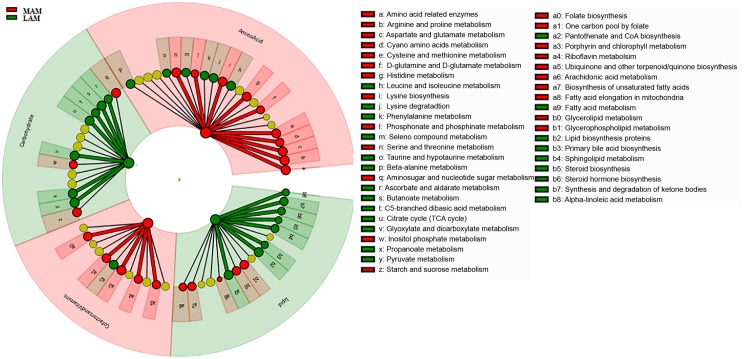
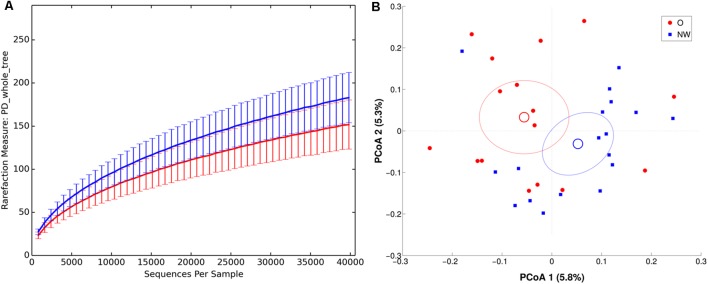
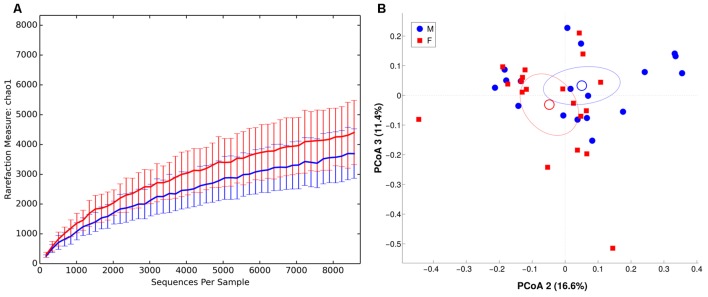
Gut microbiota is considered a separate organ with endocrine capabilities, actively contributing to tissue homeostasis. It consists of at least two separate microbial populations, the lumen-associated (LAM) and the mucosa-associated microbiota (MAM). In the present study, we compared LAM and MAM, by collecting stools and sigmoid brush samples of forty adults without large-bowel symptoms, and through a 16S rRNA gene next-generation sequencing (NGS) approach. MAM sample analysis revealed enrichment in aerotolerant Proteobacteria, probably selected by a gradient of oxygen that decreases from tissue to lumen, and in Streptococcus and Clostridium spp., highly fermenting bacteria. On the other hand, LAM microbiota showed an increased abundance in Bacteroides, Prevotella, and Oscillospira, genera able to digest and to degrade biopolymers in the large intestine. Predicted metagenomic analysis showed LAM to be enriched in genes encoding enzymes mostly involved in energy extraction from carbohydrates and lipids, whereas MAM in amino acid and vitamin metabolism. Moreover, LAM and MAM communities seemed to be influenced by different host factors, such as diet and sex. LAM is affected by body mass index (BMI) status. Indeed, BMI negatively correlates with Faecalibacterium prausnitzii and Flavonifractor plautii abundance, putative biomarkers of healthy status. In contrast, MAM microbial population showed a significant grouping according to sex. Female MAM was enriched in Actinobacteria (with an increased trend of the genus Bifidobacterium), and a significant depletion in Veillonellaceae. Interestingly, we found the species Gemmiger formicilis to be associated with male and Bifidobacterium adolescentis, with female MAM samples. In conclusion, our results suggest that gut harbors microbial niches that differ in both composition and host factor susceptibility, and their richness and diversity may be overlooked evaluating only fecal samples.

Keywords: body mass index; indicative species; luminal microbiota; mucosa-associated microbiota; sex.


Figures

FIGURE 1
FIGURE 1
Intra-samples diversity of LAM and MAM microbiota. Boxplots of end-point α-diversity of LAM and MAM samples according to Faith’s phylogenetic diversity (A), observed species (B), chao1 (C) and Shannon (D) indexes. MAM samples (blue) have significantly lower values than LAM (p = 0.001, red) for Faith’s phylogenetic diversity metric, whereas, show a significantly higher number of observed species (p = 0.001).
FIGURE 2
FIGURE 2
Inter-samples diversity of LAM and MAM microbiota. Principal Coordinate Analysis (PCoA, beta-diversity) plot according to weighted (A) and unweighted (B) Unifrac distances. The first two components of the variance are represented plotting LAM (red) vs. MAM (blue) samples. The two groups are significantly separated (p = 0.01).
FIGURE 3
FIGURE 3
Relative abundances in lumen-associated and mucosa-associated microbiota. Histograms of relative abundances at phylum (A), family (B), and genus (C) level for all subjects (n = 40). MAM group refers to brush samples, whereas LAM group to fecal samples.
FIGURE 4
FIGURE 4
Predicted metabolic pathways enriched in LAM and MAM. Kyoto Encyclopedia of Genes and Genomes (KEGG) pathways differentially abundant in lumen- (LAM, red) and mucosa-associated (MAM, green) gut microbiota. Brightness is proportional to enzymes abundance. Cladogram represents the KEGG BRITE functional hierarchy: the outermost circles represent very broad functional categories, and innermost specific metabolic pathways.
FIGURE 5
FIGURE 5
α and β diversity in LAM samples. NW samples are in blue, whereas O are in red. (A) α-diversity plot of LAM microbiota according to PD whole tree metric. Differences are statistically significant (p < 0.01). (B) PCoA according to unweighted Unifrac distance, showing a significant (p = 0.017) separation between the two groups.
FIGURE 6
FIGURE 6
α and β diversity in MAM microbiota. Females are in red, whereas males are in blue. (A) α-diversity plot of MAM microbiota for chao1 metric. Differences are statistically significant (p < 0.05). (B) PCoA according to unweighted Unifrac distance, showing a significant (p = 0.049) separation between the two groups.

References

    1. Ahonen T., Vanhala M., Kautiainen H., Kumpusalo E., Saltevo J. (2012). Sex differences in the association of adiponectin and low-grade inflammation with changes in the body mass index from youth to middle age. Gend. Med. 9 1–8. 10.1016/j.genm.2012.01.002 - DOI - PubMed
    1. Altschul S. F., Madden T. L., Schaffer A. A., Zhang J., Zhang Z., Miller W., et al. (1997). Gapped BLAST and PSI-BLAST: a new generation of protein database search programs. Nucleic Acids Res. 25 3389–3402. - PMC - PubMed
    1. Backhed F., Ding H., Wang T., Hooper L. V., Koh G. Y., Nagy A., et al. (2004). The gut microbiota as an environmental factor that regulates fat storage. Proc. Natl. Acad. Sci. U.S.A. 101 15718–15723. 10.1073/pnas.0407076101 - DOI - PMC - PubMed
    1. Bergman E. N. (1990). Energy contributions of volatile fatty acids from the gastrointestinal tract in various species. Physiol. Rev. 70 567–590. - PubMed
    1. Borghi E., Borgo F., Severgnini M., Savini M. N., Casiraghi M. C., Vignoli A. (2017). Rett syndrome: a focus on gut microbiota. Int. J. Mol. Sci. 18:344. 10.3390/ijms18020344 - DOI - PMC - PubMed