. 2018 Jun;37(6):1734-1748.
doi: 10.1002/etc.4124. Epub 2018 May 7.

Adverse outcome pathway networks II: Network analytics

Affiliations

Adverse outcome pathway networks II: Network analytics

Daniel L Villeneuve et al. Environ Toxicol Chem. 2018 Jun.

Abstract

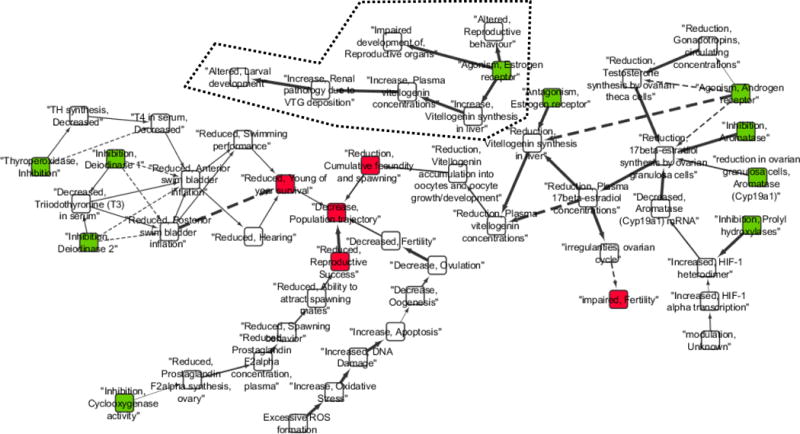
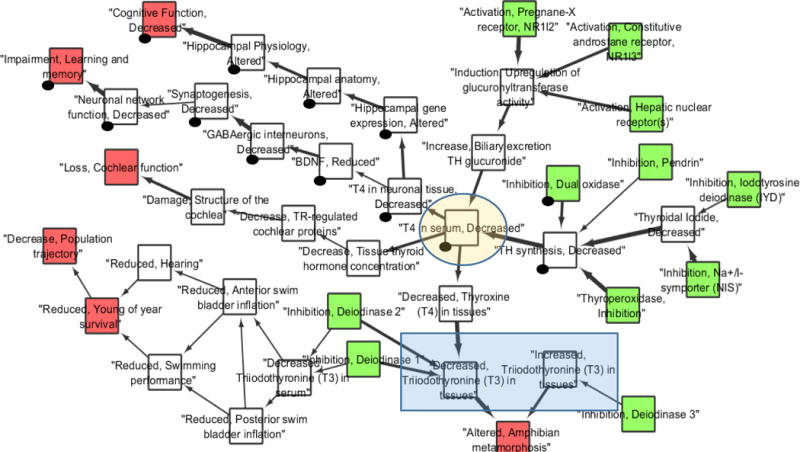
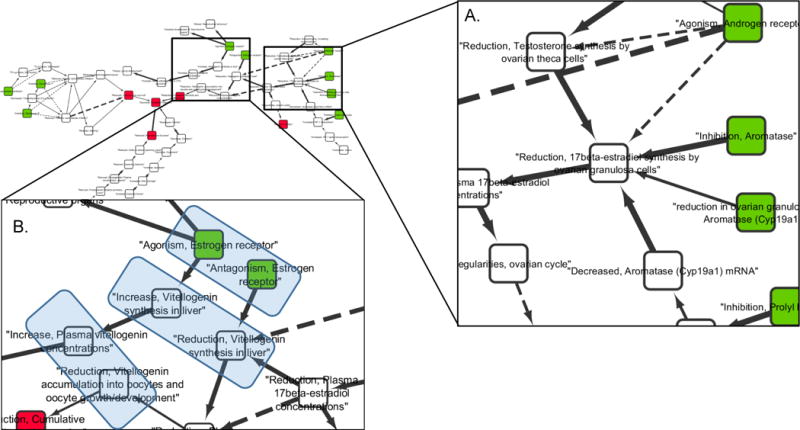
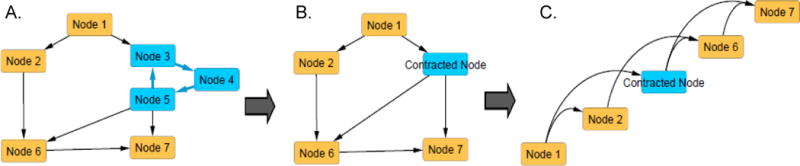
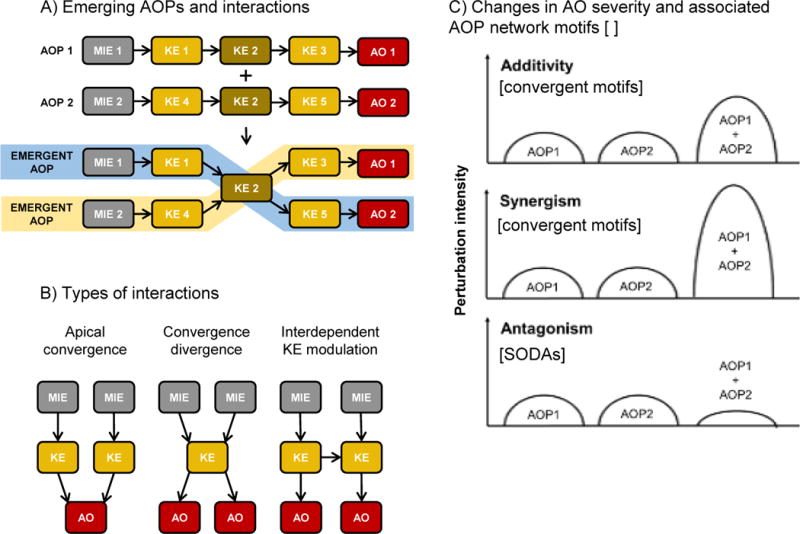
Toxicological responses to stressors are more complex than the simple one-biological-perturbation to one-adverse-outcome model portrayed by individual adverse outcome pathways (AOPs). Consequently, the AOP framework was designed to facilitate de facto development of AOP networks that can aid in the understanding and prediction of pleiotropic and interactive effects more common to environmentally realistic, complex exposure scenarios. The present study introduces nascent concepts related to the qualitative analysis of AOP networks. First, graph theory-based approaches for identifying important topological features are illustrated using 2 example AOP networks derived from existing AOP descriptions. Second, considerations for identifying the most significant path(s) through an AOP network from either a biological or risk assessment perspective are described. Finally, approaches for identifying interactions among AOPs that may result in additive, synergistic, or antagonistic responses (or previously undefined emergent patterns of response) are introduced. Along with a companion article (part I), these concepts set the stage for the development of tools and case studies that will facilitate more rigorous analysis of AOP networks, and the utility of AOP network-based predictions, for use in research and regulatory decision-making. The present study addresses one of the major themes identified through a Society of Environmental Toxicology and Chemistry Horizon Scanning effort focused on advancing the AOP framework. Environ Toxicol Chem 2018;37:1734-1748. © 2018 The Authors. Environmental Toxicology and Chemistry published by Wiley Periodicals, Inc. on behalf of SETAC. This article is a US government work and, as such, is in the public domain in the United States of America.

Keywords: Adverse outcome pathway; Adverse outcome pathway network; Interactions; Mixture toxicology; Network topology; Predictive toxicology; Risk assessment.


Figures

Figure 1
Figure 1
Example adverse outcome pathway (AOP) network 1 (CYP19-AOP network). Network of all adverse outcome pathways (AOPs) in the AOP-Wiki [4] that share at least one key event (KE) with those in AOP 25 [18]. Rounded rectangles indicate KEs. Arrows indicate key event relationships (KERs) with the arrow emanating out of the upstream KE and into the downstream KE. Molecular initiating events are colored green. Adverse outcomes are colored red. Solid lines indicate relationships between KEs that are adjacent in the sequence described in the AOP, while dashed lines indicate non-adjacent relationships. Arrow thickness indicates strength of evidence as defined in the AOP-wiki for each KER, where were weak = thinnest arrows, strong = thickest arrows, moderate = mid-sized arrows. A dotted line outlines a disconnected portion of the network. Unless noted otherwise, all KE titles and relationship information are directly as defined in the AOP-Wiki (Society for Advancement of AOPs 2017; AOPs 25, 7, 23, 122, 123, 30, 29, 100, 155, 156, 157, 158, 159, 216; Supplementary Information Table S.1). KERs shared by more than one AOP are shown as non-redundant (i.e., represented by a single arrow).
Figure 2
Figure 2
Example adverse outcome pathway (AOP) network 2 (T4-AOP network). Network of fourteen adverse outcome pathways (AOPs) related to disruption of thyroid hormone signaling (Society for Advancement of AOPs 2017; AOPs 8, 42, 54, 155, 156, 157, 158, 175, 188, 189, 190, 191, 192, 193; Supplementary Information Table S.2). Squares indicate key events (KE). Arrows indicate key event relationships (KERs) with the arrow emanating out of the upstream KE and into the downstream KE. Key event relationships linking non-adjacent KEs were filtered out of this network and, KERs shared by more than one AOP are shown as non-redundant (i.e., represented by a single arrow). Additionally, in order to improve overall connectivity, the network was curated slightly with regard to titles and relationship information defined in the AOP-Wiki (see supplementary information Table S.3 for details). [A] Network overview. Molecular initiating events are colored green. Adverse outcomes are colored red. Arrow thickness indicates strength of evidence as defined in the AOP-wiki for each KER, where were weak = thinnest arrows, strong = thickest arrows, moderate = mid-sized arrows. A shaded circle highlights a KE that serves as the knot of a bow-tie motif within the network. A sequence of black dots highlights two examples of AOPs not described in the AOP-Wiki that “emerge” through network connectivity. A blue shaded rectangle highlights two KEs that represent the same object, but different actions (SODAs) within the AOP network.
Figure 3
Figure 3
Adverse outcome pathway (AOP) network example 1 (CYP19-AOP network) with view zoomed in on key features. [A] Zoomed in view illustrating degree for the key event (KE) titled “Reduction, 17beta-estradiol synthesis by ovarian granulosa cells” (AOP-Wiki, Event 3; Society for Advancement of AOPs 2017). [B] Zoomed in view of several pairs of KEs, highlighted by blue boxes, that represent the same object, but different actions (SODAs) within the AOP network.
Figure 4
Figure 4
Generic example illustrating contraction and topological sorting of an network. [A] Generic directed network graph containing a cycle (key events [KEs] 3, 4, and 5). [B] Graph of the same network following contraction of KEs 3, 4, and 5 into a single contracted KE. Contraction results in a directed acyclic graph. [C] Graph of the contracted AOP network following topological sorting.
Figure 5
Figure 5
Generic illustration of various types of interactions relevant to the analysis of adverse outcome pathway (AOP) networks. [A] Graphical depiction of emergent AOPs that can arise when individual AOP descriptions are linked as an AOP network. [B] Illustration of some common types of interactions found in AOP networks. [C] Illustration of how AOP interactions may impact the intensity of perturbation of the key events downstream of the point of interaction, and AOP network motifs that would commonly be associated with those interactions. SODA = same object different action, where object and action are ontology terms that are used in defining a key event.

References

    1. Alon U. Network motifs: theory and experimental approaches. Nat Rev Genet. 2007;8:450–461. - PubMed
    1. Becker RA, Ankley GT, Edwards SW, Kennedy SW, Linkov I, Meek B, Sachana M, Segner H, Van Der Burg B, Villeneuve DL, Watanabe H, Barton-Maclaren TS. Increasing scientific confidence in adverse outcome pathways: application of tailored Bradford-Hill considerations for evaluating weight of evidence. Regulat Toxicol Pharmacol. 2015;72:514–537. - PubMed
    1. Burgoon L. Cytoscape App Store, AOPXplorer. 2017 [cited 2017 August 7]. Available from: http://apps.cytoscape.org/search?q=aopxplorer.
    1. Caldarelli G, Catanzaro M. Networks: A Very Short Introduction. Oxford University Press; Oxford, UK: 2012.
    1. Conolly RB, Ankley GT, Cheng W, Mayo ML, Miller DH, Perkins EJ, Villeneuve DL, Watanabe KH. Quantitative Adverse Outcome Pathways and Their Application to Predictive Toxicology. Environ Sci Technol. 2017;51:4661–4672. - PMC - PubMed

Publication types

LinkOut - more resources