. 2018 Jun;21(6):763-778.
doi: 10.1111/ele.12928. Epub 2018 Feb 28.

Quantifying effects of biodiversity on ecosystem functioning across times and places

Affiliations

Quantifying effects of biodiversity on ecosystem functioning across times and places

Forest Isbell et al. Ecol Lett. 2018 Jun.

Abstract

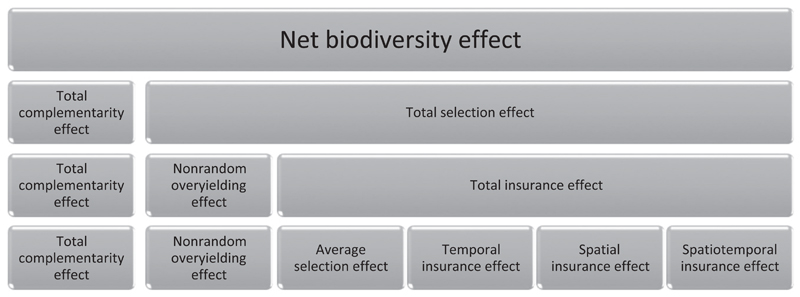
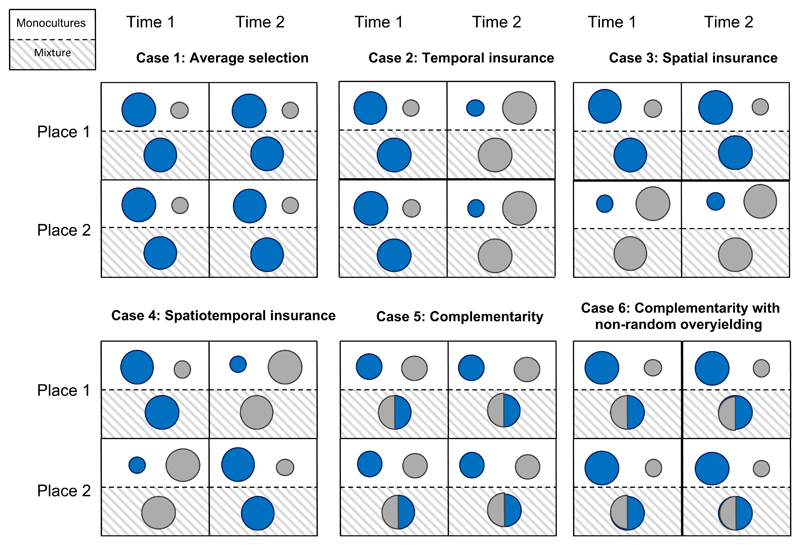
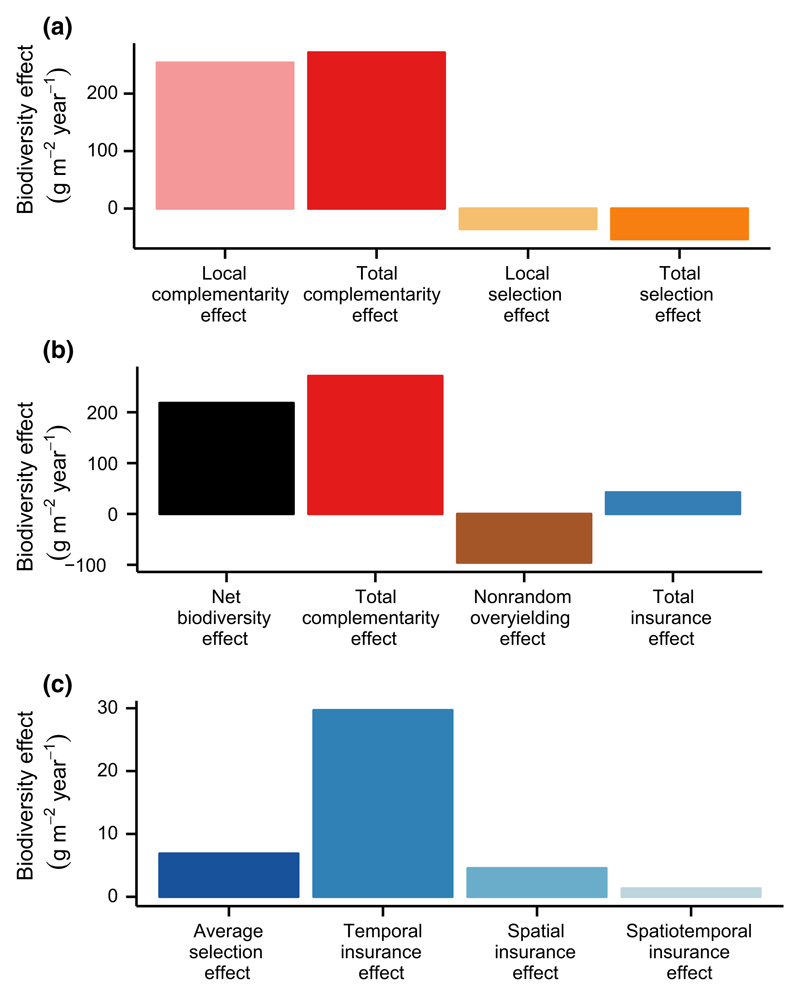
Biodiversity loss decreases ecosystem functioning at the local scales at which species interact, but it remains unclear how biodiversity loss affects ecosystem functioning at the larger scales of space and time that are most relevant to biodiversity conservation and policy. Theory predicts that additional insurance effects of biodiversity on ecosystem functioning could emerge across time and space if species respond asynchronously to environmental variation and if species become increasingly dominant when and where they are most productive. Even if only a few dominant species maintain ecosystem functioning within a particular time and place, ecosystem functioning may be enhanced by many different species across many times and places (β-diversity). Here, we develop and apply a new approach to estimate these previously unquantified insurance effects of biodiversity on ecosystem functioning that arise due to species turnover across times and places. In a long-term (18-year) grassland plant diversity experiment, we find that total insurance effects are positive in sign and substantial in magnitude, amounting to 19% of the net biodiversity effect, mostly due to temporal insurance effects. Species loss can therefore reduce ecosystem functioning both locally and by eliminating species that would otherwise enhance ecosystem functioning across temporally fluctuating and spatially heterogeneous environments.

Keywords: Biodiversity; complementarity effect; ecosystem functioning; insurance effect; overyielding; selection effect.


Figures

Figure 1
Figure 1
The net biodiversity effect can be partitioned into component types of biodiversity effects on ecosystem functioning. The sum of all biodiversity effects shown in each row equals the net biodiversity effect (see Boxes 2 and 3 for corresponding equations).
Figure 2
Figure 2
Visual representation of the six contrasting types of biodiversity effects on ecosystem functioning. Larger circles indicate greater yields. Blue and grey colours correspond to two different species. Within each case, two different times (columns) are shown for each of two different places (rows). In case 1, the effect of biodiversity on ecosystem functioning depends on only one species that is highly productive in monoculture at all times and places. In cases 2–4, the effect of biodiversity on ecosystem functioning depends on different species at different times and places, due to temporal and spatial insurance effects. In cases 5 and 6, the effect of biodiversity on ecosystem functioning depends on both species at each and every time and place, due to complementarity effects. See Table 2 for the values associated with each case.
Figure 3
Figure 3
Variation over time in monoculture yields (top) and mixture relative biomasses (bottom) for ambient (left) and enriched (right) rates of N supply for the BioCON experiment. Different species become highly productive in monoculture during different years and under different rates of N supply. The rank order of species’ mixture relative biomasses also changes substantially over time and between N treatments. Without these changes in the identities of highly productive and dominant species over time and between environmental conditions, there could be no covariance between them and thus no insurance effects of biodiversity on ecosystem productivity. Line colours correspond to plant functional groups: reds = C3 grasses, browns = C4 grasses, greens = non-N-fixing forbs, blues = N-fixing forbs.
Figure 4
Figure 4
Covariation between monoculture yields and mixture relative biomasses over time (left) and between ambient and enriched rates of N supply (right) for the BioCON experiment. Positive sloping lines indicate that species increasingly dominated mixtures during the years (left) or under the rates of N supply (right) in which they were most productive in monoculture. These positive covariances partly explain why increasing plant species richness increases ecosystem productivity across multiple years and environmental conditions (i.e. N supply rates). Symbol and line colours correspond to plant functional groups: reds = C3 grasses, browns = C4 grasses, greens = non-N-fixing forbs, blues = N-fixing forbs.
Figure 5
Figure 5
Magnitudes of local and larger scale biodiversity effects on ecosystem functioning for the BioCON experiment. (a) Complementarity effects were much larger than selection effects, regardless of whether they were quantified at local or larger scales. (b) The positive net biodiversity effect was due primarily to a positive total complementarity effect and secondarily to a positive total insurance effect, both of which were counter-balanced by a negative non-random overyielding effect. (c) Total insurance effects were mostly explained by temporal insurance effects.

References

    1. Allan E, Weisser W, Weigelt A, Roscher C, Fischer M, Hillebrand H. More diverse plant communities have higher functioning over time due to turnover in complementary dominant species. Proc Natl Acad Sci. 2011;108:17034–17039. - PMC - PubMed
    1. Callaway RM, Brooker RW, Choler P, Kikvidze Z, Lortie CJ, Michalet R, et al. Positive interactions among alpine plants increase with stress. Nature. 2002;417:844–848. - PubMed
    1. Cardinale BJ, Wright JP, Cadotte MW, Carroll IT, Hector A, Srivastava DS, et al. Impacts of plant diversity on biomass production increase through time because of species complementarity. Proc Natl Acad Sci USA. 2007;104:18123–18128. - PMC - PubMed
    1. Cardinale BJ, Matulich KL, Hooper DU, Byrnes JE, Duffy E, Gamfeldt L, et al. The functional role of producer diversity in ecosystems. Am J Bot. 2011;98:572–592. - PubMed
    1. Ceballos G, Ehrlich PR, Dirzo R. Biological annihilation via the ongoing sixth mass extinction signaled by vertebrate population losses and declines. Proc Natl Acad Sci. 2017;114:E6089–E6096. - PMC - PubMed

Publication types