. 2018 Feb 28;555(7694):48-53.
doi: 10.1038/nature25761.

Mapping local variation in educational attainment across Africa

Affiliations

Mapping local variation in educational attainment across Africa

Nicholas Graetz et al. Nature. .

Abstract

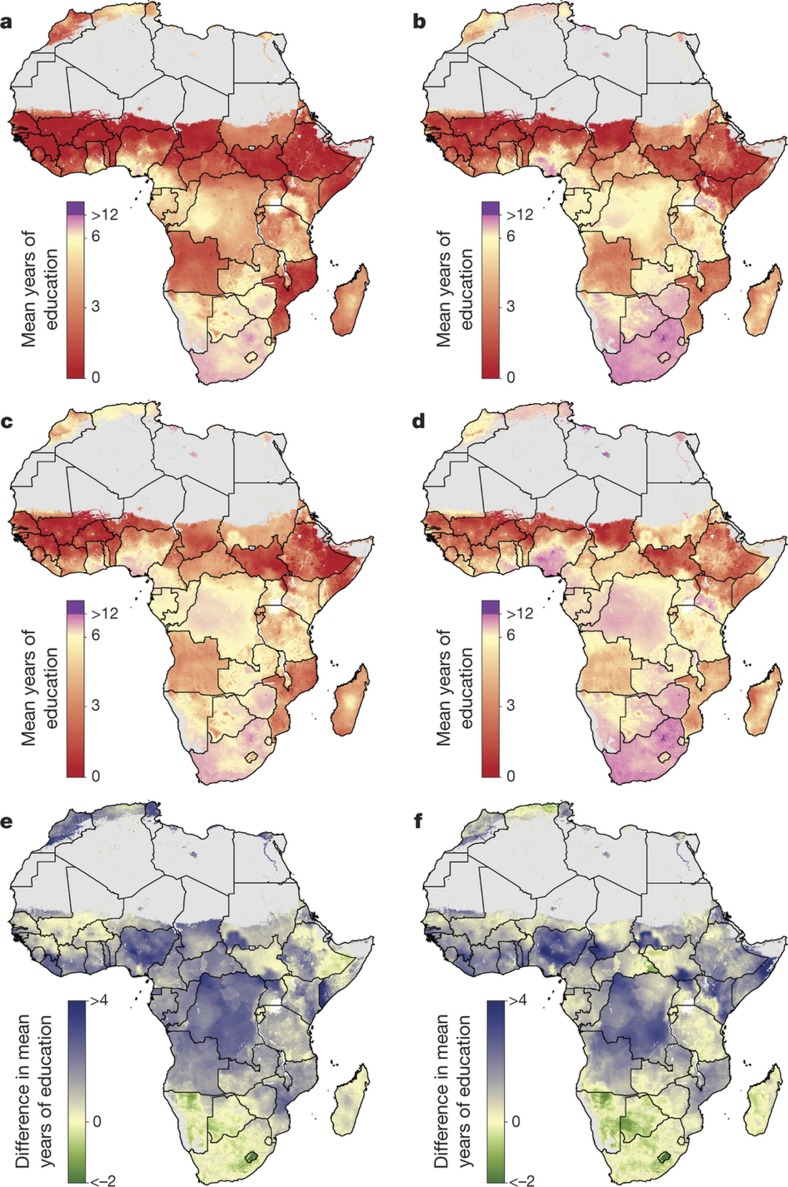
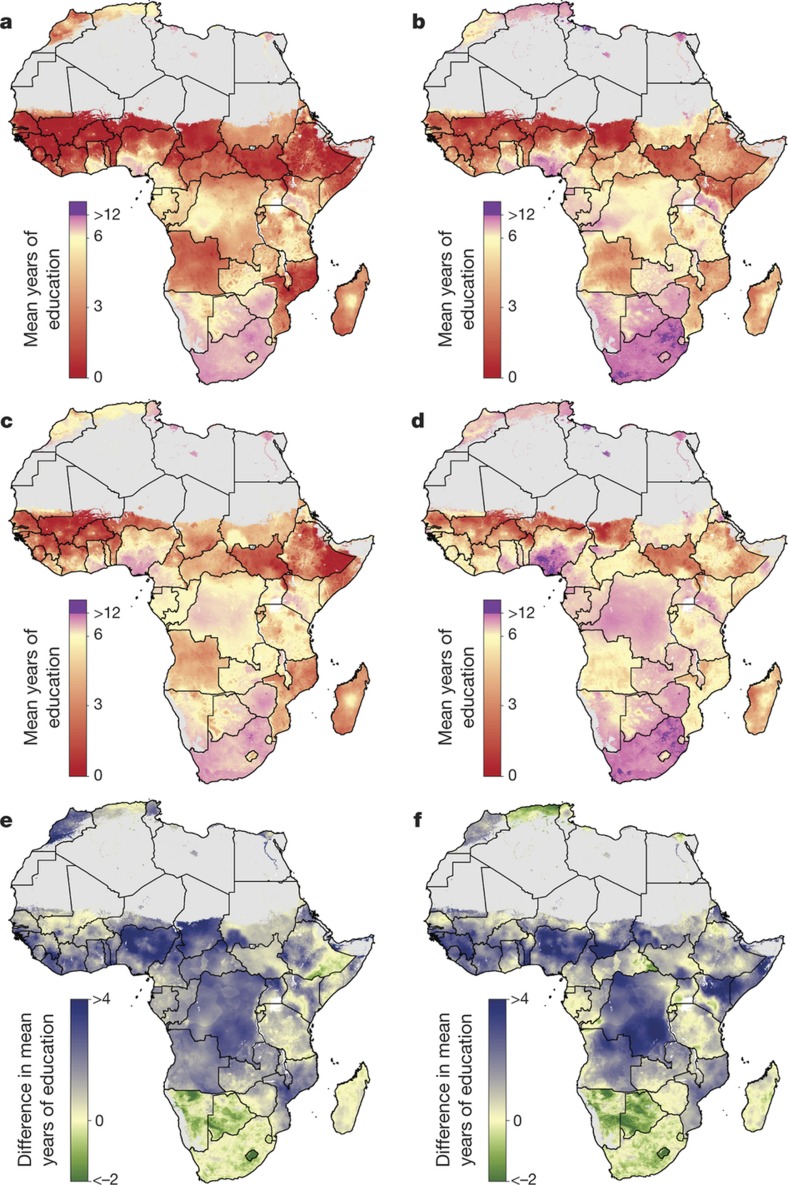
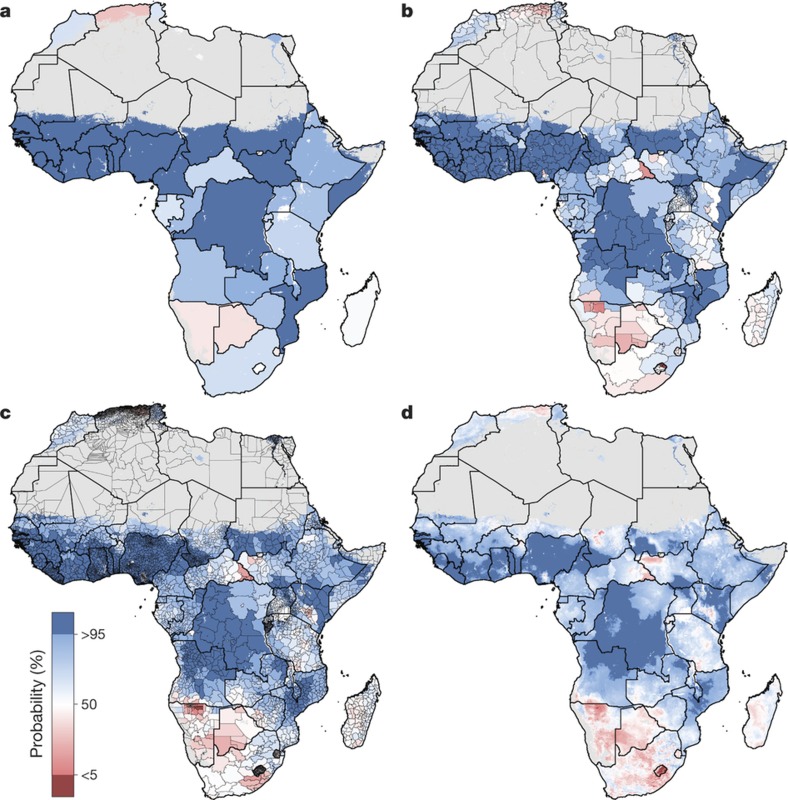
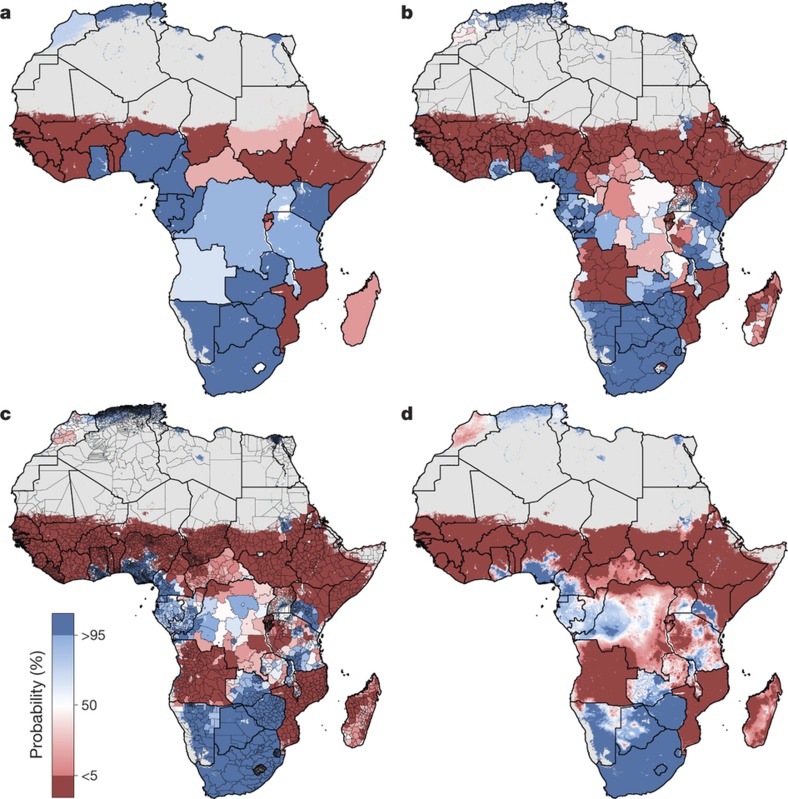
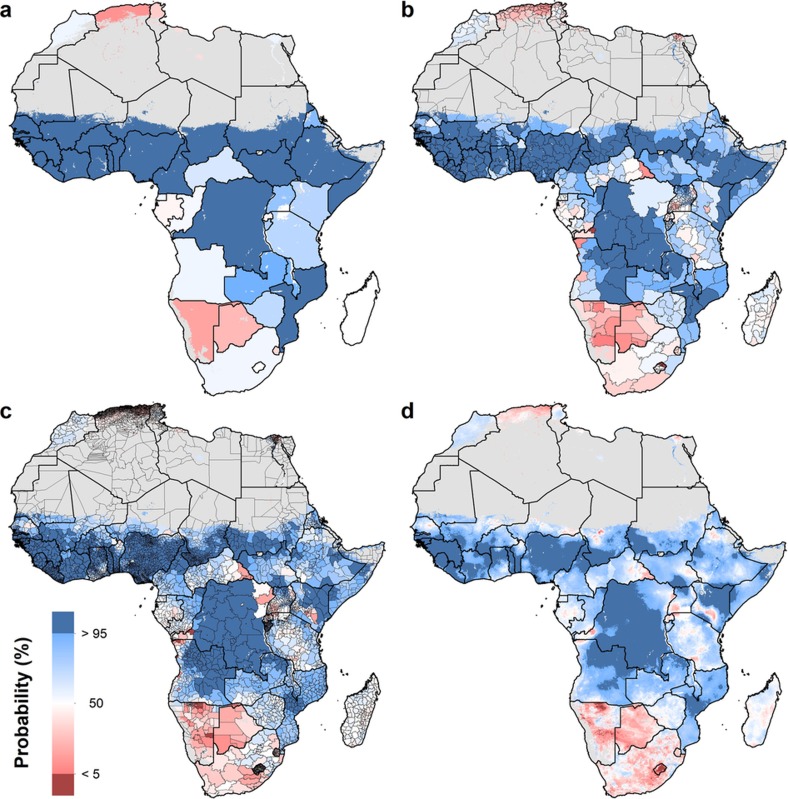
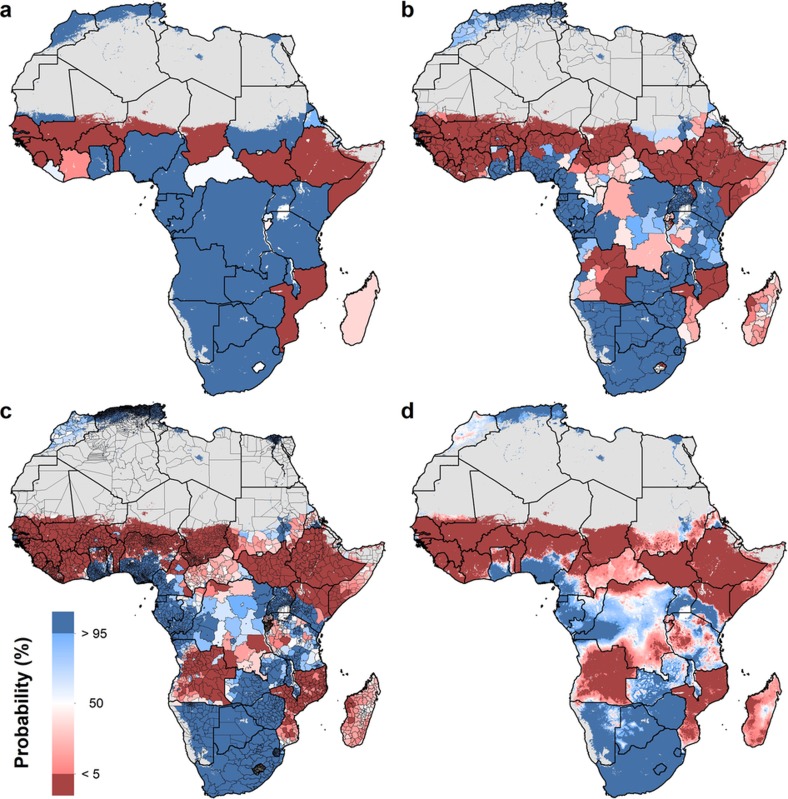
Educational attainment for women of reproductive age is linked to reduced child and maternal mortality, lower fertility and improved reproductive health. Comparable analyses of attainment exist only at the national level, potentially obscuring patterns in subnational inequality. Evidence suggests that wide disparities between urban and rural populations exist, raising questions about where the majority of progress towards the education targets of the Sustainable Development Goals is occurring in African countries. Here we explore within-country inequalities by predicting years of schooling across five by five kilometre grids, generating estimates of average educational attainment by age and sex at subnational levels. Despite marked progress in attainment from 2000 to 2015 across Africa, substantial differences persist between locations and sexes. These differences have widened in many countries, particularly across the Sahel. These high-resolution, comparable estimates improve the ability of decision-makers to plan the precisely targeted interventions that will be necessary to deliver progress during the era of the Sustainable Development Goals.


Conflict of interest statement

The authors declare no competing financial interests.

Figures

Figure 1
Figure 1. Average educational attainment for and absolute difference between women and men aged 15–49 in 2000 and 2015.
ad, Average educational attainment for women (a, b) and men (c, d) aged 15–49 in 2000 (a, c) and 2015 (b, d). e, f, The absolute difference in average educational attainment between men and women aged 15–49 in 2000 (e) and 2015 (f). Maps reflect administrative boundaries, land cover, lakes and population; pixels with fewer than ten people per 1 × 1 km and classified as ‘barren or sparsely vegetated’ are coloured in grey.
Figure 2
Figure 2. Average educational attainment for and absolute difference between women and men aged 20–24 in 2000 and 2015.
ad, Average educational attainment for women (a, b) and men (c, d) aged 20–24 in 2000 (a, c) and 2015 (b, d). e, f, The absolute difference in average educational attainment between men and women aged 20–24 in 2000 (e) and 2015 (f). Maps reflect administrative boundaries, land cover, lakes and population; pixels with fewer than ten people per 1 × 1 km and classified as ‘barren or sparsely vegetated’ are coloured in grey.
Figure 3
Figure 3. Probability that male educational attainment is greater than female educational attainment for men and women aged 15–49 in 2015.
ad, Probabilities at the pixel level (d) were aggregated using 5 × 5-km resolution population data to the district level (c), province level (b) and national level (a). Maps reflect administrative boundaries, land cover, lakes and population; pixels with fewer than ten people per 1 × 1 km and classified as ‘barren or sparsely vegetated’ are coloured in grey.
Figure 4
Figure 4. Probability that average educational attainment is greater than six years in 2015 among women of reproductive age (15–49).
ad, Probabilities at the pixel level (d) were aggregated using 5 × 5-km resolution population data to the district level (c), province level (b) and national level (a). Maps reflect administrative boundaries, land cover, lakes and population; pixels with fewer than ten people per 1 × 1 km and classified as ‘barren or sparsely vegetated’ are coloured in grey.
Figure 1
Figure 1. Probability that educational attainment in men is greater than attainment in women for men and women aged 20–24 in 2015
ad, Probabilities at the pixel level (d) were aggregated using 5 × 5-km resolution population data to the district level (c), province level (b) and national level (A). Maps reflect administrative boundaries, land cover, lakes and population; pixels with fewer than ten people per 1 × 1 km and classified as ‘barren or sparsely vegetated’ are coloured in grey.
Figure 2
Figure 2. Probability that average educational attainment is greater than six years in 2015 among women aged 20–24.
Probabilities at the pixel level (d) were aggregated using 5 × 5-km resolution population data to the district level (c), province level (b) and national level (A). Maps reflect administrative boundaries, land cover, lakes and population; pixels with fewer than ten people per 1 × 1 km and classified as ‘barren or sparsely vegetated’ are coloured in grey.
Figure 3
Figure 3. Map of modelling regions.
Modelling regions were defined as the five GBD regions of Central (central sub-Saharan Africa), East (eastern sub-Saharan Africa), North (North Africa and the Middle East), South (Southern sub-Saharan Africa) and West Africa (Western sub-Saharan Africa). As this study was limited to mainland Africa and African island nations, select countries were excluded from the North Africa and Middle East region (Afghanistan, Bahrain, Iran, Iraq, Jordan, Kuwait, Lebanon, Oman, Palestinian territories, Qatar, Saudi Arabia, Syria, Turkey, United Arab Emirates and Yemen). Western Sahara was included as part of the North region. Several countries were moved to East (Lesotho and Swaziland from South, Sudan from North) to make high-income status more similar in the North and South regions.

Comment in

  • Precision maps for public health.
    Reich BJ, Haran M. Reich BJ, et al. Nature. 2018 Mar 1;555(7694):32-33. doi: 10.1038/d41586-018-02096-w. Nature. 2018. PMID: 29493618 No abstract available.

References

    1. UNESCO. Global Education Monitoring Report. (UNESCO, 2016)
    1. United Nations. Transforming our World: the 2030 Agenda for Sustainable Development. (United Nations, 2015)
    1. United Nations. Goal 4: Ensure Inclusive and Quality Education for All and promote Lifelong Learning. (United Nations, 2016)
    1. Klasen S. Does Gender Inequality Reduce Growth and Development: Evidence from Cross-Country Regressions. Working Paper Series No. 7 (World Bank, 2000)
    1. Klasen S. Low schooling for girls, slower growth for all? Cross-country evidence on the effect of gender inequality in education on economic development. World Bank Econ. Rev. 16, 345–373 (2002)

Publication types