. 2018 Feb 28;555(7694):41-47.
doi: 10.1038/nature25760.

Mapping child growth failure in Africa between 2000 and 2015

Affiliations

Mapping child growth failure in Africa between 2000 and 2015

Aaron Osgood-Zimmerman et al. Nature. .

Abstract

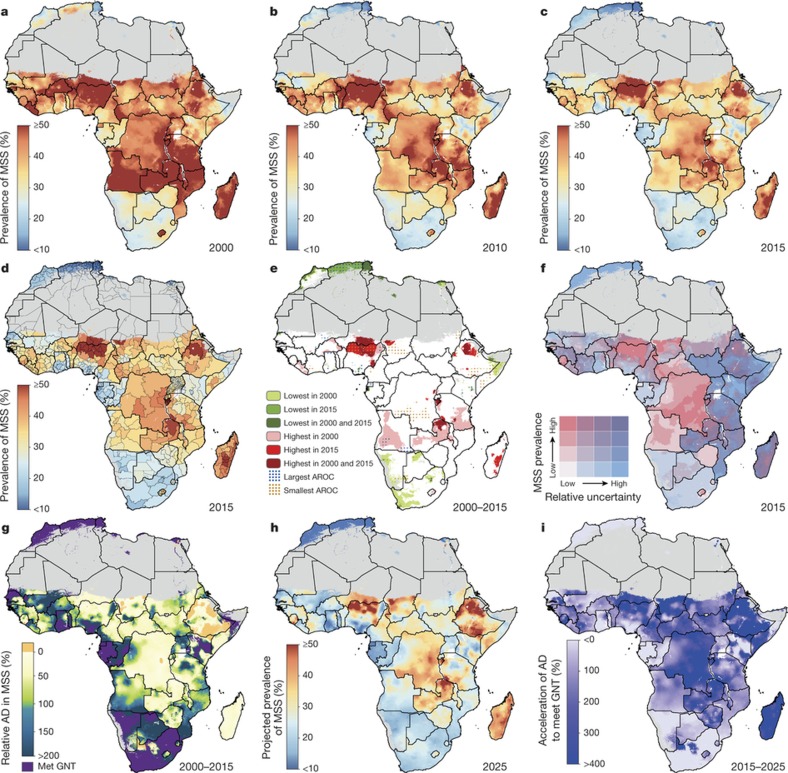
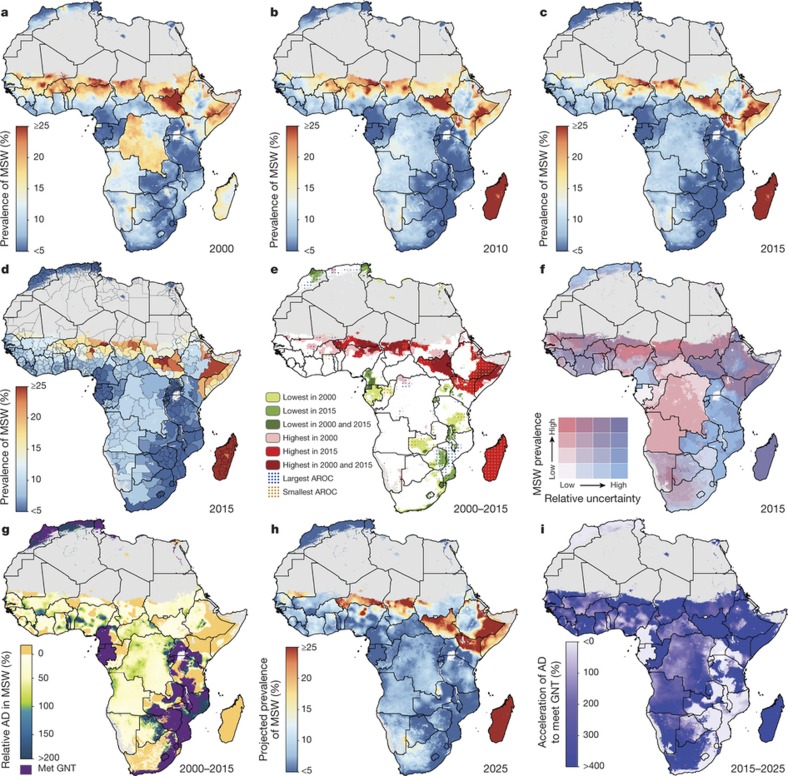
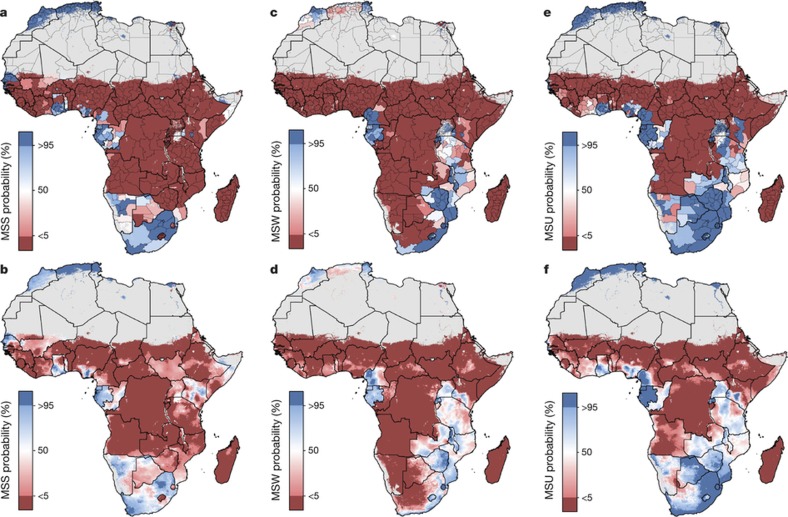
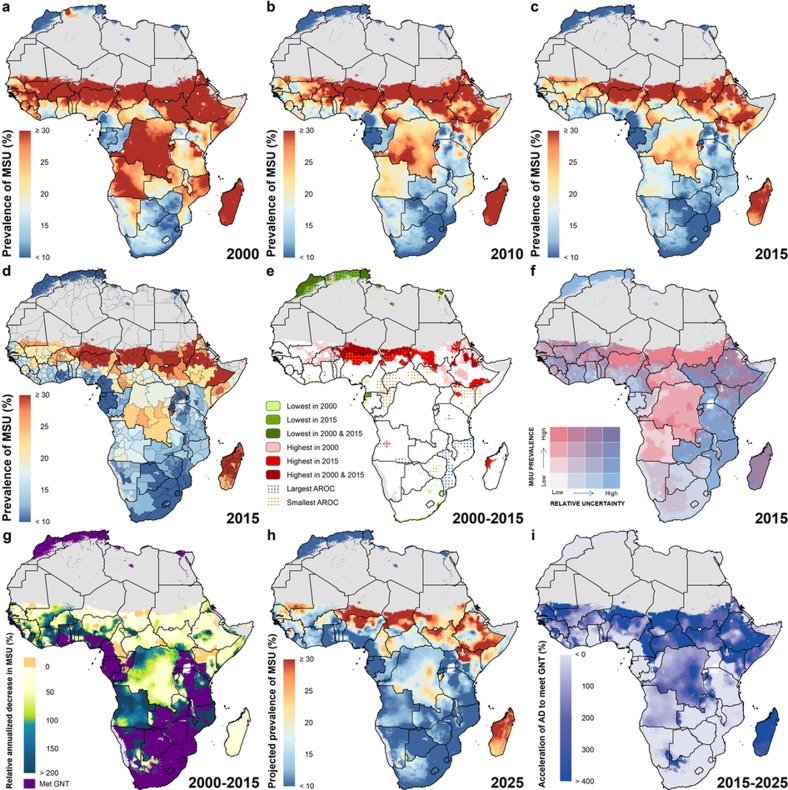
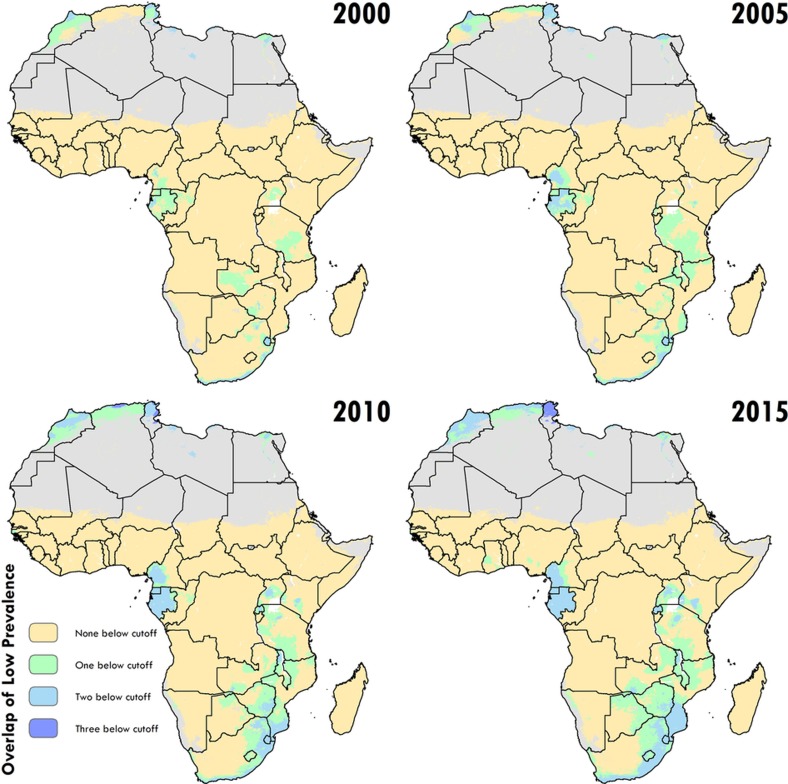
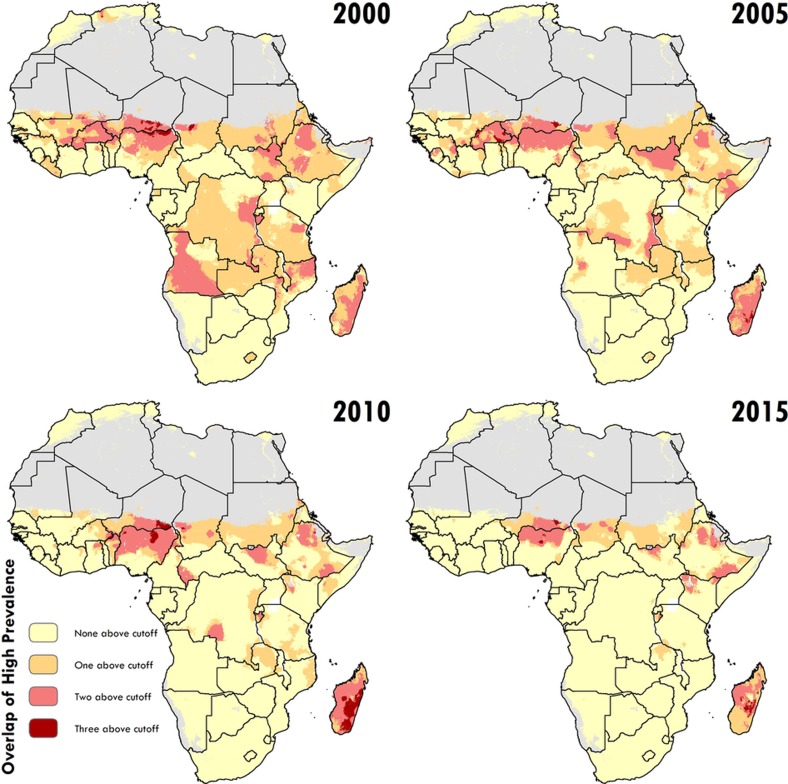
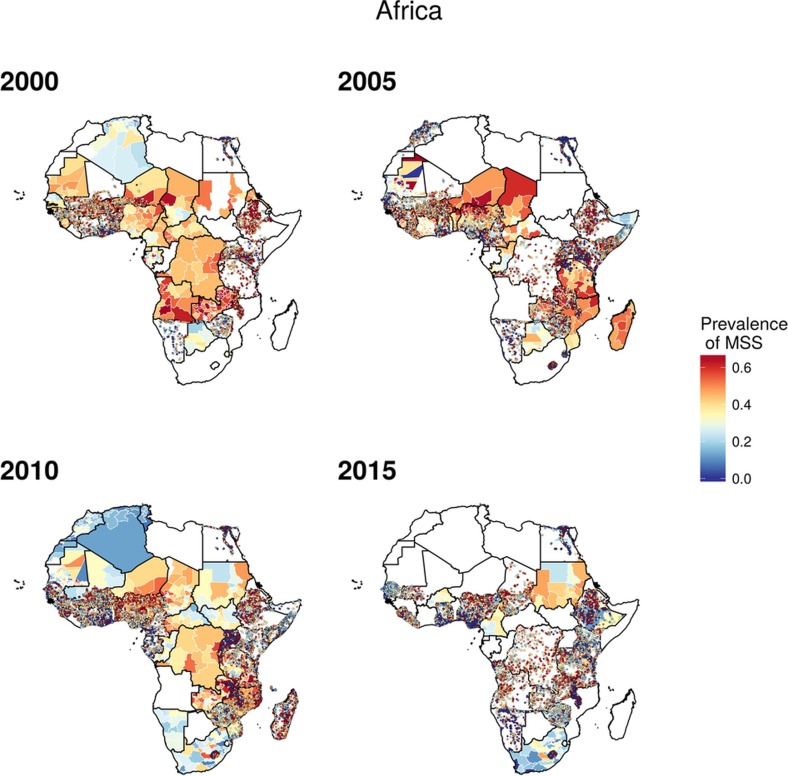
Insufficient growth during childhood is associated with poor health outcomes and an increased risk of death. Between 2000 and 2015, nearly all African countries demonstrated improvements for children under 5 years old for stunting, wasting, and underweight, the core components of child growth failure. Here we show that striking subnational heterogeneity in levels and trends of child growth remains. If current rates of progress are sustained, many areas of Africa will meet the World Health Organization Global Targets 2025 to improve maternal, infant and young child nutrition, but high levels of growth failure will persist across the Sahel. At these rates, much, if not all of the continent will fail to meet the Sustainable Development Goal target-to end malnutrition by 2030. Geospatial estimates of child growth failure provide a baseline for measuring progress as well as a precision public health platform to target interventions to those populations with the greatest need, in order to reduce health disparities and accelerate progress.


Conflict of interest statement

This study was funded by the Bill & Melinda Gates Foundation. Co-authors employed by the Bill & Melinda Gates Foundation provided feedback on initial maps and drafts of this manuscript. Otherwise, the funders of the study had no role in study design, data collection, data analysis, data interpretation, or the writing of the final report. The corresponding author had full access to all the data in the study and had final responsibility for the decision to submit for publication.

Figures

Figure 1
Figure 1. Prevalence of stunting (2000–2015) in children under five and progress towards 2025.
ac, Prevalence of moderate and severe stunting (MSS) at the 5 × 5-km resolution in 2000 (a), 2010 (b) and 2015 (c). d, Prevalence of stunting at the first administrative subdivision in 2015. e, Overlapping population-weighted lowest and highest 10% of pixels and AROC in stunting from 2000 to 2015 across the continent. f, Overlapping population-weighted quartiles of stunting and relative 95% uncertainty in 2015. g, Annualized decrease (AD) in stunting prevalence from 2000 to 2015 relative to rates needed during 2015–2025 to meet the WHO GNT. 100% indicates the annualized decrease from 2000 to 2015 equivalent to the pace of progress required during 2015–2025 to meet the WHO GNT by 2025 (40% decrease in stunting, relative to 2010). Blue pixels exceeded this pace; green to yellow pixels proceeded at a slower rate than required; orange pixels were non-decreasing; and purple pixels were estimated to have met the target by 2015 (‘Met GNT’). h, Pixel-level prevalence of stunting was predicted for 2025 on the basis of the annualized decrease achieved from 2000 to 2015 and projected from 2015. i, Acceleration in the annualized decrease in stunting required to meet the WHO GNT by 2025. Purple pixels were either non-decreasing or must accelerate their rate of decline by more than 400% over 2000–2015 rates during 2015–2025 to achieve the target; white pixels require no increase. Maps reflect administrative boundaries, land cover, lakes and population; pixels with fewer than ten people per 1 × 1 km and classified as ‘barren or sparsely vegetated’ are coloured in grey.
Figure 2
Figure 2. Wasting prevalence (2000–2015) in children under five and progress towards 2025.
ac, Prevalence of moderate and severe wasting (MSW) at the 5 × 5-km resolution in 2000 (a), 2010 (b) and 2015 (c). d, Prevalence of wasting at the first administrative subdivision in 2015. e, Overlapping population-weighted lowest and highest 10% of pixels and AROC in wasting from 2000 to 2015 across the continent. f, Overlapping population-weighted quartiles of wasting and relative 95% uncertainty in 2015. g, Annualized decrease in wasting prevalence from 2000 to 2015 relative to rates needed during 2015–2025 to meet the WHO GNT. 100% indicates the annualized decrease from 2000 to 2015 equivalent to the pace of progress required during 2015–2025 to meet the WHO GNT by 2025 (wasting less than 5%). Blue pixels exceeded this pace; green to yellow pixels proceeded at a slower rate than required; orange pixels were non-decreasing; and purple pixels were estimated to have met the target by 2015. h, Pixel-level prevalence of wasting was predicted for 2025 on the basis of the annualized decrease achieved from 2000 to 2015 and projected from 2015. i, Acceleration in annualized decrease required to meet the WHO GNT by 2025. Purple pixels were either non-decreasing or must accelerate their rate of decline by more than 400% over 2000–2015 rates during 2015–2025 to achieve the target; white pixels require no increase. Maps reflect administrative boundaries, land cover, lakes and population; pixels with fewer than ten people per 1 × 1 km and classified as ‘barren or sparsely vegetated’ are coloured in grey.
Figure 3
Figure 3. Probability that the WHO GNT has been achieved in 2015 at the first administrative subdivision and 5 × 5-km pixel level for stunting, wasting and underweight.
af, Probability of WHO GNT achievement in 2015 at the first administrative subdivision and 5 × 5-km level for moderate and severe stunting (a, b), moderate and severe wasting (c, d) and moderate and severe underweight (e, f). The probability that dark-blue pixels have met the WHO GNT in 2015 is greater than 95%, and less than 5% for dark-red pixels. Estimates for 2015 at the 5 × 5-km level have been calculated using population-weighting based on the population of children under five and probabilities that the WHO GNT were met in 2015. Maps reflect administrative boundaries, land cover, lakes and population; pixels with fewer than ten people per 1 × 1 km and classified as ‘barren or sparsely vegetated’ are coloured in grey.
Figure 1
Figure 1. Measurement of child growth failure.
a, Stunting is a manifestation of chronic malnutrition and is defined as a height-for-age z score (HAZ) that is two or more standard deviations (s.d.) below the reference median. b, Wasting is an emaciated state resulting from acute malnutrition and is defined a weight-for-height z score (WHZ) of <−2. c, Underweight is a weight-for-age z score (WAZ) of <−2 and is considered a marker of subacute malnutrition, but is nonspecific from an anthropometric standpoint, because it can indicate either low weight for height, low height for age or some combination of both. There are multiple permutations of child growth failure and the silhouettes are simply illustrative of what a stunted, wasted or underweight child may look like. The World Health Organization Global Targets 2025 to improve maternal, infant and young child nutrition call for a 40% reduction in stunting and a reduction and maintenance of child wasting to less than 5% in children under five. While there is no target for child underweight, a reduction of 40% was used in this analysis.
Figure 2
Figure 2. Underweight prevalence in children under five (2000–2015) and progress towards 2025.
ac, Moderate and severe underweight (MSU) prevalence at the 5 × 5-km resolution in 2000 (a), 2010 (b) and 2015 (c). d, Underweight prevalence at the first administrative subdivision in 2015. e, Overlapping population-weighted lowest and highest 10% of pixels and annualized rates of change in underweight from 2000 to 2015 across the continent. f, Overlapping population-weighted quartiles of underweight and relative 95% uncertainty in 2015. g, Annualized decrease in underweight prevalence from 2000 to 2015 relative to rates needed during 2015–2025 to meet the WHO GNT. 100% indicates the annualized decrease from 2000 to 2015 equivalent to the pace of progress required during 2015–2025 to meet a 40% decrease in underweight by 2025, relative to 2010. Blue pixels exceeded this pace; green to yellow pixels proceeded at a slower rate than required; orange pixels were non-decreasing; and purple pixels were estimated to have met the target by 2015. This target was internally constructed, commensurate with the target for stunting, as there is no WHO GNT for underweight. h, Pixel-level underweight prevalence was predicted for 2025 on the basis of the annualized decrease achieved from 2000 to 2015 and projected from 2015 estimates. i, Acceleration in annualized decrease required to meet the WHO GNT by 2025. Purple pixels were either non-decreasing or must accelerate their rate of decline by more than 400% over 2000–2015 rates during 2015–2025 to achieve the target; white pixels require no increase. Maps reflect administrative boundaries, land cover, lakes and population; pixels with fewer than ten people per 1 × 1 km and classified as ‘barren or sparsely vegetated’ are coloured in grey.
Figure 3
Figure 3. Low prevalence across stunting, wasting and underweight.
Across the modelling regions and 5-year periods, these plots show locations where the prevalence of one, two or three of the indicators falls below a lower bound (10% for stunting (HAZ), 5% for wasting (WHZ) and 10% for underweight (WAZ), which correspond to the lower cut-offs used in Figs 1a, 2a, Extended Data Fig. 2a). Maps reflect administrative boundaries, land cover, lakes and population; pixels with fewer than ten people per 1 × 1 km and classified as ‘barren or sparsely vegetated’ are coloured in grey.
Figure 4
Figure 4. High prevalence across stunting, wasting, and underweight.
Across the modelling regions and 5-year periods, these plots show locations where the prevalence of one, two or three of the indicators falls above an upper bound (50% for stunting (HAZ), 25% for wasting (WHZ) and 30% for underweight (WAZ), which correspond to the upper cut-offs used in Figs 1a, 2a, Extended Data Fig. 2a). Maps reflect administrative boundaries, land cover, lakes and population; pixels with fewer than ten people per 1 × 1 km and classified as ‘barren or sparsely vegetated’ are coloured in grey.
Figure 5
Figure 5. Stunting annual data availability by type and country for 2000–2015.
All data are shown by country and year of survey. The total number of points and polygons (areal) for each country are plotted by data source, type and sample size. Sample size represents the number of individual microdata records for each survey. This database consists of 50,142 clusters and 4,253 polygons with a sample size totalling over 1.15 million children in Africa.
Figure 6
Figure 6. Stunting data availability map for 2000–2015.
All data are shown by country and year and mapped at their corresponding geopositioned coordinate or area. Mean stunting prevalence of the input coordinate or area is mapped. This database consists of 50,142 clusters and 4,253 polygons with a sample size totalling over 1.15 million children in Africa. Maps reflect administrative boundaries, land cover, lakes and population; pixels with fewer than ten people per 1 × 1 km and classified as ‘barren or sparsely vegetated’ are coloured in grey.
Figure 7
Figure 7. Map of GBD regions.
Modelling regions were defined as the five GBD regions of Central (central SSA), East (eastern SSA), North (North Africa and the Middle East), South (southern SSA) and West Africa (western SSA). As this study was limited to mainland Africa and African island nations, select countries were excluded from the North Africa and Middle East region (Afghanistan, Bahrain, Iran, Iraq, Jordan, Kuwait, Lebanon, Oman, Palestinian territories, Qatar, Saudi Arabia, Syria, Turkey, United Arab Emirates, and Yemen). Western Sahara was included as part of the North region.

Comment in

  • Precision maps for public health.
    Reich BJ, Haran M. Reich BJ, et al. Nature. 2018 Mar 1;555(7694):32-33. doi: 10.1038/d41586-018-02096-w. Nature. 2018. PMID: 29493618 No abstract available.

References

    1. GBD 2016 Risk Factors Collaborators. Global, regional, and national comparative risk assessment of 84 behavioural, environmental and occupational, and metabolic risks or clusters of risks, 1990–2016: a systematic analysis for the Global Burden of Disease Study 2016. Lancet 390, 1345–1422 (2017) - PMC - PubMed
    1. Black R. E. et al. Maternal and child undernutrition: global and regional exposures and health consequences. Lancet 371, 243–260 (2008) - PubMed
    1. Pelletier D. L. & Frongillo E. A. Changes in child survival are strongly associated with changes in malnutrition in developing countries. J. Nutr. 133, 107–119 (2003) - PubMed
    1. World Health Organization & United Nations Children’s Fund. WHO Child Growth Standards and the Identification of Severe Acute Malnutrition in Infants and Children: A Joint Statement (WHO Press, 2009) - PubMed
    1. Wang Y. & Chen H.-J. in Handbook of Anthropometry (ed.Preedy V. R.) 29–48 (Springer, 2012)

Publication types

MeSH terms