. 2018 Apr;103(4):615-628.
doi: 10.1002/JLB.3HI1017-422R. Epub 2018 Mar 1.

Frontline Science: Rapid adipose tissue expansion triggers unique proliferation and lipid accumulation profiles in adipose tissue macrophages

Affiliations

Frontline Science: Rapid adipose tissue expansion triggers unique proliferation and lipid accumulation profiles in adipose tissue macrophages

Lindsey A Muir et al. J Leukoc Biol. 2018 Apr.

Abstract

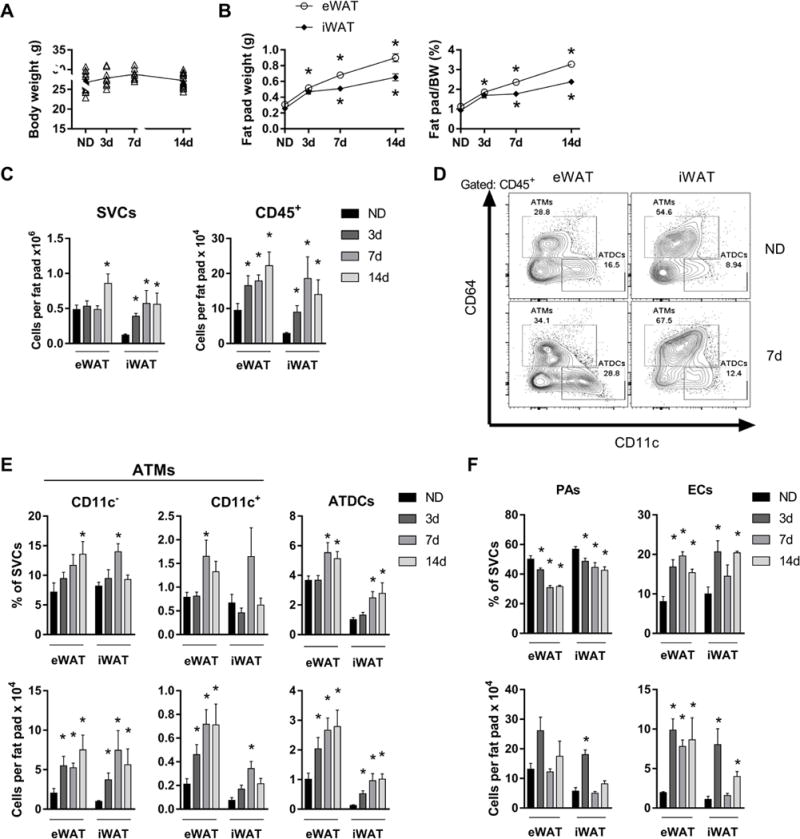
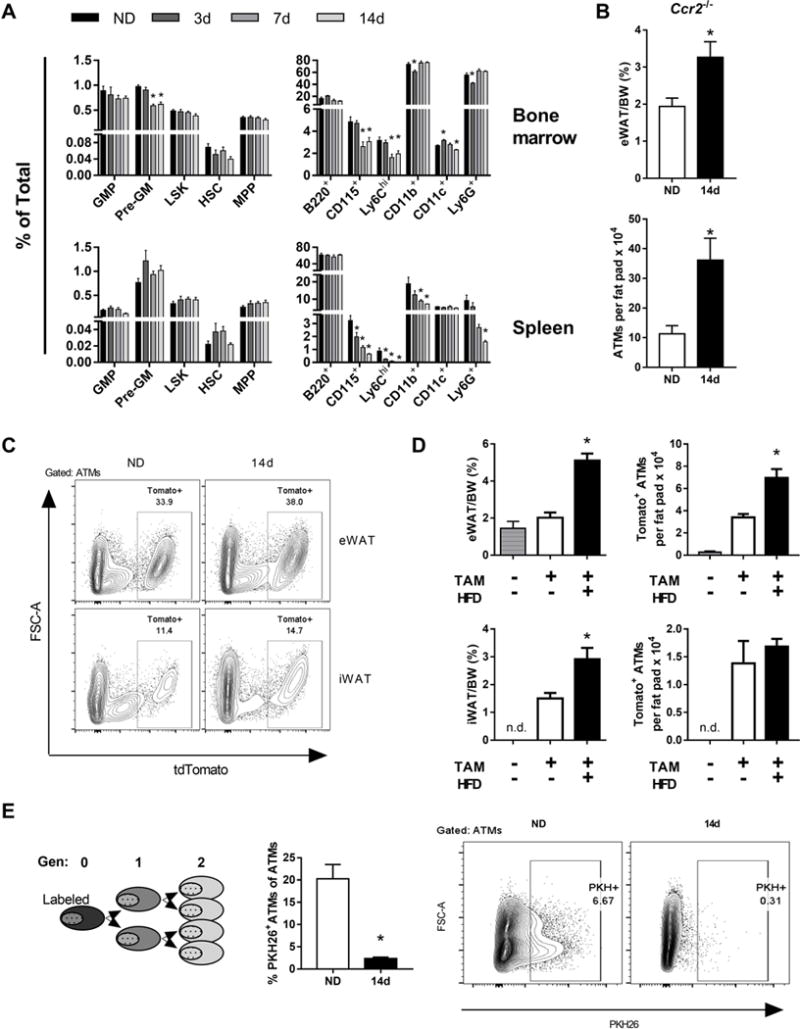
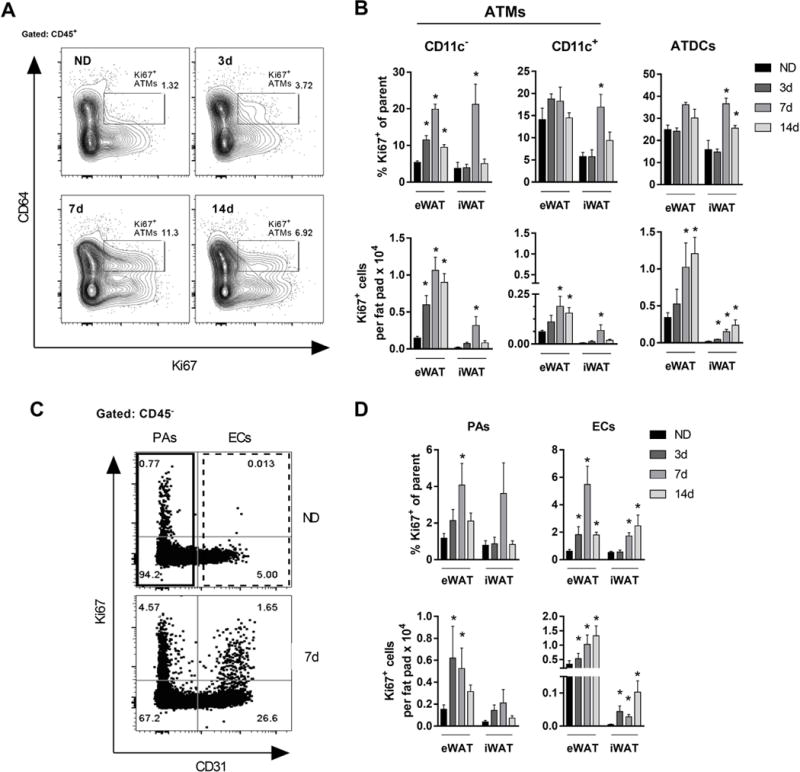
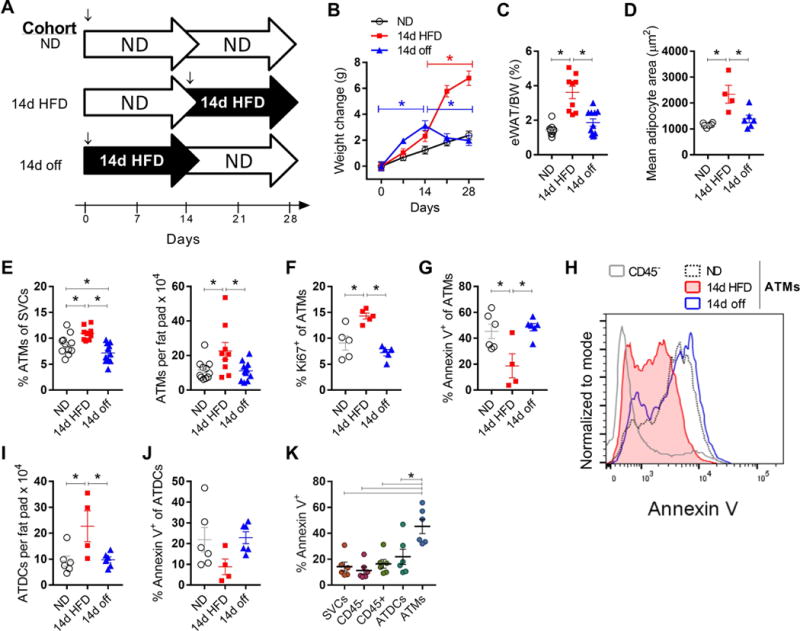
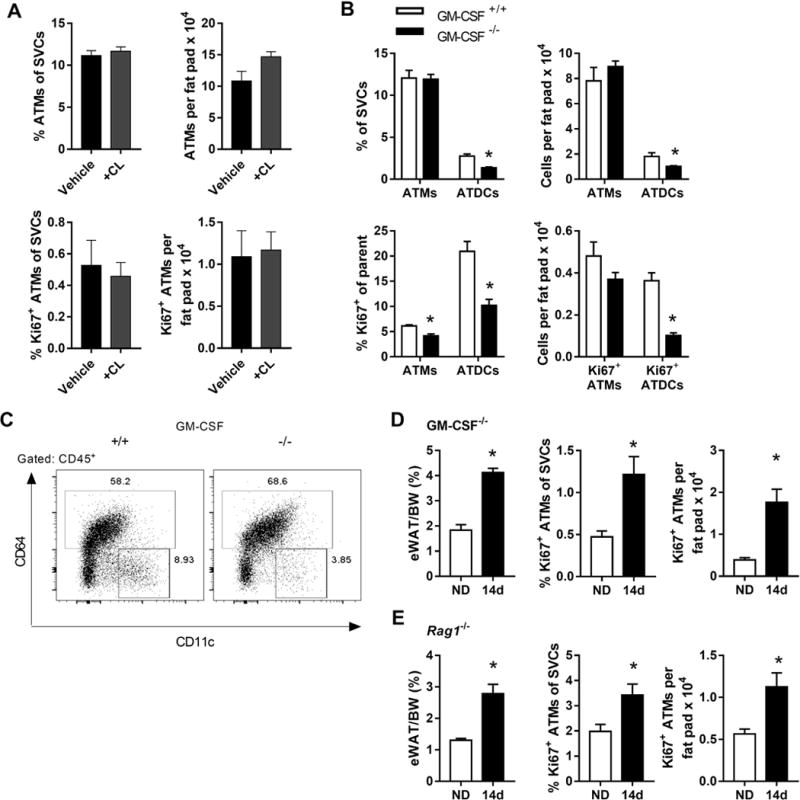
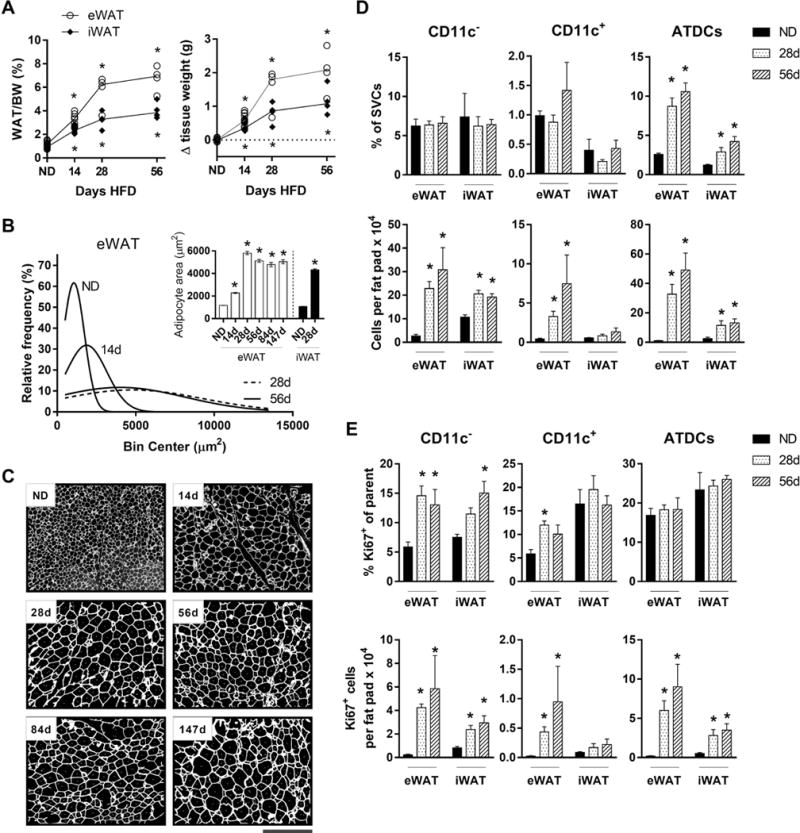
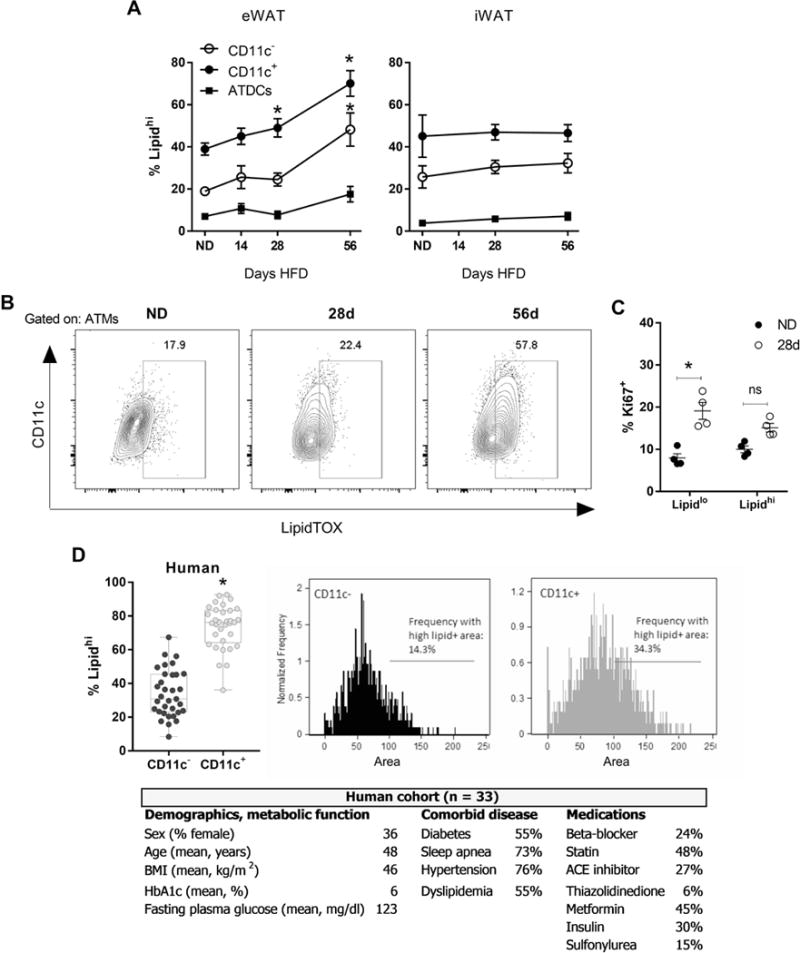
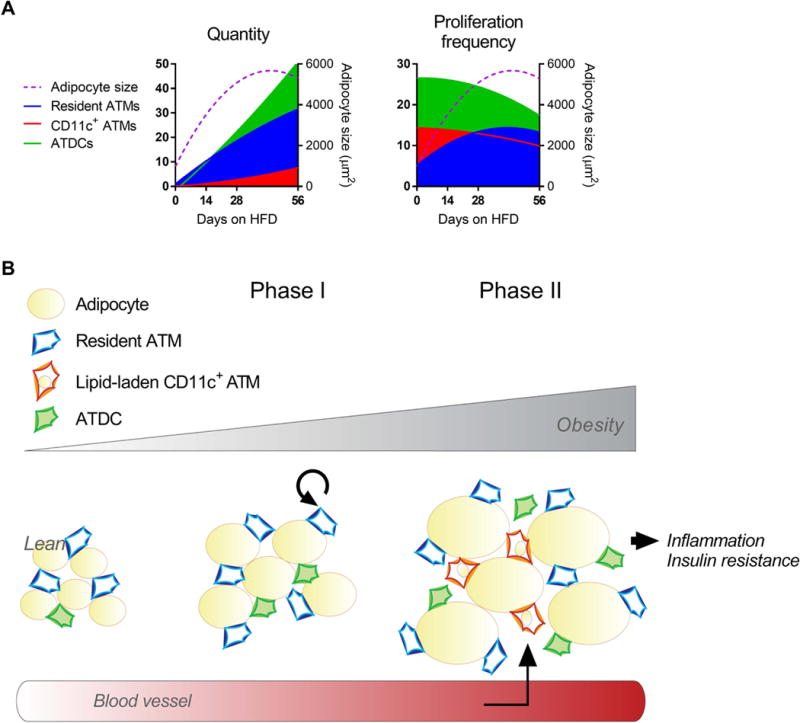
Obesity-related changes in adipose tissue leukocytes, in particular adipose tissue macrophages (ATMs) and dendritic cells (ATDCs), are implicated in metabolic inflammation, insulin resistance, and altered regulation of adipocyte function. We evaluated stromal cell and white adipose tissue (WAT) expansion dynamics with high fat diet (HFD) feeding for 3-56 days, quantifying ATMs, ATDCs, endothelial cells (ECs), and preadipocytes (PAs) in visceral epididymal WAT and subcutaneous inguinal WAT. To better understand mechanisms of the early response to obesity, we evaluated ATM proliferation and lipid accumulation. ATMs, ATDCs, and ECs increased with rapid WAT expansion, with ATMs derived primarily from a CCR2-independent resident population. WAT expansion stimulated proliferation in resident ATMs and ECs, but not CD11c+ ATMs or ATDCs. ATM proliferation was unperturbed in Csf2- and Rag1-deficient mice with WAT expansion. Additionally, ATM apoptosis decreased with WAT expansion, and proliferation and apoptosis reverted to baseline with weight loss. Adipocytes reached maximal hypertrophy at 28 days of HFD, coinciding with a plateau in resident ATM accumulation and the appearance of lipid-laden CD11c+ ATMs in visceral epididymal WAT. ATM increases were proportional to tissue expansion and adipocyte hypertrophy, supporting adipocyte-mediated regulation of resident ATMs. The appearance of lipid-laden CD11c+ ATMs at peak adipocyte size supports a role in responding to ectopic lipid accumulation within adipose tissue. In contrast, ATDCs increase independently of proliferation and may be derived from circulating precursors. These changes precede and establish the setting in which large-scale adipose tissue infiltration of CD11c+ ATMs, inflammation, and adipose tissue dysfunction contributes to insulin resistance.

Keywords: adipocyte; adipose tissue dendritic cell; apoptosis; foam cell; obesity.


Conflict of interest statement

CONFLICT OF INTEREST DISCLOSURE

The authors declare no conflict of interest.

Figures

Figure 1
Figure 1
Increased ATMs, ATDCs, and endothelial cells with rapid WAT expansion. Body weights (A) and fat pad weights normalized to body weight (BW) (B) of mice fed ND or 60% HFD for 3-14 days. (C) Quantity of SVCs and CD45+ leukocytes in eWAT and iWAT. (D) Representative flow plots showing ATM and ATDC frequencies in eWAT and iWAT for ND and mice fed HFD for 7 days. (E and F) Frequency and quantity of CD11c ATMs, CD11c+ ATMs, ATDCs, preadipocytes (PAs), and endothelial cells (ECs) in ND and in mice fed HFD for 3-14 days. *, p<0.05.
Figure 2
Figure 2
Accumulation of ATMs in rapid WAT expansion independent of monocytes and CCR2. (A) Frequencies of monocyte stem cell precursors in bone marrow and spleen in ND and mice fed HFD for 3-7 days. (B) eWAT weights normalized to body weight (BW) and ATM quantities in CCR2−/− mice were fed ND or HFD for 14 days. (C) Representative flow plots from Cx3cr1-CreERT-IRES-YFP::tdTomatofl/fl mice with induced expression of Tomato in ATMs, 14 weeks after tamoxifen treatment. eWAT and iWAT are shown for mice fed ND or HFD for 14 days. (D) eWAT and iWAT weights and quantity of Tomato+ ATMs with or without tamoxifen and HFD feeding for 14 days. (E) Phagocyte-specific PKH26 labeling of ATMs in mice fed ND or HFD for 14 days. *, p<0.05.
Figure 3
Figure 3
Proliferation of CD11c ATMs and ECs during rapid WAT expansion. (A) Representative flow plots showing Ki67+ (proliferating) ATMs. (B) Frequency and quantity of proliferating CD11c ATMs, CD11c+ ATMs, and ATDCs in mice fed ND or HFD for 3-24 days. (C) Representative flow plots showing frequency of proliferating PAs and ECs in mice fed ND or HFD for 7 days. (D) Frequency and quantity of proliferating PAs and ECs in mice fed ND or HFD for 3-14 days. *, p<0.05.
Figure 4
Figure 4
Weight loss decreases ATM proliferation. (A) Feeding scheme for ND, 14d HFD, and 14d off cohorts. ↓, mice were age matched at 8-9 weeks of age for start of HFD. (B and C) Weight gain and eWAT weights for each cohort. (D) eWAT mean adipocyte size. (E) ATM frequency and quantity. (F) ATM proliferating frequency. (G) Apoptosis in ATMs, measured by frequency of Annexin V+ cells. (H) Representative histogram of flow cytometry data showing Annexin V in ATMs and CD45 SVCs. (I-J) Quantity of ATDCs in each cohort and frequency of Annexin V+ ATDCs. (K) Comparison of Annexin V staining among SVCs. *, p<0.05.
Figure 5
Figure 5
ATM proliferation is unchanged with lipolysis and independent of GM-CSF, T and B cells. (A) Lean mice were treated with vehicle or the beta 3-adrinergic agonist CL316,243 (CL). Frequency and quantity of ATMs and proliferating ATMs were quantified. (B) Frequency and quantity of ATMs and ATDCs, and frequency and quantity of proliferating ATMs and ATDCs in WT (GM-CSF+/+) and GM-CSF−/− mice. (C) Representative flow plots showing the frequency of ATDCs (CD64CD11c+) in GM-CSF+/+ vs. GM-CSF−/− mice. (D and E) eWAT weights and frequency and quantity of proliferating ATMs in GM-CSF−/− mice (D) and Rag1−/− mice (E) fed ND or HFD for 14 days. *, p<0.05.
Figure 6
Figure 6
Adipocyte size corresponds to peak resident ATM but not ATDC quantity. (A). WAT weight and change in tissue weight in mice fed ND or HFD for 14-58 days. Upper and lower asterisks indicate significant for eWAT and iWAT, respectively, compared to ND controls. (B) eWAT adipocyte sizing curve approximations in mice fed ND or HFD for 14-58 days. Inset, mean eWAT and iWAT adipocyte sizes at given time points. (C) Images showing eWAT adipocyte sizes in mice fed ND or HFD for 14-147 days (see Materials and Methods). Scale bar represents 500 μm. (D and E) Frequency, quantity, and proliferating frequency and quantity of CD11c ATMs, CD11c+ ATMs, and ATDCs in mice fed ND or HFD for 28-56 days. *, p<0.05.
Figure 7
Figure 7
Lipid-laden ATMs develop once adipocyte hypertrophy is maximal. (A) Frequency of lipidhi CD11c ATMs, CD11c+ ATMs, and ATDCs in eWAT and iWAT in mice fed ND or HFD for 14-56 days. (B) Representative flow plots of ATMs and the frequency of lipidhi cells as determined by LipidTOX staining in mice fed ND or HFD for 28-56 days. (C) Frequency of proliferation in lipidlo vs. lipidhi mouse ATMs. (D) Lipid content of omental CD11c and CD11c+ ATMs in human obesity (n=33), by flow cytometry to determine frequency of lipidhi cells, and by imaging flow cytometry to quantify the lipid+ area within each cell. Demographics, measures of metabolic function, comorbid disease, and medications are given for the human cohort. HbA1c, glycated hemoglobin. *, p<0.05.
Figure 8
Figure 8
A model for stromal cell and tissue dynamics in early obesity. (A) Representations of quantity and proliferation frequency for resident ATMs, CD11c+ ATMs, and ATDCs (left Y axes), and adipocyte size (right Y axes). (B) An illustration of stromal cell and adipocyte dynamics, with two major phases dominating early obesity. Phase I encompasses rapid WAT expansion, resident ATM proliferation and ATDC infiltration. In Phase II, adipocyte stress at peak size cues ATM lipid accumulation and CD11c+ ATM recruitment.

Comment in

  • Adipose tissue's rapid response team.
    Fried SK. Fried SK. J Leukoc Biol. 2018 Apr;103(4):611-613. doi: 10.1002/JLB.1CE0118-006R. Epub 2018 Mar 13. J Leukoc Biol. 2018. PMID: 29534319 Free PMC article. No abstract available.

References

    1. Unger RH, Scherer PE. Gluttony, sloth and the metabolic syndrome: A roadmap to lipotoxicity. Trends Endocrinol Metab. 2010;21:345–52. - PMC - PubMed
    1. Ohman MK, Wright AP, Wickenheiser KJ, Luo W, Eitzman DT. Visceral adipose tissue and atherosclerosis. Curr Vasc Pharmacol. 2009;7:169–79. - PubMed
    1. Weisberg SP, McCann D, Desai M, Rosenbaum M, Leibel RL, Ferrante AW., Jr Obesity is associated with macrophage accumulation in adipose tissue. J Clin Invest. 2003;112:1796–808. - PMC - PubMed
    1. Xu H, Barnes GT, Yang Q, Tan G, Yang D, Chou CJ, Sole J, Nichols A, Ross JS, Tartaglia LA, Chen H. Chronic inflammation in fat plays a crucial role in the development of obesity-related insulin resistance. J Clin Invest. 2003;112:1821–30. - PMC - PubMed
    1. Reilly SM, Saltiel AR. Adapting to obesity with adipose tissue inflammation. Nat Rev Endocrinol. 2017;11:90. - PubMed

Publication types