Review
. 2018 Jun;79(6):3172-3193.
doi: 10.1002/mrm.27101. Epub 2018 Mar 1.

On modeling

Affiliations
Review

On modeling

Dmitry S Novikov et al. Magn Reson Med. 2018 Jun.

Abstract

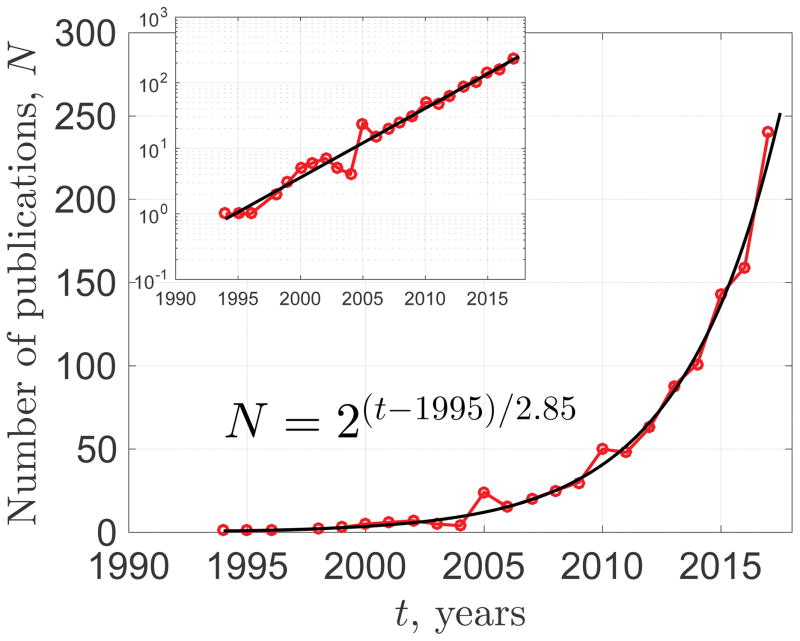
Mapping tissue microstructure with MRI holds great promise as a noninvasive window into tissue organization at the cellular level. Having originated within the realm of diffusion NMR in the late 1970s, this field is experiencing an exponential growth in the number of publications. At the same time, model-based approaches are also increasingly incorporated into advanced MRI acquisition and reconstruction techniques. However, after about two decades of intellectual and financial investment, microstructural mapping has yet to find a single commonly accepted clinical application. Here, we suggest that slow progress in clinical translation may signify unresolved fundamental problems. We outline such problems and related practical pitfalls, as well as review strategies for developing and validating tissue microstructure models, to provoke a discussion on how to bridge the gap between our scientific aspirations and the clinical reality. We argue for recalibrating the efforts of our community toward a more systematic focus on fundamental research aimed at identifying relevant degrees of freedom affecting the measured MR signal. Such a focus is essential for realizing the truly revolutionary potential of noninvasive three-dimensional in vivo microstructural mapping.

Keywords: functional form; microstructure; model; representation; validation.


Figures

Figure 1
Figure 1. The exponentially increasing field of microstructural mapping
Shown is the number N of PubMed entries found with both “MRI” and “microstructure” in the title or abstract (search string: MRI[Title/Abstract] AND microstructure[Title/Abstract]). N(t) has doubled every 2.9 years for nearly two decades. Moreover, the fraction of microstructure papers within all MRI papers also grows exponentially, doubling every 4.4 years (not shown). The inset validates the functional form of the exponentially increasing N(t). Deriving the effective theory behind this observation is beyond the scope of this work.
Figure 2
Figure 2. Models are sketches of reality
For an illustration, Leonardo’s Mona Lisa plays the role of reality. Model 1 has obviously more features and may be given preference by computer algorithms (e.g. when minimizing the rms difference), but the majority of human observers (and perhaps really smart algorithms) will likely consider Model 2 as more meaningful. A theory here can be formulated as “this is a person”, which immediately defines the most relevant features (“degrees of freedom”), yielding Model 2. Making a sketch of a painting is analogous to coarse-graining: it is not just smoothing, but rather selecting the most meaningful features and disregarding the rest. The same operation is subconsciously performed by our brain when we look at a painting from afar.
Figure 3
Figure 3. The mathematical flexibility of the biexponential representation
Fitting a biexponential function S = f1ebD1 + f2ebD2, with f1 + f2 = 1, to the noise-free Callaghan’s model (6) of diffusion inside isotropically distributed one-dimensional channels, with the exact signal expression (16, 35) shown in panel A. D|| is the diffusivity along the channels. The substantial mathematical difference in signal expressions does not prevent the biexponential function to achieve a very high fit quality (A). The inadequacy of the biexponential representation becomes apparent only for extremely large bD|| (B), or from the dependence of its fit parameters on the range of data used for fitting (C). In these simulations, 1001 b-values were uniformly distributed from 0 to bmax.
Figure 4
Figure 4. Quality of fit alone does not validate a model: the wrong expression sometimes fits better than the true model
A biexponential signal S = 0.8e−1.2b + 0.2e−0.2b was computed for b-values from 0 to 3.5 in steps of 0.5 (all below the convergence radius (93) of the cumulant expansion (85)). Fitting quality of the three representations was compared over 10,000 realizations of additive Gaussian noise: the cumulant expansion S = S0 ebD+kb2 (terminated at the kurtosis term), the biexponential, and the stretched exponential function, with the number of adjustable parameters 3, 4 and 3, respectively. The initial values for the fitting of the biexponential and stretched exponential functions were generated using the ground truth. The distributions of the corresponding corrected Akaike information criterion (AICc) (172, 173) is shown for the increasing noise level (panels A to C). AICc represents χ2 penalized by the number of fit degrees of freedom; the smaller AICc, the better the fit quality. (A) AICc values prefer the ground truth (bi-exp) for extremely low noise. (B) Increase in the noise to more realistic levels makes the cumulant expansion perform better due to the fewer number of parameters. (C) For the clinically realistic SNR = 20, AICc for the correct model is the worst. In this case, the intrinsic inaccuracy of the representations is completely masked by the noise, therefore AICc is dominated by the penalty term for the number of degrees of freedom. Vertical solid lines in all panels show the mean of distributions, while vertical dashed lines show the corresponding theoretical estimates.
Figure 5
Figure 5. Examples of nontrivial functional dependences suitable for model validation
(A) Deviation of diffusion coefficient in sand grains (115, 116) from its bulk value at short times is proportional to t (data falling onto a straight line for small t); such a scaling is a signature of the hard-walled restrictions (14). (B) Deviation of transverse relaxation from the monoexponential form with rate constant R2 is characterized by the derivative dR2/dt~t-v at large t. The exponent v depends on the large-scale structural organization of tissue (122), with v = 3/2 for randomly placed impermeable spheres, and v = 2 for the so-called “maximally random jammed state” (174), in which no sphere can be moved independently from the others. Color lines show results of Monte Carlo simulations, solid black lines show corresponding analytical results and the dotted lines serve as eye guides for the predicted slope. (C) Water dMRI signal, averaged over diffusion directions, from white matter of four human subjects (colors) behaves as b−1/2 for large b (data from ref. (94)). This can be appreciated by the data falling on a straight line when plotted as a function of b−1/2. Black circles show the diffusion direction-averaged NAA signal from rat brain (data from ref. (35)), adjusted for the lower NAA diffusion coefficient and scaled by the T2-weighted intra-axonal water fraction to match the human data, see ref. (94). The difference between the water and NAA curves at low b are due to the extra-axonal space (EAS) contribution; the matching b−1/2 behavior at large b illustrates qualitative similarity of water and NAA diffusion within practically impermeable “sticks” (zero-radius cylinders), while the EAS contribution becomes exponentially suppressed. (D) The signal in the Callaghan’s model changes radically, becoming monoxeponential, when measured with the isotropic diffusion weighting (–127).

References

    1. Abbe E. Beiträge zur Theorie des Mikroskops und der mikroskopischen Wahrnehmung. Archiv für mikroskopische Anatomie. 1873;9(1):413–8.
    1. Betzig E. Nobel Lecture: Single molecules, cells, and super-resolution optics. Rev Mod Phys. 2015;87(4) doi: 10.1103/RevModPhys.87.1153. - DOI - PubMed
    1. Hell SW. Nobel Lecture: Nanoscopy with freely propagating light. Rev Mod Phys. 2015;87(4) doi: 10.1103/RevModPhys.87.1169. - DOI
    1. Moerner WE. Nobel Lecture: Single-molecule spectroscopy, imaging, and photocontrol: Foundations for super-resolution microscopy. Rev Mod Phys. 2015;87(4) doi: 10.1103/RevModPhys.87.1183. - DOI - PubMed
    1. Tanner JE. Self diffusion of water in frog muscle. Biophys J. 1979;28(1):107–16. doi: 10.1016/S0006-3495(79)85162-0. - DOI - PMC - PubMed

Publication types