. 2018 Apr;13(4):633-651.
doi: 10.1038/nprot.2017.151. Epub 2018 Mar 1.

Data processing, multi-omic pathway mapping, and metabolite activity analysis using XCMS Online

Affiliations

Data processing, multi-omic pathway mapping, and metabolite activity analysis using XCMS Online

Erica M Forsberg et al. Nat Protoc. 2018 Apr.

Abstract

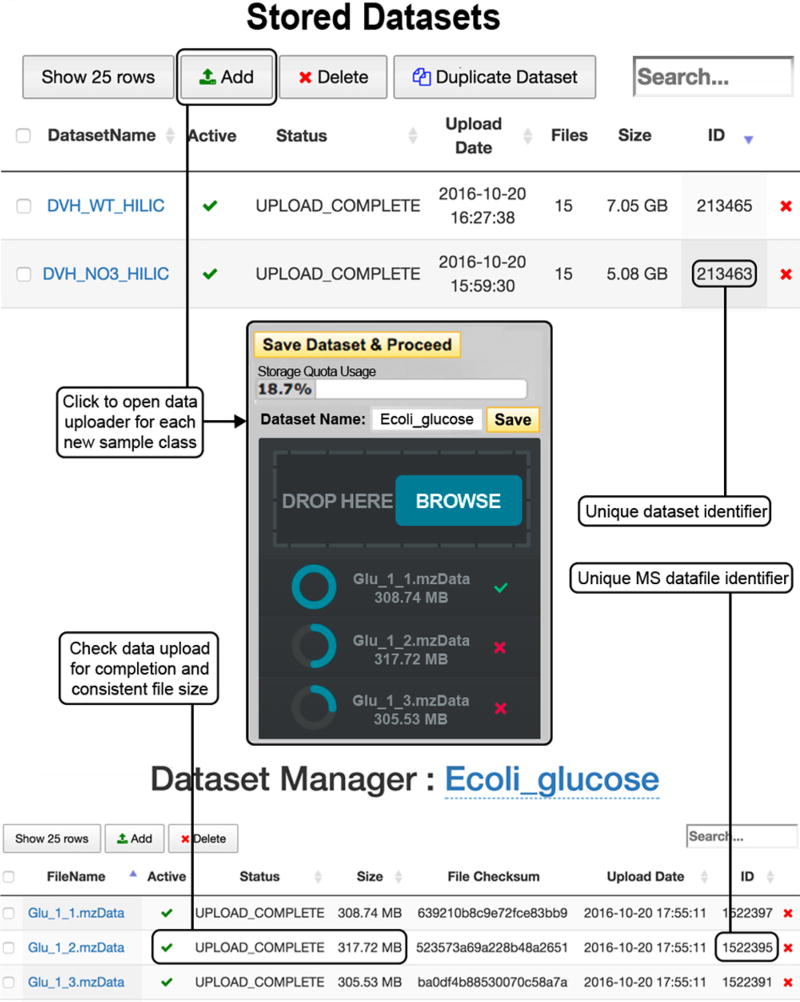
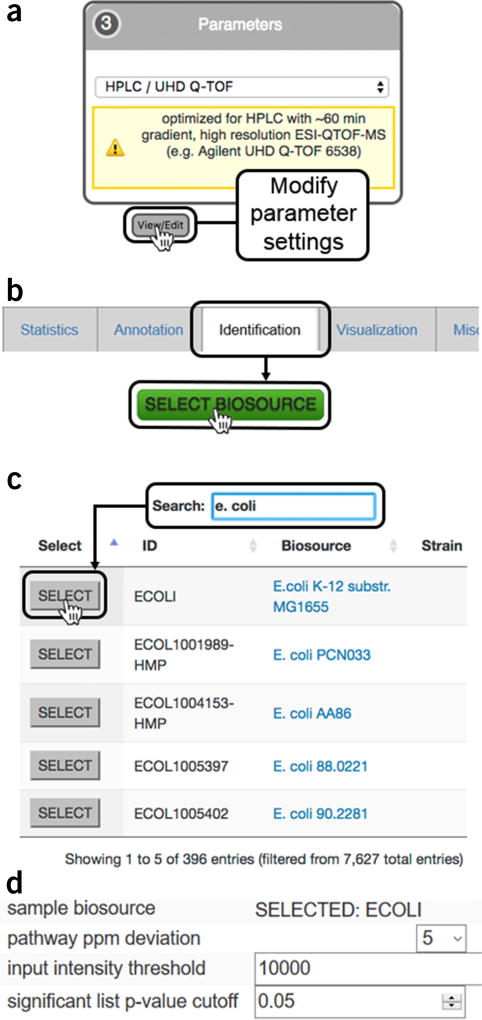
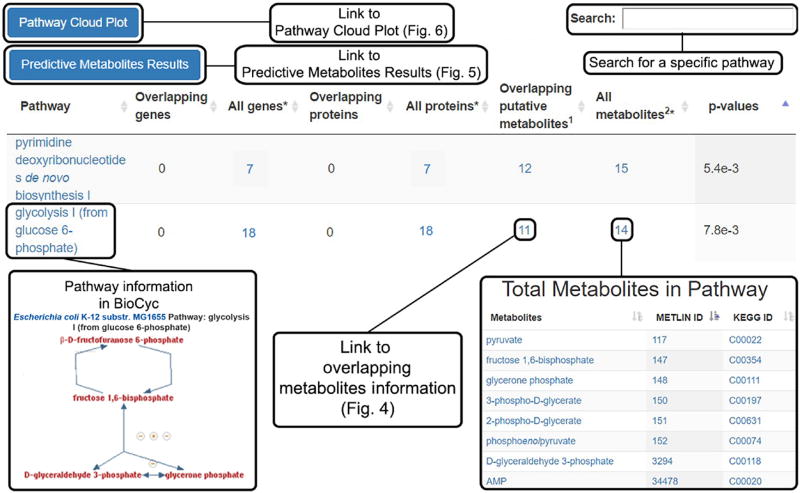
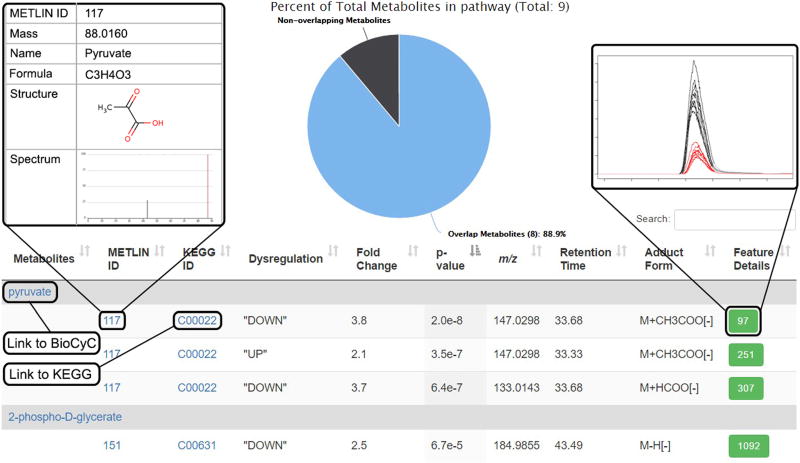
Systems biology is the study of complex living organisms, and as such, analysis on a systems-wide scale involves the collection of information-dense data sets that are representative of an entire phenotype. To uncover dynamic biological mechanisms, bioinformatics tools have become essential to facilitating data interpretation in large-scale analyses. Global metabolomics is one such method for performing systems biology, as metabolites represent the downstream functional products of ongoing biological processes. We have developed XCMS Online, a platform that enables online metabolomics data processing and interpretation. A systems biology workflow recently implemented within XCMS Online enables rapid metabolic pathway mapping using raw metabolomics data for investigating dysregulated metabolic processes. In addition, this platform supports integration of multi-omic (such as genomic and proteomic) data to garner further systems-wide mechanistic insight. Here, we provide an in-depth procedure showing how to effectively navigate and use the systems biology workflow within XCMS Online without a priori knowledge of the platform, including uploading liquid chromatography (LC)-mass spectrometry (MS) data from metabolite-extracted biological samples, defining the job parameters to identify features, correcting for retention time deviations, conducting statistical analysis of features between sample classes and performing predictive metabolic pathway analysis. Additional multi-omics data can be uploaded and overlaid with previously identified pathways to enhance systems-wide analysis of the observed dysregulations. We also describe unique visualization tools to assist in elucidation of statistically significant dysregulated metabolic pathways. Parameter input takes 5-10 min, depending on user experience; data processing typically takes 1-3 h, and data analysis takes ∼30 min.


Conflict of interest statement

COMPETING FINANCIAL INTERESTS The authors declare no competing financial interests.

Figures

Figure 1
Figure 1
Upload of mass spectrometry data (Steps 2–5). To upload a data set for each sample class, go to the ‘Stored Datasets’ menu option (top). Previously stored data sets are found here, each with a unique data set identifier. Click ‘Add Dataset(s)’ to open the data uploader window (center). Files can be selected from the file directory or by dragging and dropping where indicated. Once the upload is complete, as indicated by a full blue circle and a green check mark, press ‘Save Dataset & Proceed’. Click on the name of the new data set to open the ‘View/Edit Dataset(s)’ window (bottom) and check that the upload is complete and the file sizes are equal to those of the original.
Figure 2
Figure 2
Predictive pathway analysis parameter settings (Step 14). (a) The organism metabolic model, or biosource, for performing pathway analysis is selected during job creation while editing XCMS processing parameters under the ‘Identification’ tab during job creation; (b) clicking on the ‘SELECT BIOSOURCE’ button opens a new window with all the metabolic models available; (c) the search bar can be used to find the desired metabolic model. Clicking on the biosource link opens a link to BioCyc with a summary of the pathway information. Pressing the ‘SELECT’ button chooses the model and closes the window; (d) the correct metabolic model should now be visible in the ‘Identification’ tab under ‘sample biosource’ and ‘pathway ppm deviation’ can be selected from the dropdown menu; ‘input intensity threshold’ for peaks and P value for significant features can specified by the user.
Figure 3
Figure 3
Predictive metabolic pathway results (Steps 20–24). Pairwise and multigroup jobs will automatically generate a table of predicted metabolic pathways; the total genes, proteins and metabolites known to be associated with the pathways; the putatively identified dysregulated metabolites; and the calculated P value for pathway significance. Clicking the name of the pathway opens a BioCyc pathway map, whereas the numbers in the table link to more detailed information about the respective total genes, proteins and metabolites. Overlapping metabolites lead to detailed information on the dysregulated metabolic features (Fig. 4). Overlapping genes and proteins will not be tabulated unless multi-omics integration is performed. At the top left of the table are links to the Predictive Metabolites Results (Fig. 5) and the Pathway Cloud Plot (Fig. 6). At the top right of the page is a search bar retrieving specific pathway information.
Figure 4
Figure 4
Overlapping metabolite information (Steps 24–29). Dysregulated metabolic features involved in a pathway are opened when this link is clicked from the Systems Biology Results page. The pie chart at the top shows the percentage of dysregulated metabolites putatively identified in the pathway. The table underneath shows information for each metabolite identified by the predictive pathway algorithm. Each metabolite is followed by individual entries for detected adducts matching the accurate mass within the defined deviation threshold (p.p.m.). Information for each feature from the XCMS-processed results is provided: the ‘METLIN ID’, the ‘KEGG ID’, direction of dysregulation, fold change, P value, average accurate mass m/z of the peak, retention time, adduct form and ‘Feature Details’ (green boxes), which give the XCMS ‘feature ID’ number. Clicking on a feature ID number opens a pop-up window with an extracted ion chromatogram (shown), a mass spectrum and a box-and-whisker plot (not shown). Entries in blue font link to a new page when clicked, linking to more detailed information.
Figure 5
Figure 5
Predictive metabolites results (Steps 36–40). This table is accessed from the Systems Biology Results page to display all the dysregulated metabolites used in the predicted pathway analysis and all the pathways within that organism that each metabolite is involved in. Metabolites are matched to one or more features on the basis of the detected accurate mass m/z adduct forms and the defined deviation threshold (p.p.m.) from the m/z value of the accurate mass. Information for each metabolic feature is also tabulated, including direction of dysregulation, fold change, P value, m/z, retention time, adduct form and the XCMS feature ID number (green box). Clicking the unique feature ID opens a pop-up window displaying the MS spectrum, LC chromatogram and box-and-whisker plot for that metabolic feature.
Figure 6
Figure 6
Pathway cloud plot (Steps 42–46). This plot illustrates the results of the predictive pathway analysis. Each pathway is displayed as a circle, with the x axis representing the percentage of metabolite overlap within that pathway and the y axis representing increased pathway significance calculated from the pathway analysis. The radius of each circle is proportional to the total number of metabolites in the pathway. Drawing a rectangle with the cursor zooms into that part of the plot; clicking on the ‘Reset zoom’ button at the top right of the graph resets to the original plot. Adjusting the P value threshold in the filter box at the top left of the figure displays pathways with P values below that threshold. Sliding the ‘bubble radius multiplier’ adjusts the circle radius to better view and compare pathways. Hovering the cursor over the circle generates pop-up information on that pathway. Clicking on a circle displays pathway results below the plot, in which additional information can be accessed through the hyperlinks, such as overlapping metabolites information (Fig. 4). If multiple pathways are overlaid on the plot, they can be found in the table below.
Figure 7
Figure 7
Multi-omics integration (Steps 47–50). Uploading of multi-omics data occurs in the ‘Matching Parameter Sub-Job’ window. Gene, transcript and/or protein data can be uploaded in .csv or .tsv format using the ‘UPLOAD LIST’ button. ‘List Type’ must be selected from the dropdown box and, if uploading protein data, the ‘Accession ID’ format must also be selected before clicking ‘Run matching subjob’. Once the job is complete, the progress bar will be at 100%. The matched genes or proteins from the analysis can be viewed under ‘View Results’; the run log can be accessed by pressing ‘View Log’.
Figure 8
Figure 8
Multi-omics results (Steps 51–59). After the multi-omics subjob has been completed, the overlapping genes and proteins will be populated in the Systems Biology Results table. Clicking on the overlapping gene number opens to a detailed list with specific genes that were found to overlap with the pathways. Links to BioCyc gene and enzyme reaction information are also provided. Clicking on the ‘Overlapping proteins’ number opens to a detailed list with specific proteins that were found to overlap with the pathway. Links to BioCyc encoding gene and Uniprot protein information are available. Clicking the number under ‘Pathways Involved’ opens a list of related pathways with links to BioCyc metabolic pathway information.

Comment in

  • Systems biology guided by XCMS Online metabolomics.
    Huan T, Forsberg EM, Rinehart D, Johnson CH, Ivanisevic J, Benton HP, Fang M, Aisporna A, Hilmers B, Poole FL, Thorgersen MP, Adams MWW, Krantz G, Fields MW, Robbins PD, Niedernhofer LJ, Ideker T, Majumder EL, Wall JD, Rattray NJW, Goodacre R, Lairson LL, Siuzdak G. Huan T, et al. Nat Methods. 2017 Apr 27;14(5):461-462. doi: 10.1038/nmeth.4260. Nat Methods. 2017. PMID: 28448069 Free PMC article. No abstract available.

References

    1. Goodacre R, Vaidyanathan S, Dunn WB, Harrigan GG, Kell DB. Metabolomics by numbers: acquiring and understanding global metabolite data. Trends Biotechnol. 2004;22:245–252. - PubMed
    1. Fondi M, Liò P. Multi-omics and metabolic modelling pipelines: challenges and tools for systems microbiology. Microbiol. Res. 2015;171:52–64. - PubMed
    1. Patti GJ, Yanes O, Siuzdak G. Metabolomics: the apogee of the omics trilogy. Nat. Rev. Mol. Cell Biol. 2012;13:263–269. - PMC - PubMed
    1. Zampieri M, Sekar K, Zamboni N, Sauer U. Frontiers of high-throughput metabolomics. Curr. Opin. Chem. Biol. 2017;36:15–23. - PubMed
    1. Cajka T, Fiehn O. Toward merging untargeted and targeted methods in mass spectrometry-based metabolomics and lipidomics. Anal. Chem. 2016;88:524–545. - PubMed

Publication types