

Statistical power and utility of meta-analysis methods for cross-phenotype genome-wide association studies
- PMID: 29494641
- PMCID: PMC5832233
- DOI: 10.1371/journal.pone.0193256
Statistical power and utility of meta-analysis methods for cross-phenotype genome-wide association studies
Abstract
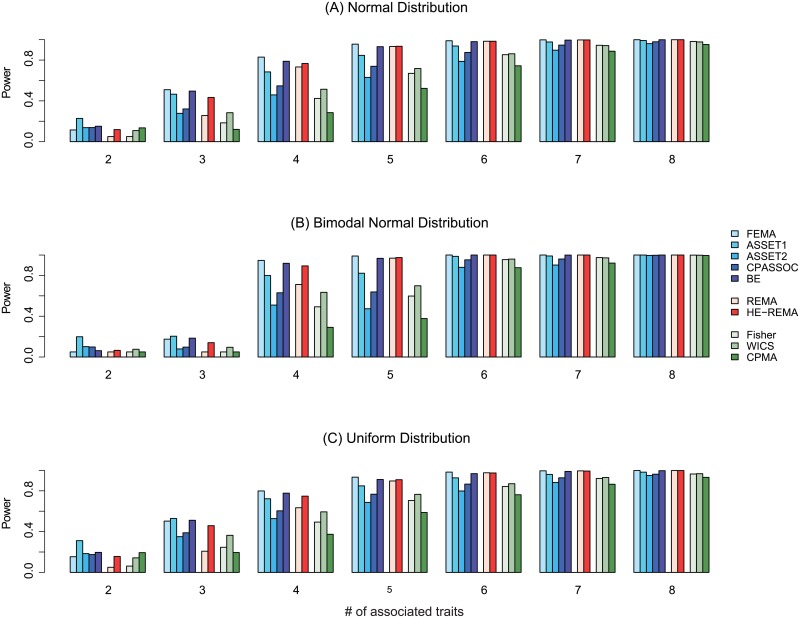
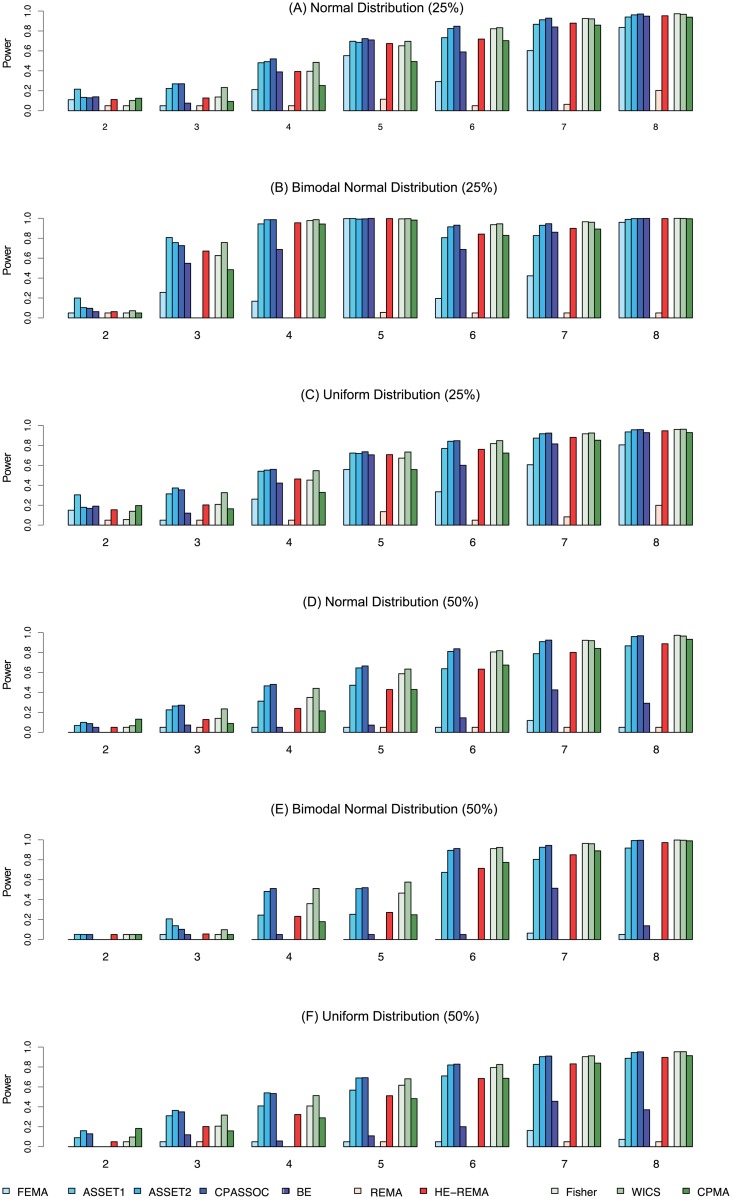
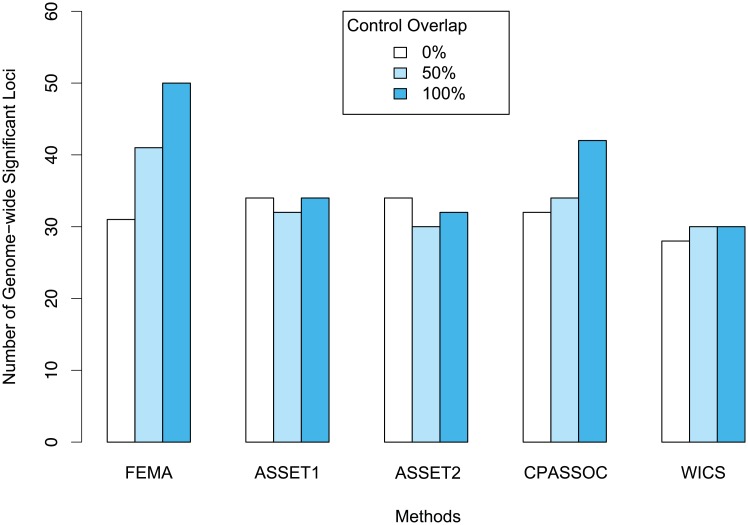
Advances in recent genome wide association studies (GWAS) suggest that pleiotropic effects on human complex traits are widespread. A number of classic and recent meta-analysis methods have been used to identify genetic loci with pleiotropic effects, but the overall performance of these methods is not well understood. In this work, we use extensive simulations and case studies of GWAS datasets to investigate the power and type-I error rates of ten meta-analysis methods. We specifically focus on three conditions commonly encountered in the studies of multiple traits: (1) extensive heterogeneity of genetic effects; (2) characterization of trait-specific association; and (3) inflated correlation of GWAS due to overlapping samples. Although the statistical power is highly variable under distinct study conditions, we found the superior power of several methods under diverse heterogeneity. In particular, classic fixed-effects model showed surprisingly good performance when a variant is associated with more than a half of study traits. As the number of traits with null effects increases, ASSET performed the best along with competitive specificity and sensitivity. With opposite directional effects, CPASSOC featured the first-rate power. However, caution is advised when using CPASSOC for studying genetically correlated traits with overlapping samples. We conclude with a discussion of unresolved issues and directions for future research.
Conflict of interest statement
Figures
References
-
- Solovieff N, Cotsapas C, Lee PH, Purcell SM, Smoller JW (2013) Pleiotropy in complex traits: challenges and strategies. Nat Rev Genet 14: 483–495. doi: 10.1038/nrg3461 - DOI - PMC - PubMed
-
- Bulik-Sullivan B, Finucane HK, Anttila V, Gusev A, Day FR, Loh PR, et al. (2015) An atlas of genetic correlations across human diseases and traits. Nat Genet 47: 1236–1241. doi: 10.1038/ng.3406 - DOI - PMC - PubMed
-
- Day FR, Bulik-Sullivan B, Hinds DA, Finucane HK, Murabito JM, Tung JY, et al. (2015) Shared genetic aetiology of puberty timing between sexes and with health-related outcomes. Nat Commun 6: 8842 doi: 10.1038/ncomms9842 - DOI - PMC - PubMed
-
- Hagenaars SP, Harris SE, Davies G, Hill WD, Liewald DC, Ritchie SJ, et al. (2016) Shared genetic aetiology between cognitive functions and physical and mental health in UK Biobank (N = 112 151) and 24 GWAS consortia. Mol Psychiatry 21: 1624–1632. doi: 10.1038/mp.2015.225 - DOI - PMC - PubMed
Publication types
MeSH terms
Grants and funding
LinkOut - more resources
Full Text Sources
Other Literature Sources
Research Materials
