. 2018 Feb 24;19(2):640.
doi: 10.3390/ijms19020640.

Non-Native Conformational Isomers of the Catalytic Domain of PCSK9 Induce an Immune Response, Reduce Lipids and Increase LDL Receptor Levels

Affiliations

Non-Native Conformational Isomers of the Catalytic Domain of PCSK9 Induce an Immune Response, Reduce Lipids and Increase LDL Receptor Levels

Chuantao Jiang et al. Int J Mol Sci. .

Abstract

PCSK9 (Proprotein convertase subtilisin/kexin type 9) increases plasma cholesterol levels by promoting LDL receptor degradation. Current antibody inhibitors block the interaction between PCSK9 and LDL receptors, significantly decrease plasma cholesterol levels, and provide beneficial clinical outcomes. To reduce the action of PCSK9 in plasma, a novel strategy that will produce a panel of non-native, conformationally-altered isomers of PCSK9 (X-PCSK9) to develop active immunotherapy targeting of native PCSK9 and inhibiting/blocking the interaction of PCSK9 with LDL receptor, thus decreasing plasma cholesterol levels is proposed. The authors used the scrambled disulfide bond technique to generate conformationally-altered isomers of the catalytic domain of mouse PCSK9. The focus was on the immune response of four X-isomers and their effects on plasma cholesterol and triglyceride levels in both C57BL/6J and Apoe-/- mice. The authors showed that the four immunogens produced significant immunogenicity against native PCSK9 to day 120 after immunization of C57BL/6J and Apoe-/- mice. This resulted in significantly decreased plasma cholesterol levels in C57BL/6J mice, and to a lesser degree in Apoe-/- mice. The X-PCSK9-B1 treated mice had increased LDL receptor mRNA and protein levels at day 120 after treatment. Thus, this study provides a new, potentially promising approach that uses long-term immunotherapy for a treatment of hypercholesterolemia.

Keywords: LDL receptor; PCSK9; cholesterol; scrambled disulfide bonds; triglyceride.


Conflict of interest statement

The authors declare no conflict of interest.

Figures
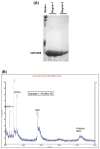
Figure 1
Figure 1
(A) Coomassie blue staining of the purified region-1 and region-2 of mPCSK9 proteins. Region-1 (residues 152–351) and region-2 (residues 249–452) of mouse catalytic domain were cloned and expressed by pET-3a plasmids. The proteins were reduced and purified by a reverse-phase high-performance liquid chromatography (HPLC) on an Agilent 1100 HPLC system. The purified proteins were analyzed by SDS/PAGE and stained with Coomassie blue. The positions of expressed proteins are shown; (B) MALDI mass spectrometry on Region-1. The molecular mass of purified PCSK9 region-1 in fully reduced form (PCSK9-1R). The molecular mass of PCSK9 region-1 as determined by MALDI was 21,201 Da; (C) MALDI mass spectrometry on Region-2. The molecular mass of purified PCSK9 region-2 in fully reduced form (PCSK9-2R). The molecular mass of PCSK9 region-2 as determined by MALDI was 21,355 Da.
Figure 1
Figure 1
(A) Coomassie blue staining of the purified region-1 and region-2 of mPCSK9 proteins. Region-1 (residues 152–351) and region-2 (residues 249–452) of mouse catalytic domain were cloned and expressed by pET-3a plasmids. The proteins were reduced and purified by a reverse-phase high-performance liquid chromatography (HPLC) on an Agilent 1100 HPLC system. The purified proteins were analyzed by SDS/PAGE and stained with Coomassie blue. The positions of expressed proteins are shown; (B) MALDI mass spectrometry on Region-1. The molecular mass of purified PCSK9 region-1 in fully reduced form (PCSK9-1R). The molecular mass of PCSK9 region-1 as determined by MALDI was 21,201 Da; (C) MALDI mass spectrometry on Region-2. The molecular mass of purified PCSK9 region-2 in fully reduced form (PCSK9-2R). The molecular mass of PCSK9 region-2 as determined by MALDI was 21,355 Da.
Figure 2
Figure 2
(A) Schematic diagram and amino acid sequences of mouse PCSK9. The full-length PCSK9 is shown (amino acids 1–692). The signal peptide (SP) is located at residues 1–30, the prodomain is at residues 31–151, the catalytic domain is at residues 152–452, and the Cys-His rich domain is at residues 453–692. The amino acid sequence of the catalytic domains is shown (aa 152–452); all Cysteines (C) are marked in red. (B) The amino acid sequence of region-1 of the mPCSK9 (aa 152–251) contains four Cysteines and should yield three different disulfide isomers as predicted. The theoretical molecular weight is 21,201.86 Da. All Cysteines (C) are marked in red. (C) The amino acid sequence of region-2 of the mPCSK9 (aa 249–452) contains six Cysteines and should yield fifteen different disulfide isomers as predicted. The theoretical molecular weight is 21,342.56 Da. All Cysteines (C) are marked in red.
Figure 2
Figure 2
(A) Schematic diagram and amino acid sequences of mouse PCSK9. The full-length PCSK9 is shown (amino acids 1–692). The signal peptide (SP) is located at residues 1–30, the prodomain is at residues 31–151, the catalytic domain is at residues 152–452, and the Cys-His rich domain is at residues 453–692. The amino acid sequence of the catalytic domains is shown (aa 152–452); all Cysteines (C) are marked in red. (B) The amino acid sequence of region-1 of the mPCSK9 (aa 152–251) contains four Cysteines and should yield three different disulfide isomers as predicted. The theoretical molecular weight is 21,201.86 Da. All Cysteines (C) are marked in red. (C) The amino acid sequence of region-2 of the mPCSK9 (aa 249–452) contains six Cysteines and should yield fifteen different disulfide isomers as predicted. The theoretical molecular weight is 21,342.56 Da. All Cysteines (C) are marked in red.
Figure 3
Figure 3
Refolding of Region-1 and Region-2 of PCSK9. Reduced Region-1 and -2 (1 mg/mL) proteins were incubated in 0.1 M Tris-HCl buffer (pH 8.4) containing hydroquinidine chloride (4 M) and β-mercaptoethanol (0.1 mM). The reaction was carried out at 23 °C for 24 h. Samples were analyzed and purified by HPLC using the conditions described in the Methods. The end products were shown to be comprised of two major isomers A1, A2 from Region-1 and B1, B2 from Region-2.
Figure 4
Figure 4
Immunization Strategy. Each mouse (n = 5/group) was injected subcutaneously with 100 μL of the immunogen (25 μg/mouse) or PBS in complete Freund’s adjuvant (CFA) as the first injection. Four weeks later, the authors did the first boosting in incomplete Freund’s adjuvant (IFA), followed by injection once a month with X-isomer in PBS for three months. One week after each boost injection, mouse blood was collected for analysis of antibody production titer and cholesterol and triglyceride levels. The authors sacrificed the animals and collected tissues for RNA and protein analyses at the end of the study (day-120).
Figure 5
Figure 5
Immunogenicity of X-PCSK9 isomers against native PCSK9 in C57BL/6J and Apoe−/− mice. C57BL/6J (n = 5/group) and Apoe−/− mice (n = 5/group) were immunized with designated X-PCSK9 immunogens A1, A2, and B1, B2 as described in Figure 4. Blood from the animals was collected as described at the indicated time points (black = day-0, red = day-28, pink = day-42, blue = day-56, green = day-90 and yellow = day-120). Plasma was used to determine the antibody titer against native PCSK9 by ELISA. The results are shown as antibody titer (OD450nm) as mean ±SEM. The p-value is listed in Table 1.
Figure 6
Figure 6
The hepatic mRNA levels of LDL receptor were significantly increased at day 120 after X-PCSK9-B1 treatment in both C57BL/6J and Apoe−/− mice. The authors extracted total RNA from mouse liver at day-120 after X-PCSK9 immunogen treatment. The authors used real-time RT-PCR to quantify the mRNA levels of LDL receptors (LDLR). The results are expressed as RQ (LDLR mRNA normalized with β-Actin; mean ± SEM, black = PBS; red = X-PCSK9-A1; pink = X-PCSK9-A2, blue = X-PCSK9-B1 and green = X-PCSK9-B2). Statistical analyses were performed using two-tailed unpaired t-test with Welch’s correction. The differences of X-PCSK9-B1 treated vs. PBS were significantly different in both C57BL/6J and Apoe−/− mice (p = 0.0363 and 0.0030, respectively). One-way ANOVA was also performed. The statistical analyses were performed using GraphPad Prism software (version 5). The p value < 0.05 is considered significant.
Figure 7
Figure 7
The levels of LDL receptor proteins were significantly increased after X-PCSK9-B1 treatment in both C57BL/6 and Apoe−/− mice and after X-PCSK9-A2 treatment in Apoe−/− mice. We immunized C57BL/6J (males; n = 5/group) and Apoe−/− (males; n = 5/group) with PBS, X-PCSK9-isomers (A1, A2, B1 and B2) as described in the Methods. At day-120 after treatment, mice were sacrificed, and liver tissues were collected. Liver homogenates (50 μg) were resolved by SDS/10% PAGE, followed by Western blot analysis to determine the levels of LDLR and Actin. The ratios of LDLR/β-Actin of each group are presented as mean ± SEM (black = PBS; red = X-PCSK9-A1; pink = X-PCSK9-A2, blue = X-PCSK9-B1 and green = X-PCSK9-B2). The authors used two-tailed unpaired t-test with Welch’s correction to analyze the difference between X-PCSK9 isomers vs. PBS-treated groups. The statistical analyses performed using GraphPad Prism software (version 5). The p value < 0.05 is considered significant. One-way ANOVA statistical analysis was also performed using the same software.
Figure 8
Figure 8
The levels of plasma PCSK9 proteins were significantly induced after immunogen treatment in both C57BL/6 and Apoe−/− knockout mice. Plasma of PBS and isomer treatment group (A1, A2, B1 and B2) at day-0 before treatment, day-30 and day-120 after treatment was subjected to resolve PCSK9 on SDS/10% PAGE, followed by Western blot analysis to determine the levels of PCSK9. The ratios of each treatment group/PBS are presented as mean ± SEM (black = PBS; red = X-PCSK9-A1; pink = X-PCSK9-A2, blue = X-PCSK9-B1 and green = X-PCSK9-B2). The authors used One-way ANOVA statistical analysis with Dunnett’s multiple comparison test to analyze the difference between X-PCSK9 isomers vs. PBS-treated groups. The statistical analyses were performed using GraphPad Prism software (version 5). The p value < 0.05 (**, ***) is considered significant.
Figure 9
Figure 9
The amino acids sequences of mouse PCSK9 catalytic domain (residues 152-452). All Cysteins (C) are marked in red.

Similar articles

Cited by

References

    1. Horton J.D., Cohen J.C., Hobbs H.H. Molecular biology of PCSK9: Its role in LDL metabolism. Trends Biochem. Sci. 2007;32:71–77. doi: 10.1016/j.tibs.2006.12.008. - DOI - PMC - PubMed
    1. Horton J.D., Cohen J.C., Hobbs H.H. PCSK9: A convertase that coordinates LDL catabolism. J. Lipid Res. 2009;50:S172–S177. doi: 10.1194/jlr.R800091-JLR200. - DOI - PMC - PubMed
    1. Abifadel M., Rabes J.P., Devillers M., Munnich A., Erlich D., Junien C., Varret M., Boileau C. Mutations and polymorphisms in the proprotein convertase subtilisin kexin 9 (PCSK9) gene in cholesterol metabolism and disease. Hum. Mutat. 2009;30:520–529. doi: 10.1002/humu.20882. - DOI - PubMed
    1. Abifadel M., Varret M., Rabes J.P., Allard D., Ouguerram K., Devillers M., Cruaud C., Benjannet S., Wickham L., Erlich D., et al. Mutations in PCSK9 cause autosomal dominant hypercholesterolemia. Nat. Genet. 2003;34:154–156. doi: 10.1038/ng1161. - DOI - PubMed
    1. Benn M., Nordestgaard B.G., Grande P., Schnohr P., Tybjaerg-Hansen A. PCSK9 R46L, low-density lipoprotein cholesterol levels, and risk of ischemic heart disease: 3 independent studies and meta-analyses. J. Am. Coll. Cardiol. 2010;55:2833–2842. doi: 10.1016/j.jacc.2010.02.044. - DOI - PubMed

MeSH terms

LinkOut - more resources