

Talker identification: Effects of masking, hearing loss, and age
- PMID: 29495693
- PMCID: PMC5820061
- DOI: 10.1121/1.5024333
Talker identification: Effects of masking, hearing loss, and age
Abstract
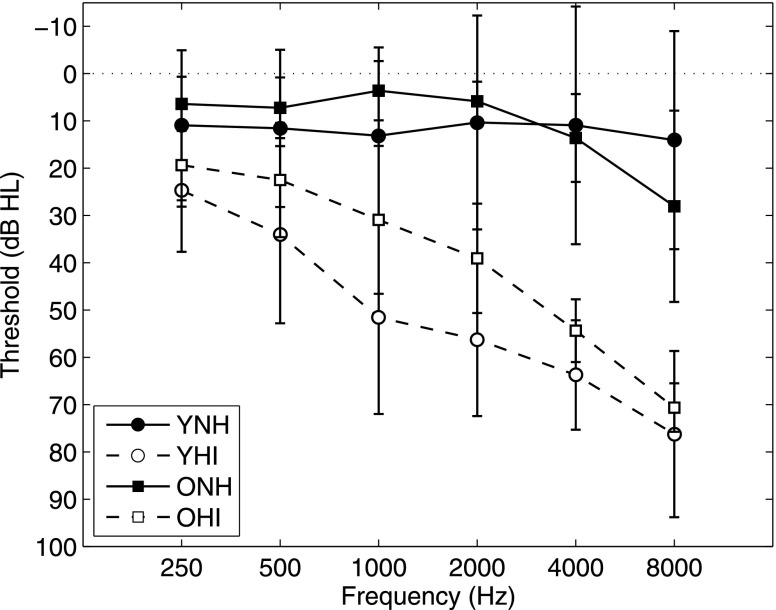
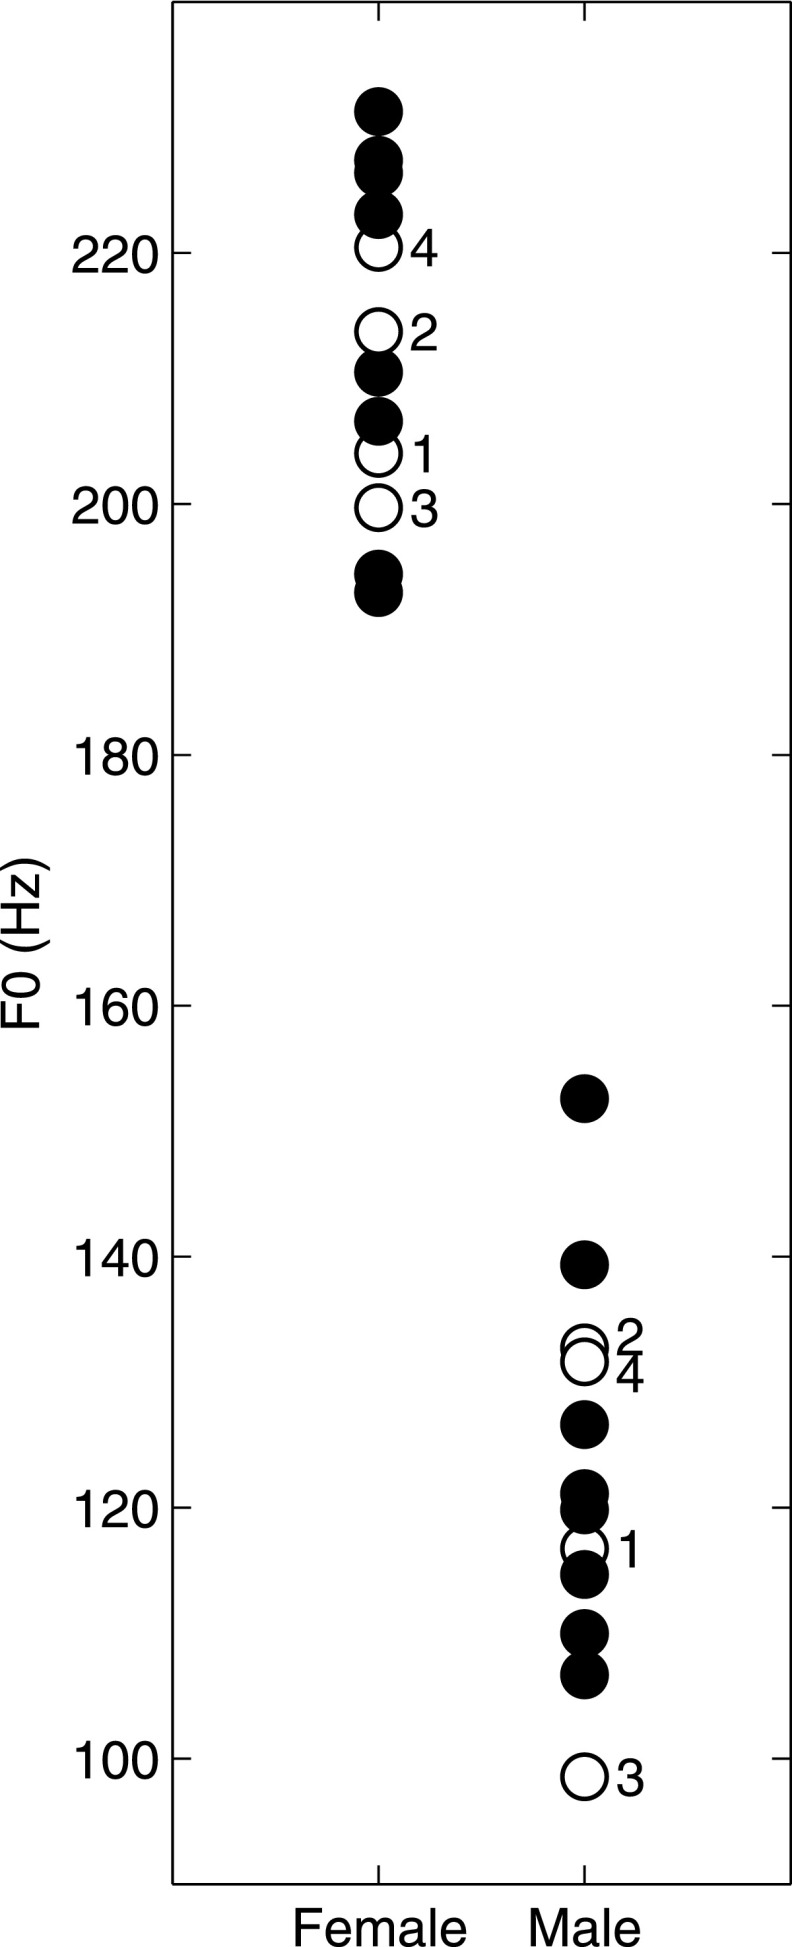
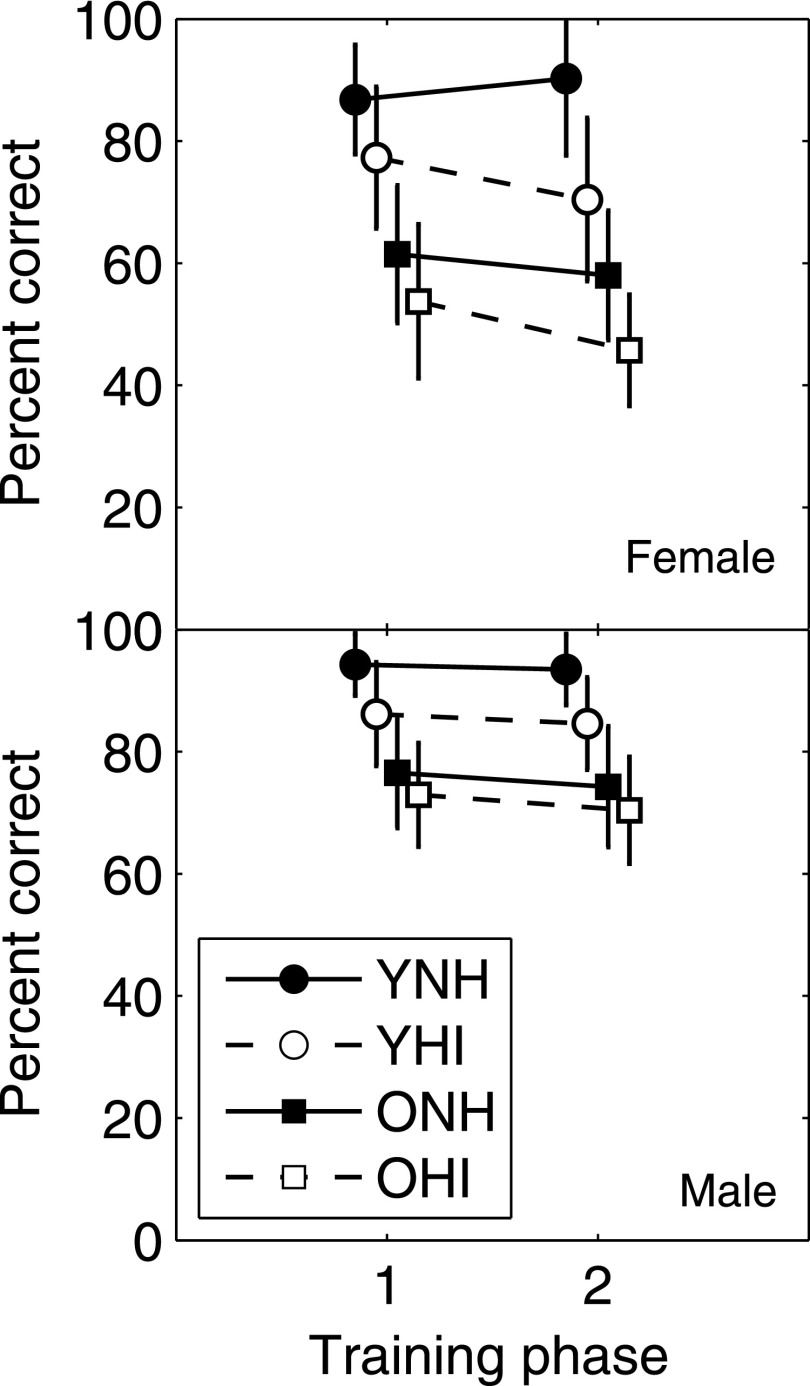
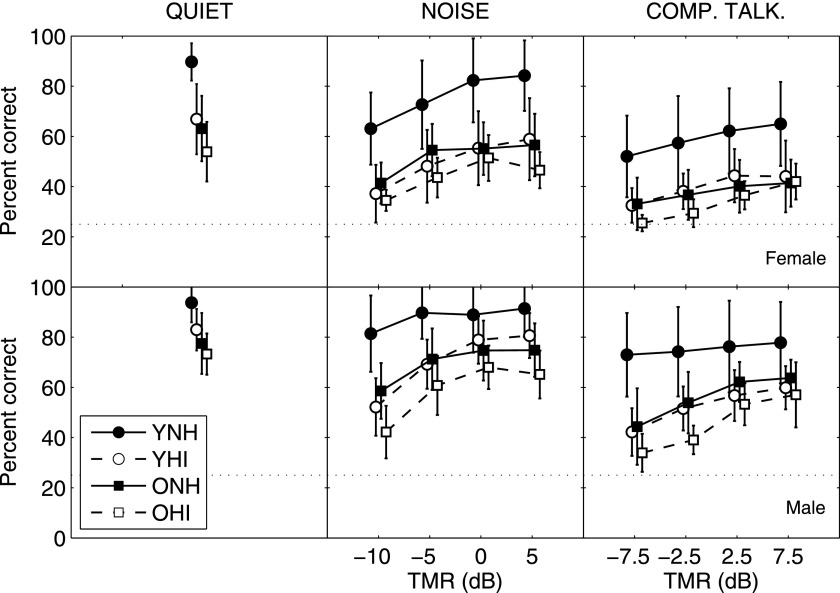
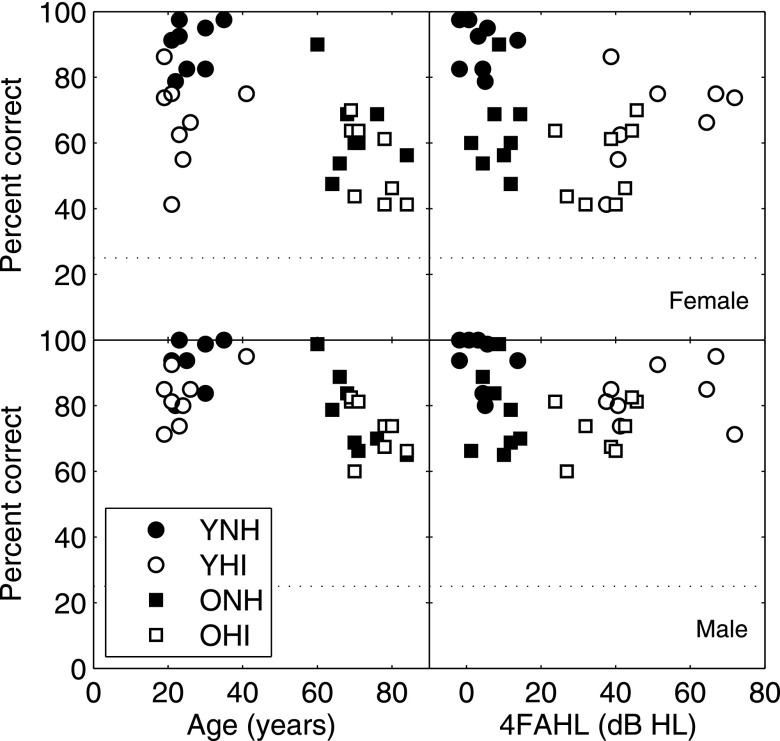
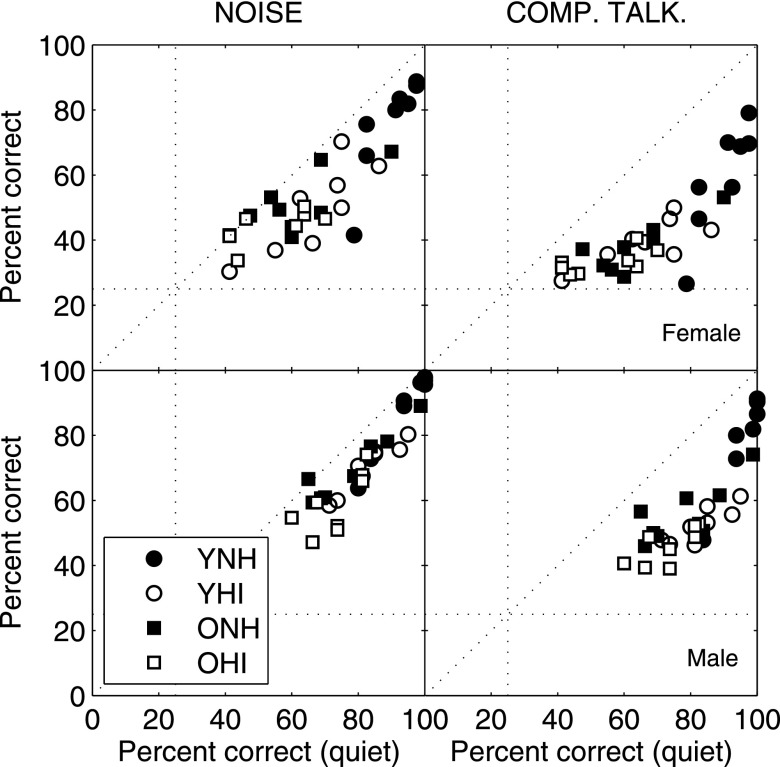
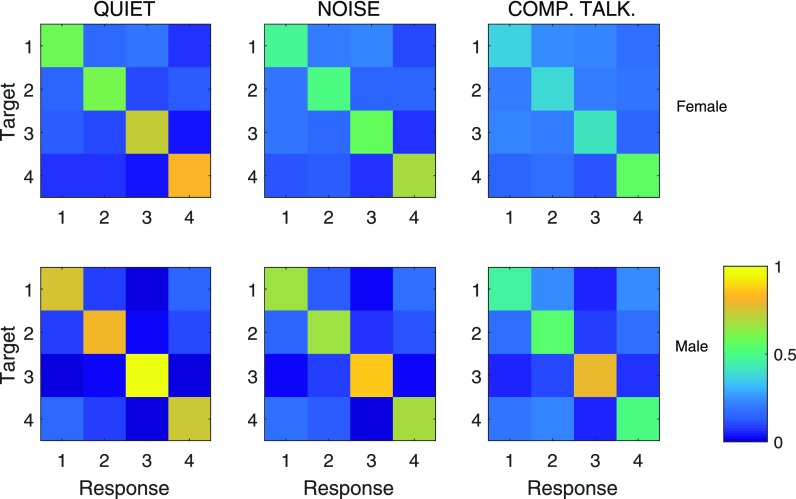
The ability to identify who is talking is an important aspect of communication in social situations and, while empirical data are limited, it is possible that a disruption to this ability contributes to the difficulties experienced by listeners with hearing loss. In this study, talker identification was examined under both quiet and masked conditions. Subjects were grouped by hearing status (normal hearing/sensorineural hearing loss) and age (younger/older adults). Listeners first learned to identify the voices of four same-sex talkers in quiet, and then talker identification was assessed (1) in quiet, (2) in speech-shaped, steady-state noise, and (3) in the presence of a single, unfamiliar same-sex talker. Both younger and older adults with hearing loss, as well as older adults with normal hearing, generally performed more poorly than younger adults with normal hearing, although large individual differences were observed in all conditions. Regression analyses indicated that both age and hearing loss were predictors of performance in quiet, and there was some evidence for an additional contribution of hearing loss in the presence of masking. These findings suggest that both hearing loss and age may affect the ability to identify talkers in "cocktail party" situations.
Figures
References
-
- Arehart, K. H. , Rossi-Katz, J. , and Swensson-Prutsman, J. (2005). “ Double-vowel perception in listeners with cochlear hearing loss: Differences in fundamental frequency, ear of presentation, and relative amplitude,” J. Speech Lang. Hear. Res. 48, 236–252.10.1044/1092-4388(2005/017) - DOI - PubMed
-
- Boersma, P. , and Weenink, D. (2009). “ Praat: Doing phonetics by computer (version 6.0.20) [computer program],” http://www.praat.org (Last viewed September 4, 2016).
-
- Byrne, D. J. , Parkinson, A. , and Newall, P. (1991). “ Modified hearing aid selection procedures for severe-profound hearing losses,” in The Vanderbilt Hearing Aid Report II, edited by Studebaker G. A., Bess F. H., and Beck L. B. ( York, Parkton, MD: ), pp. 295–300.
Publication types
MeSH terms
Grants and funding
LinkOut - more resources
Full Text Sources
Other Literature Sources
Medical