Molecular Genetic Analysis Subdivided by Adversity Exposure Suggests Etiologic Heterogeneity in Major Depression
- PMID: 29495898
- PMCID: PMC5988935
- DOI: 10.1176/appi.ajp.2017.17060621
Molecular Genetic Analysis Subdivided by Adversity Exposure Suggests Etiologic Heterogeneity in Major Depression
Abstract
Objective: The extent to which major depression is the outcome of a single biological mechanism or represents a final common pathway of multiple disease processes remains uncertain. Genetic approaches can potentially identify etiologic heterogeneity in major depression by classifying patients on the basis of their experience of major adverse events.
Method: Data are from the China, Oxford, and VCU Experimental Research on Genetic Epidemiology (CONVERGE) project, a study of Han Chinese women with recurrent major depression aimed at identifying genetic risk factors for major depression in a rigorously ascertained cohort carefully assessed for key environmental risk factors (N=9,599). To detect etiologic heterogeneity, genome-wide association studies, heritability analyses, and gene-by-environment interaction analyses were performed.
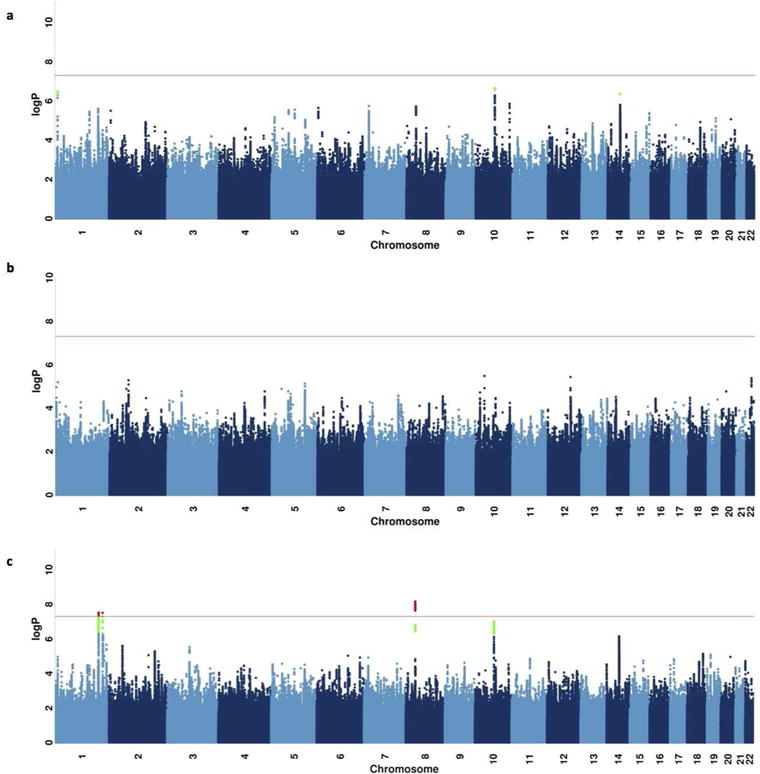
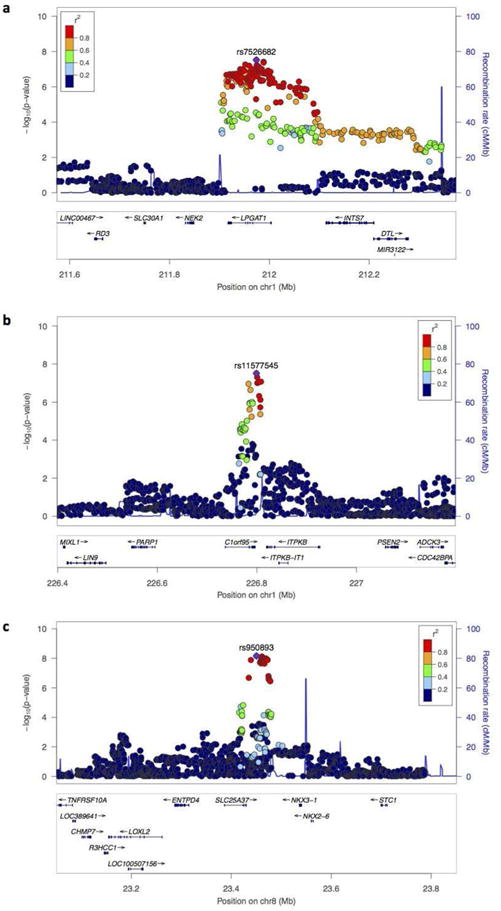
Results: Genome-wide association studies stratified by exposure to adversity revealed three novel loci associated with major depression only in study participants with no history of adversity. Significant gene-by-environment interactions were seen between adversity and genotype at all three loci, and 13.2% of major depression liability can be attributed to genome-wide interaction with adversity exposure. The genetic risk in major depression for participants who reported major adverse life events (27%) was partially shared with that in participants who did not (73%; genetic correlation=+0.64). Together with results from simulation studies, these findings suggest etiologic heterogeneity within major depression as a function of environmental exposures.
Conclusions: The genetic contributions to major depression may differ between women with and those without major adverse life events. These results have implications for the molecular dissection of major depression and other complex psychiatric and biomedical diseases.
Keywords: Diagnosis and Classification; Genetics; Mood Disorders-Unipolar.
Conflict of interest statement
Figures
Comment in
-
Considering the Genetic and Epigenetic Signature of Early Adversity Within a Biopsychosocial Framework.Am J Psychiatry. 2018 Jun 1;175(6):491-492. doi: 10.1176/appi.ajp.2018.18020156. Am J Psychiatry. 2018. PMID: 29869554 No abstract available.
References
-
- Mendels J, Cochrane C. The nosology of depression: the endogenous-reactive concept. Am J Psychiatry. 1968 May;124(11):11. - PubMed
Publication types
MeSH terms
Grants and funding
LinkOut - more resources
Full Text Sources
Other Literature Sources