. 2018 Mar 1;16(1):32.
doi: 10.1186/s12916-018-1024-8.

Hospital Mortality - a neglected but rich source of information supporting the transition to higher quality health systems in low and middle income countries

Affiliations

Hospital Mortality - a neglected but rich source of information supporting the transition to higher quality health systems in low and middle income countries

Mike English et al. BMC Med. .

Abstract

Background: There is increasing focus on the strength of primary health care systems in low and middle-income countries (LMIC). There are important roles for higher quality district hospital care within these systems. These hospitals are also sources of information of considerable importance to health systems, but this role, as with the wider roles of district hospitals, has been neglected.

Key messages: As we make efforts to develop higher quality health systems in LMIC we highlight the critical importance of district hospitals focusing here on how data on hospital mortality offers value: i) in understanding disease burden; ii) as part of surveillance and impact monitoring; iii) as an entry point to exploring system failures; and iv) as a lens to examine variability in health system performance and possibly as a measure of health system quality in its own right. However, attention needs paying to improving data quality by addressing reporting gaps and cause of death reporting. Ideally enabling the collection of basic, standardised patient level data might support at least simple case-mix and case-severity adjustment helping us understand variation. Better mortality data could support impact evaluation, benchmarking, exploration of links between health system inputs and outcomes and critical scrutiny of geographic variation in quality and outcomes of care. Improved hospital information is a neglected but broadly valuable public good.

Conclusion: Accurate, complete and timely hospital mortality reporting is a key attribute of a functioning health system. It can support countries' efforts to transition to higher quality health systems in LMIC enabling national and local advocacy, accountability and action.


Conflict of interest statement

Ethics approval and consent to participate

Not appropriate for this debate manuscript.

Consent for publication

Not appropriate for this debate manuscript.

Competing interests

KEMRI-Wellcome Trust Research Programme team members receive research funding for work on improvement of health services.

Publisher’s Note

Springer Nature remains neutral with regard to jurisdictional claims in published maps and institutional affiliations.

Figures
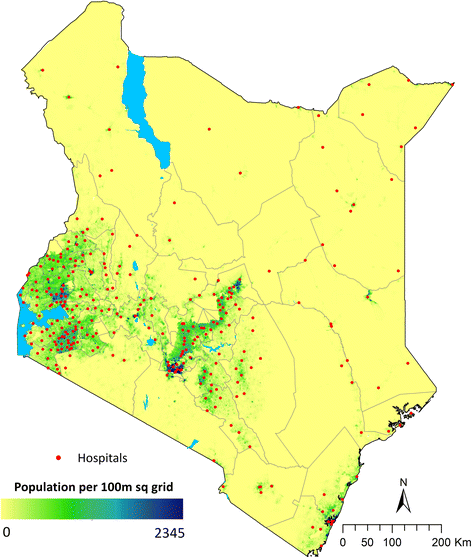
Fig. 1
Fig. 1
Distribution of hospitals and population density in Kenya. This figure shows the distribution of hospitals in Kenya in relation to population density suggesting they could offer insights on cause of death in diverse geographic settings spanning high and very low density populations in Kenya. Of note Kenya has demographic surveillance sites conducting verbal autopsy in 5 locations none of which are in areas of low population density
Fig. 2
Fig. 2
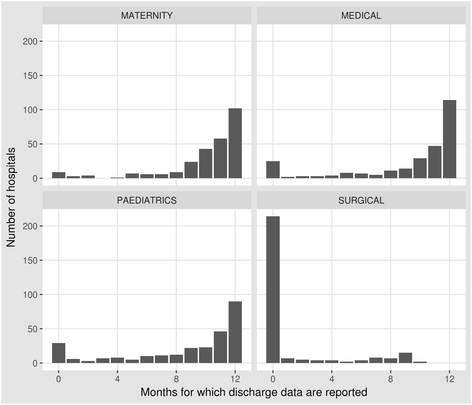
Reporting rates from 272 hospitals for discharges from major service units in Kenya. This bar chart demonstrates the distribution of the number of months for which there are discharge data from four major inpatient service units (maternity, paediatric wards, medical wards and surgical wards) in 272 Kenyan hospitals for the year December 2015 to November 2016
Fig. 3
Fig. 3
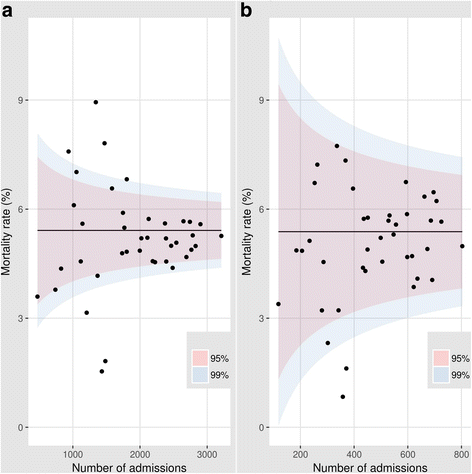
Using funnel plots to explore variability in hospital outcomes. Mortality rates (Y axis) are plotted against the annual number of eligible cases (X axis) for 40 hospitals with a horizontal line indicating the sample mean derived from the 40 observations and the inner and outer shaded areas indicating the 95% and 99% ranges respectively. In panel a (left) we vary the number of eligible cases from 0 to 4000 representing the range seen in our empirical data. In panel b (right) we randomly eliminate cases to reduce the sample size by 75% in each hospital to illustrate the effect on the 95% and 99% ranges. The reduction in case numbers available, as seen in the right panel, illustrates its effect on the potential for identification of outlying values and indicates that such analyses are likely to be most suitable for exploring variation across larger facilities or at sub-national regional levels
Fig. 4
Fig. 4
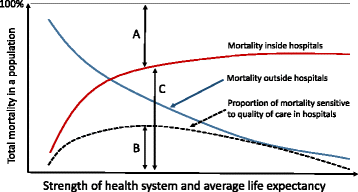
The sensitivity of outcomes of LMIC hospital care to improved quality. This figure seeks to represent hypothetical relationships between the proportion of all mortality (Y Axis) that occurs outside and inside hospitals (blue and red lines respectively) as the strength of a health system and life expectancy increase (X axis). Here we assume that a proportion of all mortality is sensitive to quality of hospital care (dashed line) that first increases as access improves and then decreases as quality improves in parallel with an increase in the strength of a health system. In this simplified model the relationship between the distances represented by A and C is a measure of access that may be particularly important for conditions for which hospital based care might improve outcomes (eg. trauma; acute myocardial infarction; complications of childbirth; preterm birth). If the distance B represents the proportion of mortality that may be averted by better access to higher quality hospital care then in LMIC it is possible that the ratio of B:C (avoidable mortality) is considerably higher than in high income countries (located at the right extreme of the Y axis). With appropriate case-mix and case-severity adjustment mortality may therefore, be a better global metric of quality in LMIC hospitals than it is in high income countries

References

    1. The SustaInable Development Goals [http://www.un.org/sustainabledevelopment/sustainable-development-goals/]. Accessed 31 Oct 2017.
    1. AbouZahr C, Boerma T. Health information systems: the foundations of public health. Bull World Health Organ. 2005;83(8):578–583. - PMC - PubMed
    1. English M, Lanata C, Ngugi I, Smith PC. The District Hospital. In: Jamison D, Alleyne G, Breman J, Claeson M, Evans D, Jha P, Mills A, Measham A, editors. Disease Control Priorities in Developing Countries - 2nd Edition. Washington DC: World Bank; 2006. pp. 1211–1228.
    1. World Health Organisation. Declaration of Alma-Ata, International Conference on Primary Health Care. Geneva: World Health Organisation; 1978.
    1. Setel PW, Macfarlane SB, Szreter S, Mikkelsen L, Jha P, Stout S, AbouZahr C, group MoVEw A scandal of invisibility: making everyone count by counting everyone. Lancet. 2007;370(9598):1569–1577. doi: 10.1016/S0140-6736(07)61307-5. - DOI - PubMed

Publication types

LinkOut - more resources