. 2018 Jun:173:370-383.
doi: 10.1016/j.neuroimage.2018.02.047. Epub 2018 Feb 27.

Optogenetic fMRI and electrophysiological identification of region-specific connectivity between the cerebellar cortex and forebrain

Affiliations

Optogenetic fMRI and electrophysiological identification of region-specific connectivity between the cerebellar cortex and forebrain

Katrina Y Choe et al. Neuroimage. 2018 Jun.

Abstract

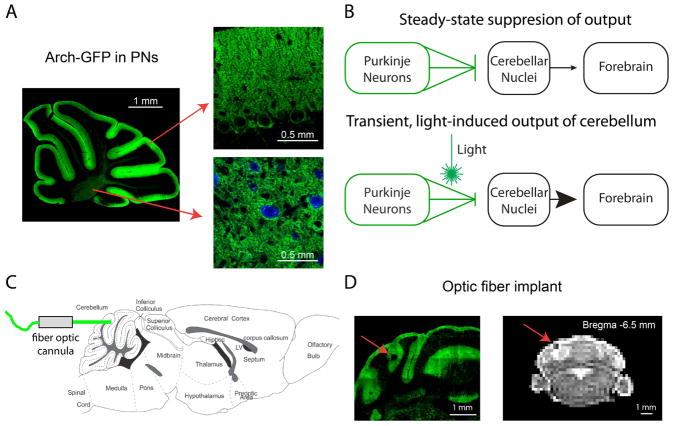
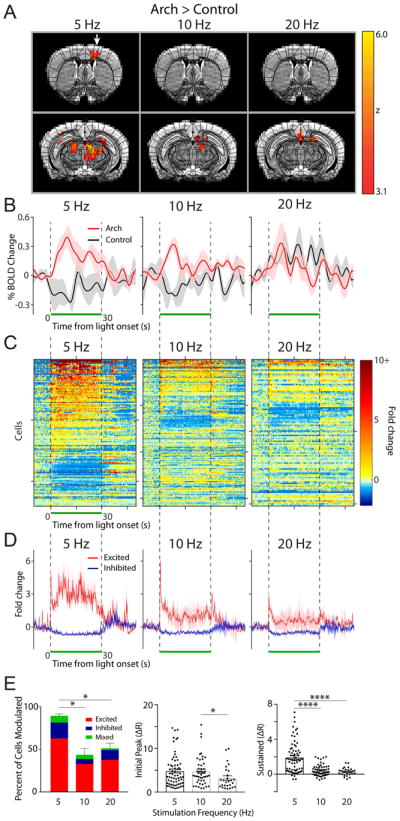
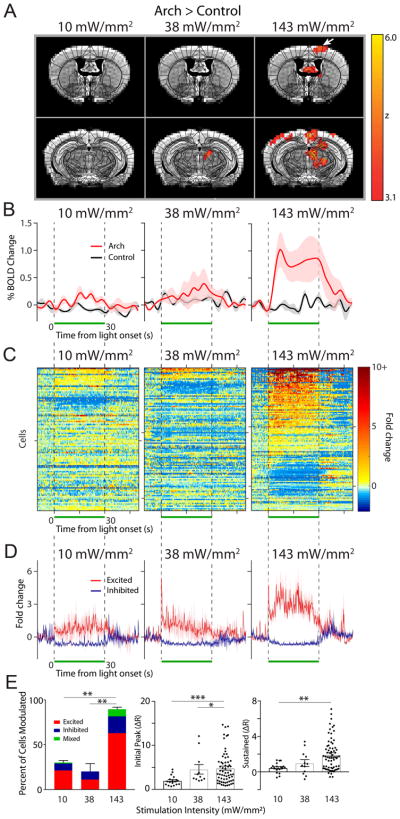
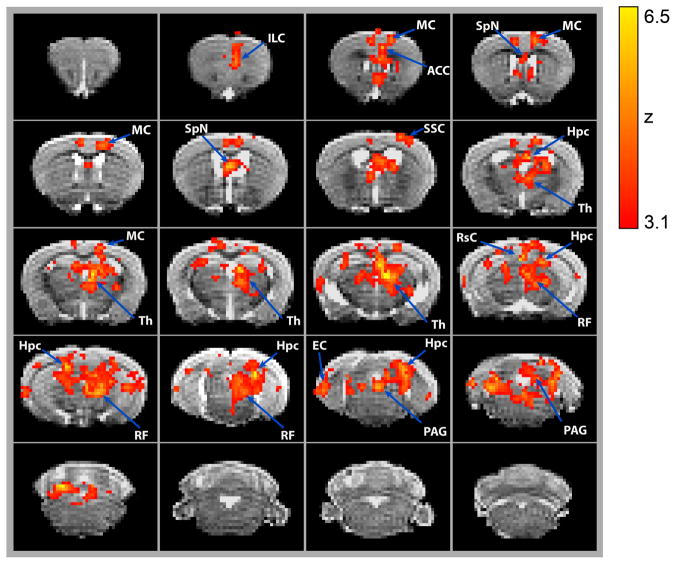
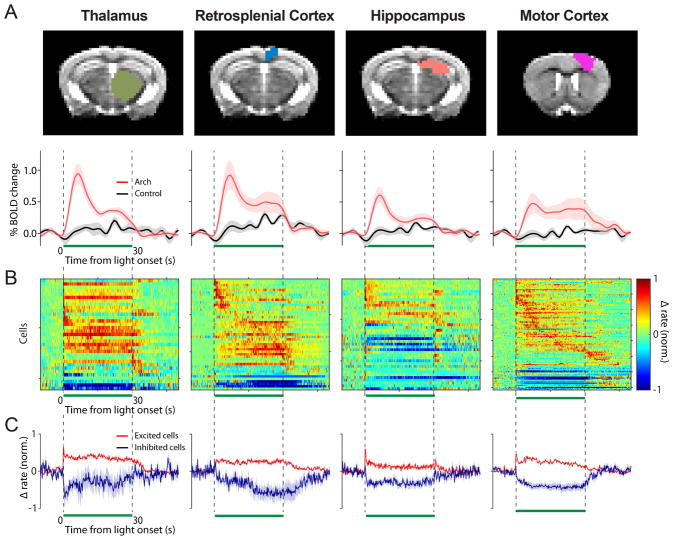
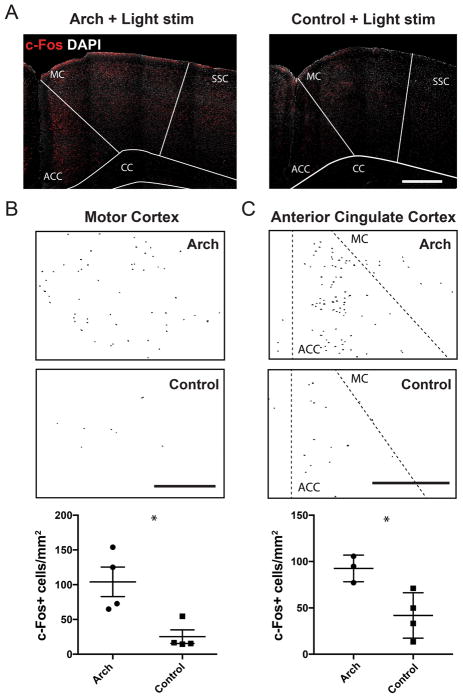
Complex animal behavior is produced by dynamic interactions between discrete regions of the brain. As such, defining functional connections between brain regions is critical in gaining a full understanding of how the brain generates behavior. Evidence suggests that discrete regions of the cerebellar cortex functionally project to the forebrain, mediating long-range communication potentially important in motor and non-motor behaviors. However, the connectivity map remains largely incomplete owing to the challenge of driving both reliable and selective output from the cerebellar cortex, as well as the need for methods to detect region specific activation across the entire forebrain. Here we utilize a paired optogenetic and fMRI (ofMRI) approach to elucidate the downstream forebrain regions modulated by activating a region of the cerebellum that induces stereotypical, ipsilateral forelimb movements. We demonstrate with ofMRI, that activating this forelimb motor region of the cerebellar cortex results in functional activation of a variety of forebrain and midbrain areas of the brain, including the hippocampus and primary motor, retrosplenial and anterior cingulate cortices. We further validate these findings using optogenetic stimulation paired with multi-electrode array recordings and post-hoc staining for molecular markers of activated neurons (i.e. c-Fos). Together, these findings demonstrate that a single discrete region of the cerebellar cortex is capable of influencing motor output and the activity of a number of downstream forebrain as well as midbrain regions thought to be involved in different aspects of behavior.

Keywords: Cerebellum; Hippocampus; Motor cortex; Prefrontal cortex; Thalamus; ofMRI.


Figures

Figure 1
Figure 1. Light activation of Arch in Purkinje neurons drives cerebellar output during fMRI scans
(A) Parasagittal cerebellar brain slice from an L7-Cre;RCL-Arch-GFP mouse showing selective Purkinje neuron expression of the Arch-GFP transgene (green). Arch-GFP expression is apparent in the membranes of Purkinje neuron soma and dendritic trees (right, top) as well as its axons (right, bottom) projecting to cerebellar nuclear neurons (blue, CamKIIa) (B) A schematic describing the use of inhibitory optogenetics to generate cerebellar output to the forebrain. At steady-state Arch expressing Purkinje neurons (green) tonically inhibit cerebellar nuclear neurons (black), thereby limiting cerebellar output to downstream sites like the forebrain. Synchronous pauses in discrete populations of Purkinje neurons during light activation of Arch disinhibits the cerebellar nucleus, thus driving cerebellar output. (C) Fiber optic cannulas were stereotaxically placed in the forelimb region of the cerebellar cortex at a 0° angle (horizontal) through a craniotomy in the caudal part of the occipital bone. (D) The implantation site is apparent in both exemplar histological section (left) and MRI structural scan (right) containing the cerebellum. The location of the implanted optic fiber (see red arrows) is visible as a dark area juxtaposed to the vermis near the medial simplex.
Figure 2
Figure 2. Lower frequency light pulses effectively drive neural activity in the motor cortex
(A) OfMRI BOLD signals (Arch>control) were imaged during 10 × 30 s long epochs of 5, 10, and 20 Hz light stimulation (50% duty cycle, 143 mW/mm2 intensity) interleaved with 10 × 30 s long rest periods (no light pulse). An atlas of subdivided brain structures (black lines) is overlaid on top of the BOLD signal (yellow-red) and representative structural images (grayscale) at 2 different slice planes (Y: 0.26 and −2.7 from Bregma). White arrow points to motor cortex activation in the 5 Hz stimulation condition. (B) Time course of average percent change in BOLD activation for Arch (red, n=4–5 mice) and control (black, n=3 mice) animals stimulated at 5, 10, and 20 Hz, calculated in a subregion of the contralateral motor cortex containing significantly activated voxels in the 5 Hz Arch group (A, left). The light was pulsed during the time window indicated by the green bar. Shaded areas indicate s.e.m. (C) The fold change in baseline subtracted firing rate ((R-R0)/R0) is shown for all recorded motor cortical neurons during the 5 (n=107), 10 (n=159), and 20 (n=114) Hz stimulation period (green bar; n=3 animals). Responses are thresholded to 10× the fold rate change to improve visualization of neural activity. Starting from the top, every 50th cell is marked by a tick along the y-axis (i.e. y-axis=50 cells/tick). 200 ms/bin (D) The average neural response across cells that were significantly excited (red) and inhibited (purple) is plotted for each frequency. (E) Left, summary graph of the percent of cells modulated and the modulation type for each frequency of stimulation (one-way ANOVA with post-hoc Tukey’s test *p<0.05). The average magnitude of the initial peak (0–4 ms, middle) and sustained increase (averaged between 10–20 ms, right) for all excited cells is plotted for each frequency (Kruskal-Wallis with post-hoc Dunn’s test *p<0.05, ****p<0.0001).
Figure 3
Figure 3. Effects of light intensity on the modulation of neural activity in the motor cortex
(A) OfMRI BOLD signals (Arch>control) generated by 3 different light intensities applied at 5 Hz. As in Fig. 2, an atlas of subdivided brain structures (black lines) is overlaid on top of the BOLD signal (yellow-red) and representative structural images (grayscale) at 2 different slice planes (Y: −0.22 and −2.7 mm from Bregma). (B) Time course of average percent change in BOLD activation (red) and control (black) at each indicated intensity (n=4 mice/group), calculated in a subregion of the contralateral motor cortex containing significantly activated voxels in the 143 mW/mm2 Arch group (A, left). The light was pulsed at 5 Hz during the time window indicated by the green bar. Shaded areas indicate s.e.m. (C) The fold change in baseline subtracted firing rate ((R-R0)/R0) is shown for all recorded cells during the, 10 (n=97), 38 (n=109), 143 (n=107) mW/mm2 stimulation period (green bar; n=3 animals). Responses are thresholded to 10× the fold rate change to improve visualization of neural activity. Starting from the top, every 50th cell is marked by a tick along the y-axis (i.e. y-axis=50 cells/tick). 200 ms/bin (D) The average neural response across cells that were significantly excited (red) and inhibited (purple) is plotted for each frequency. (E) Left, summary graph of the percent of cells modulated and the modulation type for each frequency of stimulation (one-way ANOVA with post-hoc Tukey’s test **p<0.01 The average magnitude of the initial peak (0–4 ms, middle) and sustained increase (averaged between 10–20 ms, right) for all excited cells is plotted for each frequency (Kruskal-Wallis with post-hoc Dunn’s test *p<0.05, **p<0.01, ***p<0.001)
Figure 4
Figure 4. Cerebellar stimulation drives changes in BOLD signal in various forebrain and midbrain regions
(A) Changes in BOLD signal are overlaid onto MRI images taken at 0.5 mm intervals. Changes in BOLD signal were induced by a 5 Hz, 100 ms long light train delivered to the cerebellar forelimb region. Significant changes in signal are averaged across the 10 alternating on and off cycles over a 10-minute period. Z-scores were calculated for statistically significant changes in BOLD signal in Arch (n=9) vs control (n=7) animals (p<0.001). Brain regions are labelled according to 3-D mouse brain atlas (Fig. S9). Images are organized from rostral to caudal. Infralimbic Cortex (ILC), Motor Cortex (MC), Anterior Cingulate Cortex (ACC), Septal Nuclei (SpN), Somatosensory Cortex (SSC), Hippocampus (Hpc), Thalamus (Th), Retrosplenial Cortex (RsC), Reticular Formation (RF), Entorhinal Cortex (EC), Periaqueductal Gray (PAG).
Figure 5
Figure 5. The cerebellar forelimb region can modulate activity of putative cells in the dorsal thalamus, retrosplenial cortex, dorsal hippocampus, and motor cortex
(A) Top, anatomical masks overlaid on an example coronal structural for the indicated brain region. Bottom, the average BOLD time course is plotted for the entire thalamus, retrosplenial cortex, hippocampus, and motor cortex (red: Arch, n=9; black: control, n=7). A 5 Hz, 143 mW/mm2 stimulus was applied during the 30 s pulse indicated by the green bar. (B) To visualize and compare the temporal dynamics of the spiking response between activated brain regions, the change in firing rate from baseline is normalized to the max rate, unlike Figs. 2,3C. Only the cells found to be modulated in the four regions are displayed (dorsal thalamus n=36 modulated/69 total, retrosplenial cortex n=53/70, dorsal hippocampus n=41/59, and motor cortex n=107/120), y-axis = 15 cells/tick. (C) The average change in firing rate from baseline normalized to peak firing rate is displayed for the excited (red) and inhibited (purple) cells.
Figure 6
Figure 6. Light stimulation increases the number c-Fos+ cells in the motor and anterior cingulate cortices
(A) Confocal micrographs of c-Fos (red) and DAPI (grey) immunostained coronal brain sections from an Arch-expressing (left) and control (right) mouse. Light stimulation parameters at the forelimb region of the cerebellar cortex was identical to that of ofMRI scans (5 Hz, 143 mW/mm2, 30 s alternating on and off for 10 minutes). A higher number of c-Fos+ cells are visible in the motor cortex (MC) and anterior cingulate cortex (ACC) of Arch mice compared to control. Thresholded c-Fos+ cells in the MC (B) and ACC (C) of Arch (top) and L7-cre control (middle) mice, detected by particle analysis. Scatter plots at the bottom represent normalized c-Fos+ cell count in each region of Arch and control mice (ACC located between dashed lines in C). Lines represent average ±SEM. * denotes p<0.05. SSC, somatosensory cortex; CC, corpus callosum. All scale bars represent 500 μm.

Similar articles

Cited by

References

    1. Adamaszek M, D’Agata F, Ferrucci R, Habas C, Keulen S, Kirkby KC, Leggio M, Marien P, Molinari M, Moulton E, Orsi L, Van Overwalle F, Papadelis C, Priori A, Sacchetti B, Schutter DJ, Styliadis C, Verhoeven J. Consensus Paper: Cerebellum and Emotion. Cerebellum. 2017;16:552–576. http://doi.org/10.1007/s12311-016-0815-8. - DOI - PubMed
    1. Adamczak JM, Farr TD, Seehafer JU, Kalthoff D, Hoehn M. High field BOLD response to forepaw stimulation in the mouse. Neuroimage. 2010;51:704–712. http://doi.org/10.1016/j.neuroimage.2010.02.083. - DOI - PubMed
    1. Akkal D, Dum RP, Strick PL. Supplementary motor area and presupplementary motor area: targets of basal ganglia and cerebellar output. J Neurosci. 2007;27:10659–10673. http://doi.org/10.1523/jneurosci.3134-07.2007. - DOI - PMC - PubMed
    1. Allen GI, Tsukahara N. Cerebrocerebellar communication systems. Physiol Rev. 1974;54:957–1006. - PubMed
    1. Amianto F, D’Agata F, Lavagnino L, Caroppo P, Abbate-Daga G, Righi D, Scarone S, Bergui M, Mortara P, Fassino S. Intrinsic Connectivity Networks Within Cerebellum and Beyond in Eating Disorders. The Cerebellum. 2013;12:623–631. http://doi.org/10.1007/s12311-013-0471-1. - DOI - PubMed

Publication types

MeSH terms