Review
. 2018 Nov 15:182:219-231.
doi: 10.1016/j.neuroimage.2018.01.036. Epub 2018 Feb 26.

Microstructural parcellation of the human brain

Affiliations
Review

Microstructural parcellation of the human brain

Bruce Fischl et al. Neuroimage. .

Abstract

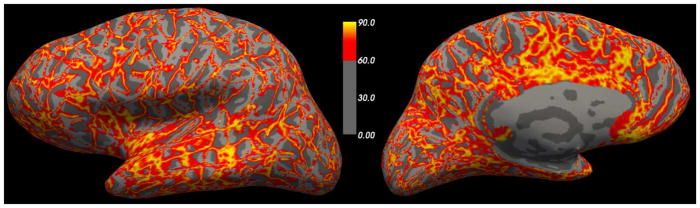
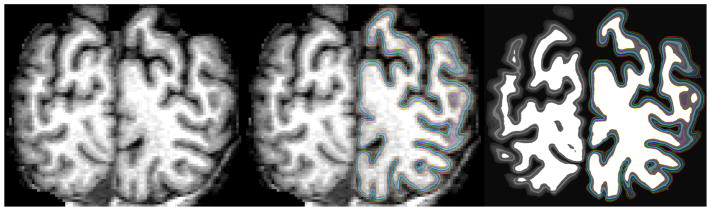
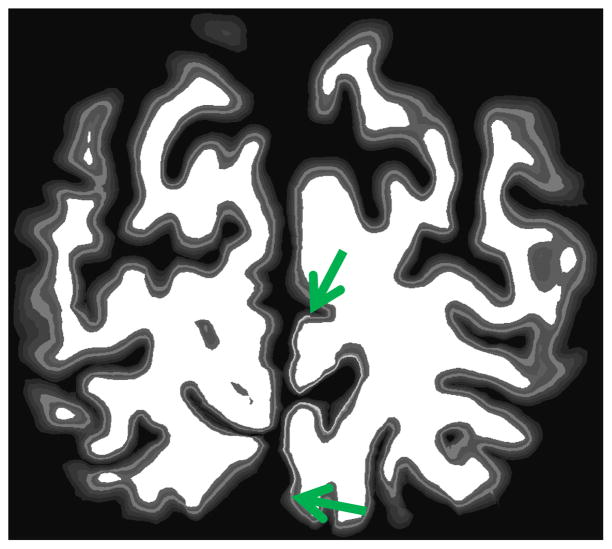
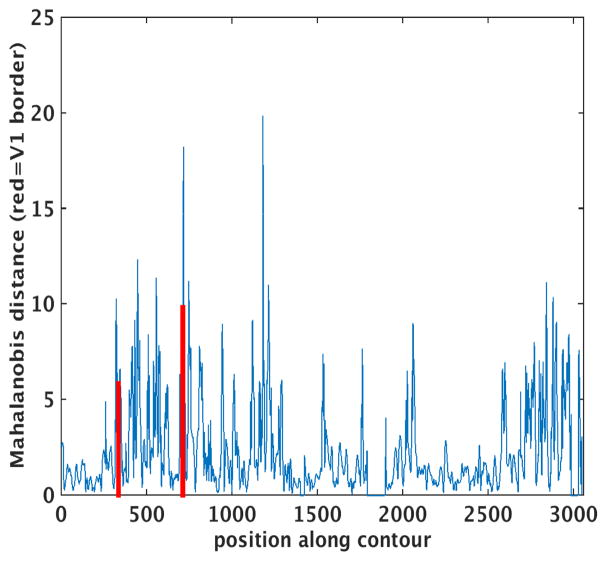
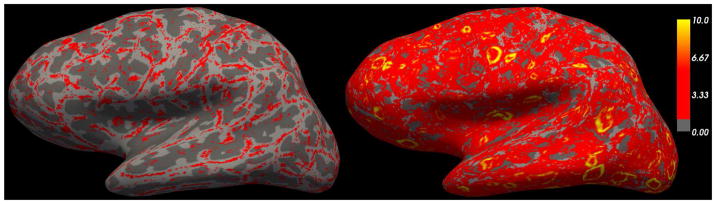
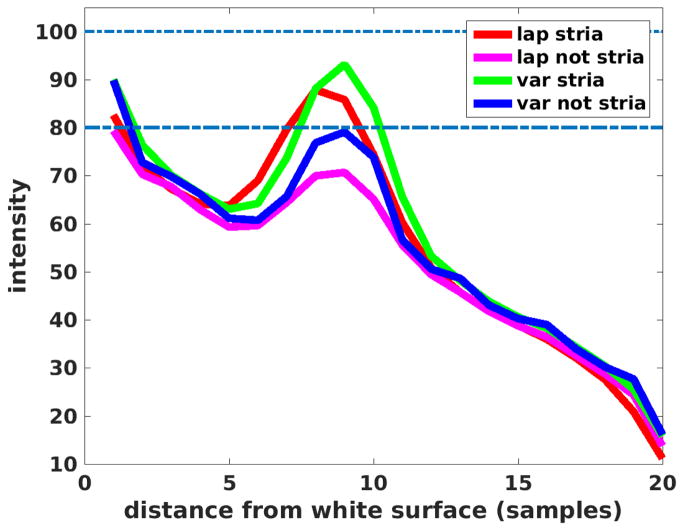
The human cerebral cortex is composed of a mosaic of areas thought to subserve different functions. The parcellation of the cortex into areas has a long history and has been carried out using different combinations of structural, connectional, receptotopic, and functional properties. Here we give a brief overview of the history of cortical parcellation, and explore different microstructural properties and analysis techniques that can be used to define the borders between different regions. We show that accounting for the 3D geometry of the highly folded human cortex is especially critical for accurate parcellation. We close with some thoughts on future directions and best practices for combining modalities.


Figures

Figure 1
Figure 1
Angle (in degrees) of dot product of coronal plane with pial surface normal (light/gray dark gray curvature maps shown for all regions < 60°).
Figure 2
Figure 2
Example of synthesis procedure. Top, from left-to-right: original MRI, 6 equidistant compartments created between the white and pial surfaces, and rightmost, an image synthesized to have uniform intensity within each compartment or “layer”. Bottom: zoom to show individual surfaces.
Figure 2
Figure 2
Example of synthesis procedure. Top, from left-to-right: original MRI, 6 equidistant compartments created between the white and pial surfaces, and rightmost, an image synthesized to have uniform intensity within each compartment or “layer”. Bottom: zoom to show individual surfaces.
Figure 3
Figure 3
Synthetic V1 with increased layer IV intensity in the “stria” (green arrows show end of stria).
Figure 4
Figure 4
Mahalanobis distance across the cortex, red lines indicate boundaries of synthetic stria.
Figure 5
Figure 5
Zoom on MD around left-hand and right-hand V1 boundary.
Figure 6
Figure 6
Laplace streamlines shown in region around the spike that occurs near profile 450 (cyan to left of spike, red to right of spike). The coronal view creates apparent changes in laminar intensity that are really just the result of typical cortical folding patterns.
Figure 7
Figure 7
Synthetic image with Laplace solutions between ‘white matter’ (at bottom) and CSF (top).
Figure 8
Figure 8
Change in the length of the streamlines on the vertical axis plotted against the spacing between the termination points on the horizontal. As can be seen, where the streamlines change length the most is where the sampling density is the smallest. The synthetic surfaces are spaced 128 pixels apart, so a change of 25 pixels is approximately 20%.
Figure 9
Figure 9
Example of Laplace streamline sampling artifacts in ex vivo MRI data. Top: the magnitude (Frobenius norm) of the spatial derivative of the Laplace streamline samples of a 200μm ex vivo FLASH scan of a human brain (α=20°, TR=40ms, TE=20ms). Small circular regions of high gradient magnitude can be seen in many parts of the cortex. Bottom left: zoom on region in the green box. Bottom right: axial zoom of the surfaces over the intensity volume. The arrows show the correspondence between locations in the volume and those on the surface. The yellow arrows correspond to regions of high gradients and the black to low gradients. These gradients represent a change in the streamline solution from those that cluster at the deepest point of the pial surface (shown in red) to those terminating on the banks of the sulcus instead of the fundus, by analogy with the synthetic geometry shown in Figure 7
Figure 10
Figure 10
Examples of minimizing equation (1) for various values of λ (from left to right: 0, 0.2, 0.4, 0.6, 1)
Figure 11
Figure 11
Example of vector fields after energy minimization for various values of λ (left: λ=0, right: λ=1) in a region around the central sulcus (red = sulcal, green = gyral), shown on a white matter surface. Blue arrows indicate two locations of prominent differences.
Figure 12
Figure 12
Left: magnitude of the spatial gradient (Frobenius norm) using the vector field sampling. Right: magnitude of the spatial gradient using the Laplace streamlines for sampling the synthetic volume.
Figure 13
Figure 13
Synthetic stria streamline results shown for variational (green=within stria, blue=outside of stria) and Laplace (red=within stria, magenta=outside of stria).

Similar articles

Cited by

References

    1. Allman JM, Kaas JH. A representation of the visual field in the caudal third of the middle temporal gyrus of the owl monkey (Aotus trivirgatus) Brain Research. 1971;31:85–105. - PubMed
    1. Amunts K, Kedo O, Kindler M, Pieperhoff P, Mohlberg H, Shah NJ, Habel U, Schneider F, Zilles K. Cytoarchitectonic mapping of the human amygdala, hippocampal region and entorhinal cortex: intersubject variability and probability maps. Anat Embryol (Berl) 2005;210(5–6):343–352. - PubMed
    1. Amunts K, Malikovic A, Mohlberg H, Schormann T, Zilles K. Brodmann’s areas 17 and 18 brought into stereotaxic space-where and how variable? NeuroImage. 2000;11(1):66–84. - PubMed
    1. Amunts K, Malikovic A, Mohlberg H, Schormann T, Zilles K. Brodmann’s Areas 17 and 18 Brought into Stereotaxic Space— Where and How Variable? NeuroImage. 2000;11:66–84. - PubMed
    1. Amunts K, Schleicher A, Bürgel U, Mohlberg H, Uylings HBM, Zilles K. Broca’s region revisited: Cytoarchitecture and intersubject variability. Journal of Comparative Neurology. 1999;412(2):319–341. - PubMed

MeSH terms