. 2018 Apr 2;217(4):1431-1451.
doi: 10.1083/jcb.201612177. Epub 2018 Mar 1.

Kindlin-2 regulates mesenchymal stem cell differentiation through control of YAP1/TAZ

Affiliations

Kindlin-2 regulates mesenchymal stem cell differentiation through control of YAP1/TAZ

Ling Guo et al. J Cell Biol. .

Abstract

Precise control of mesenchymal stem cell (MSC) differentiation is critical for tissue development and regeneration. We show here that kindlin-2 is a key determinant of MSC fate decision. Depletion of kindlin-2 in MSCs is sufficient to induce adipogenesis and inhibit osteogenesis in vitro and in vivo. Mechanistically, kindlin-2 regulates MSC differentiation through controlling YAP1/TAZ at both the transcript and protein levels. Kindlin-2 physically associates with myosin light-chain kinase in response to mechanical cues of cell microenvironment and intracellular signaling events and promotes myosin light-chain phosphorylation. Loss of kindlin-2 inhibits RhoA activation and reduces myosin light-chain phosphorylation, stress fiber formation, and focal adhesion assembly, resulting in increased Ser127 phosphorylation, nuclear exclusion, and ubiquitin ligase atrophin-1 interacting protein 4-mediated degradation of YAP1/TAZ. Our findings reveal a novel kindlin-2 signaling axis that senses the mechanical cues of cell microenvironment and controls MSC fate decision, and they suggest a new strategy to regulate MSC differentiation, tissue repair, and regeneration.


Figures

Figure 1.
Figure 1.
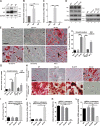
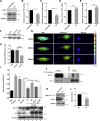
Depletion of kindlin-2 promotes MSC adipogenic differentiation and inhibits osteogenic differentiation. (A–C) hMSCs were cultured under control (Con; lane 1), osteogenic differentiation (OD; lane 2), or adipogenic differentiation (AD; lane 3) medium for 14 d. The cells were then analyzed by Western blotting with antibodies recognizing ALP, kindlin-2 (K2), and GAPDH (as a loading control; A). Protein levels of kindlin-2 relative to that of GAPDH in OD and AD medium were quantified by densitometry and compared with that in control medium (normalized to 1; mean ± SEM; n = 3; ***, P < 0.001; B). The mRNA levels of kindlin-2 in OD and AD medium were analyzed by RT-PCR and compared with those in control medium (normalized to 1). Bars represent means ± SEM; n = 3; ***, P < 0.001(C). (D–G) hMSCs were infected with control lentivirus (Sh-Con) or kindlin-2 shRNA lentivirus (Sh-K2). 2 d after the infection, the kindlin-2 shRNA lentivirus infectants were infected with a control vector lacking kindlin-2 sequence (Sh-K2+VT) or Plvx-K2, a lentiviral expression vector encoding WT kindlin-2 (Sh-K2+K2) for 3 d as described in Materials and methods. WT (WT-1), Sh-K2+VT, or Sh-K2+K2 hMSCs (as indicated in the figure) were cultured in normal culture medium for 14 d and analyzed by Western blotting with antibodies recognizing kindlin-1(K1), kindlin-2 (K2), kindlin-3 (K3), and GAPDH (as a loading control; D). Cells were stained with Oil Red O. Additionally, as a positive control WT hMSCs (WT-2) were cultured in adipogenic differentiation medium (diff. medium) for 14 d and stained with Oil Red O (E). Bar, 50 µm. The total areas of Oil Red O–positive staining per macroscopic field were quantified by using ImageJ (F). Data are means ± SEM; ***, P < 0.001 (n = 3). The mRNA levels of adipogenic markers (Ppar) in the kindlin-2 knockdown cells were analyzed by RT-PCR and compared with those of the control cells (normalized to 1; G). Data are means ± SEM; **, P < 0.01 (n = 3). (H–L) WT or infected hMSCs were cultured under adipogenic or osteogenic medium for 14 d. The cells were then stained with Oil Red O (top) or Alizarin Red S (bottom) as indicated in the figure (H). Bar, 50 µm. The total areas of Oil Red O staining per macroscopic field (I) and those of Alizarin Red S staining per macroscopic field (K) were quantified by using ImageJ. Data are means ± SEM; n = 3; ***, P < 0.001. The levels of mRNAs of adipogenic marker Ppar (J) or osteogenic marker OPG (L) in the cells were analyzed by RT-PCR and compared with those of the WT control cells (normalized to 1). Data are means ± SEM; **, P < 0.01; ***, P < 0.001 (n = 3).
Figure 2.
Figure 2.
kindlin-2 regulates osteogenesis and adipogenesis in vivo. (A and B) Total RNAs were extracted from the femur tissues of the Prx1-Cre kindlin-2fl/fl newborn mice (K2f/f P Cre+) or Cre-negative kindlin-2fl/fl (K2f/f P Cre-) newborn mice. The levels of mRNAs of osteogenic markers (Runx2, SP7, ALP, and Bglap; A) and adipogenic markers (Fabp4, Ppar, adiponectin, and Cebpa; B) in the femur tissues of the Prx1-Cre kindlin-2fl/fl newborn mice (K2f/f P Cre+) were analyzed by RT-PCR and compared with those in the femur tissues of the kindlin-2fl/fl newborn mice (K2f/f P Cre-; normalized to 1). Data are means ± SEM; **, P < 0.01 (n = 3 mice). (C–G) GPF lentivirus–infected hMSCs (GFP; lane 1), control shRNA lentivirus-infected GFP hMSCs (GFP+Sh-Con; lane 2), and kindlin-2 shRNA lentivirus infected GFP hMSCs (GFP+Sh-K2; lane 3) were transplanted into the nude mice. Proteins were extracted from the transplants and were analyzed by Western blotting with antibodies to kindlin-2 or GAPDH (as a loading control; C). Immunostaining of the transplant sections with DAPI and ALP (D) or perilipin (F) antibody was performed 4 wk after transplantation. Bars, 50 µm. The percentages of ALP-positive (E) or perilipin-positive (G) hMSCs among total hMSCs are quantified by using ImageJ. Data are means ± SEM; n = 3 mice with three or four sections per mouse; ***, P < 0.001. More than 50 cells were counted in each panel.
Figure 3.
Figure 3.
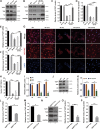
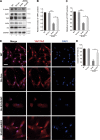
kindlin-2 regulates YAP1 and TAZ at both the transcript and protein levels. (A–H) hMSCs were infected with kindlin-2 shRNA or control lentivirus. 2 d after the infection, the kindlin-2 shRNA lentivirus infectants were transfected with a pLVX expression vector encoding kindlin-2 that is resistant to kindlin-2 shRNA lentivirus (K2) or a pLVX control vector lacking kindlin-2 coding sequence (VT). The cells were analyzed by Western blotting with antibodies as indicated (A and B). Protein levels of YAP1 (C) and TAZ (D) relative to that of GAPDH in infected cells were quantified by densitometry and compared with that of WT hMSCs (normalized to 1). Data are means ± SEM; n = 3; ***, P < 0.001. The mRNA levels of YAP1 (E) and TAZ (F) in the infected cells were analyzed by RT-PCR and compared with those in the WT cells (normalized to 1). The bars represent means ± SEM; n = 3; *, P < 0.05; **, P < 0.01. The cells were immunofluorescently stained with DAPI and YAP1/TAZ antibodies (G). Bar, 50 µm. The percentages of nuclear YAP/TAZ-positive cells among total cells were quantified (H). Data are means ± SEM; n = 3; ***, P < 0.001. At least 100 cells were counted in each experiment. (I–K) mMSCs isolated from kindlin-2fl/fl mice bone matrix were infected with Cre or Laz adenovirus. 3 d after the infection, the mRNA levels of kindlin-2, YAP1, and TAZ in the infected cells were analyzed by RT-PCR and compared with those in the WT cells (normalized to 1; I). The bars represent means ± SEM; n = 3; **, P < 0.01. The cells were analyzed by Western blotting with antibodies as indicated (J). Protein levels of YAP1 and TAZ (K) relative to that of GAPDH in infected cells were quantified by densitometry and compared with that of WT hMSCs (normalized to 1). Data are means ± SEM; n = 3; **, P < 0.01 (K). (L–P) The levels of YAP1 (L) and TAZ (M) mRNAs in the femur tissues of the kindlin-2fl/fl Prx1-Cre mice (K2f/f P Cre+) were analyzed by RT-PCR and compared with those of the Cre-negative kindlin-2fl/fl mice (K2f/f P Cre-; normalized to 1). Data are means ± SEM; **, P < 0.01; n = 3. Protein extracts from femur tissues of Cre-negative kindlin-2fl/fl mice (lane 1) and Prx1-Cre; kindlin-2fl/fl mice (lane 2) were analyzed by Western blotting with antibodies recognizing YAP1, TAZ, kindlin-2, or GAPDH (as a loading control; N). Protein levels of YAP1 (O) and TAZ (P) relative to that of GAPDH in tissues derived from the Prx1-Cre; kindlin-2fl/fl newborn mice were quantified by densitometry and compared with those from the Cre-negative kindlin-2fl/fl newborn mice (normalized to 1). The bars represent means ± SEM; n = 3; ***, P < 0.001.
Figure 4.
Figure 4.
kindlin-2 regulates MSC differentiation through control of YAP1 and TAZ. (A–D) Spontaneous adipogenic differentiation of YAP1 knockdown hMSCs. WT hMSCs (lane 1) and hMSCs infected with control (lane 2) or YAP1 shRNA (lane 3) lentivirus were analyzed by Western blotting (A). The cells (as specified in the figure) were cultured in normal culture medium for 14 d and stained with Oil Red O (B). Bar, 50 µm. The percentages of Oil Red area in each macroscopic field (C) were quantified by using ImageJ. Data are means ± SEM; n = 3; ***, P < 0.001. The mRNA levels of adipogenic markers (Ppar) in the YAP1 knockdown cells were analyzed by RT-PCR and compared with those of the control cells and WT cells (normalized to 1; D). Data are means ± SEM; **, P < 0.01; n = 3. (E–K) hMSCs were infected with kindlin-2 shRNA or control shRNA lentivirus. 2 d after the infection, cells were infected with pLVX lentiviral expression vectors encoding YAP1 or TAZ. 3 d after pLVX-YAP1/TAZ lentiviral infection, the cells were analyzed by Western blotting with antibodies recognizing YAP1, TAZ, kindlin-2, or GAPDH (as a loading control; E and F). The cells treated as above were cultured in adipogenic or osteogenic differentiation medium for 14 d and stained with Oil Red O (top) or Alizarin Red S (bottom) as indicated (G). Bars, 50 µm. The percentages of Oil Red O area (H) and Alizarin Red S area (J) in each macroscopic field were quantified by using ImageJ. Data are means ± SEM; n = 3; ***, P < 0.001. The levels of mRNAs of adipogenic marker Ppar (I) and osteogenic marker OPG (K) in the cells (as specified in the figure) were analyzed by RT-PCR and compared with those of WT cells (normalized to 1). Data are means ± SEM; ***, P < 0.001; n = 3.
Figure 5.
Figure 5.
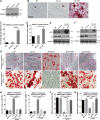
Integrin- and actin-binding are involved in kindlin-2 regulation of YAP1/TAZ. (A, B, and D–H) hMSCs were infected with kindlin-2 shRNA (Sh-K2) or control (Sh-con) lentiviruses. 2 d after infection, the cells were infected with lentiviral expression vectors encoding WT kindlin-2 (K2), the actin-binding defective LK/AA mutant (K2-LK), the integrin-binding defective QW/AA mutant (K2-QW), or a control vector lacking kindlin-2 sequence (VT) as described in the Materials and methods. 3 d later, the cells were analyzed by Western blotting (A and D), flow cytometry for integrin activation (B), or RT-PCR (G and H). Western blotting was performed with antibodies recognizing YAP1, TAZ, kindlin-2, or GAPDH (as a loading control) as indicated (A and D). Protein levels of YAP1 (E) and TAZ (F) relative to GAPDH in the infected cells were quantified by densitometry and compared with those in WT cells. Data are means ± SEM; n = 3; **, P < 0.01; ***, P < 0.001. β1 integrin activation was analyzed by flow cytometry as described in the Materials and methods (B). The bars represent means ± SEM; n = 3; **, P < 0.01; ***, P < 0.001. The mRNA levels of YAP1 (G) and TAZ (H) in the control and kindlin-2 knockdown cells or those reexpressing WT or the LK/AA mutant form of kindlin-2 were analyzed by RT-PCR and compared with those in the WT cells (normalized to 1). Data are mean ± SEM; n = 3; *, P < 0.05; **, P < 0.01. (C) GST fusion protein pulldown assay was performed by using GST-tagged kindlin-2 F0 fragment (residues 1–105), kindlin-2 F0 fragment (residues 1–105) bearing the LK47/AA mutation, or GST alone as described in the Materials and methods. Actin was detected by Western blotting with an actin antibody (top). The membrane was stained with Coomassie blue (bottom). Lane 1, hMSC lysates. Lanes 2–4, GST or GST fusion protein pulldowns. (I–M) The cells (as specified in the figure) were cultured in adipogenic or osteogenic differentiation medium for 14 d and stained with Oil Red O (I, top) or Alizarin Red S (I, bottom). Bars, 50 µm. The percentages of Oil Red O area (J) and Alizarin Red S area (L) per macroscopic field were quantified by using ImageJ. Data are means ± SEM; **, P < 0.01; ***, P < 0.001; n = 3. The levels of mRNAs of adipogenic marker Ppar (K) and osteogenic marker OPG (M) in the control, kindlin-2 knockdown cells, or kindlin-2 knockdown cells reexpressing WT or the LK/AA mutant form of kindlin-2 were analyzed by RT-PCR and compared with those in the WT cells (normalized to 1). Data are means ± SEM; *, P < 0.05; **, P < 0.01; ***, P < 0.001; n = 3.
Figure 6.
Figure 6.
kindlin-2 regulates MSC geometry, actin stress fiber, and focal adhesion formation. hMSCs were infected with kindlin-2 shRNA (Sh-K2) or control (Sh-con) lentiviruses. 2 d after infection, the cells were infected with lentiviral expression vectors encoding WT kindlin-2 (K2), the actin-binding defective LK/AA mutant (K2-LK), the integrin-binding defective QW/AA mutant (K2-QW), or a control vector lacking kindlin-2 sequence (VT) as described in the Materials and methods. 3 d later, actin stress fiber organization and focal-adhesion formation were analyzed by immunofluorescent staining of the cells with Alexa Fluor–conjugated phalloidin (topl) and vinculin antibody (bottom), respectively (A). Bars, 50 µm. Cell areas (B), shapes, defined by the lengths of the major and minor axes (C), and focal adhesion number per cell (D) were quantified by using ImageJ. Data are means ± SEM; n = 3 experiments; ***, P < 0.001. At least 50 cells were analyzed in each of the groups shown in B and D. The shapes of ∼20 cells from each of the groups were analyzed and presented in C.
Figure 7.
Figure 7.
kindlin-2 associates with MLCK in response to mechanical cues of MSC microenvironment and promotes myosin light chain phosphorylation. (A) Kindlin-2 forms a complex with MLCK. The lysates of hMSCs cultured under normal conditions were mixed with a kindlin-2 antibody or control IgG. The cell lysates (lane 1), control IgG immunoprecipitates (lane 2), kindlin-2 antibody immunoprecipitates (lane 3), or kindlin-2 antibody alone (lane 4) were analyzed by Western blotting with kindlin-2 or MLCK antibody. (B) GST-fusion protein pulldown assay was performed by using GST-tagged kindlin-2 or GST as a control. MLCK was detected by Western blotting with actin antibody (top). The membrane was stained with Coomassie blue (bottom). Lane 1, hMSC lysates. Lanes 2–5, GST or GST-fusion protein pulldowns. (C–E) hMSCs were infected with kindlin-2 shRNA or control lentivirus, cultured in normal medium for 5 d and analyzed by Western blotting with antibodies recognizing pMLC2Thr18/Ser19, MLC2, MLCK, kindlin-2, or GAPDH (as a loading control; C). The levels of MLCK (relative to GAPDH; D) and pMLC2Thr18/Ser19 (relative to total MLC2; E) in the infected hMSCs were quantified by densitometry and compared with those in the WT hMSCs (normalized to 1). The bars represent means ± SEM; n = 3; *, P < 0.05; ***, P < 0.001. (F–H) hMSCs were infected with kindlin-2 shRNA (Sh-K2) or control (Sh-con) lentiviruses. 2 d after infection, the cells were infected with lentiviral expression vectors encoding WT kindlin-2 (K2), the actin-binding defective LK/AA mutant (K2-LK), the integrin-binding defective QW/AA mutant (K2-QW), or a control vector lacking kindlin-2 sequence (VT) as described in the Materials and methods. 3 d after the lentiviral infection, the cells were analyzed by Western blotting with antibodies recognizing pMLC2Thr18/Ser19, MLC2, MLCK, kindlin-2, or GAPDH (as a loading control; F). The levels of MLCK (relative to GAPDH; G) and pMLC2Thr18/Ser19 (relative to total MLC2; H) in the infected hMSCs were quantified by densitometry and compared with those in the WT hMSCs (normalized to 1). The bars represent means ± SEM; n = 3; *, P < 0.05; **, P < 0.01; ***, P < 0.001. (I) hMSCs were plated on stiff or soft hydrogels for 4 h. The complex formation between kindlin-2 and MLCK was analyzed by coimmunoprecipitation as described in A. (J) hMSCs were plated on stiff or soft hydrogels for 2 h, 4 h, and 8 h and then analyzed by Western blotting with antibodies recognizing pMLC2Thr18/Ser19, MLC2, MLCK, kindlin-2, or GAPDH (as a loading control). The intensities of the protein bands were quantified by densitometry. The numbers indicate the levels of MLCK (relative to GAPDH) and pMLC2Thr18/Ser19 (relative to total MLC2). The experiments were repeated twice, and similar results were obtained.
Figure 8.
Figure 8.
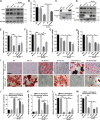
kindlin-2 regulates RhoA activation. (A–E) hMSCs were treated with (lane 2) or without (lane 1) Rho inhibitor C3 (3 µg/ml) for 24 h and analyzed by Western blotting with antibodies recognizing YAP1, TAZ, or GAPDH (as a loading control; A). The protein levels of YAP1 (B) and TAZ (C) relative to GAPDH in the C3-treated cells were quantified by densitometry and compared with those in the untreated cells (normalized to 1). The bars represent means ± SEM; n = 3; **, P < 0.01. The mRNA levels of YAP1 (D) and TAZ (E) in hMSCs treated with C3 were analyzed by RT-PCR and compared with those in the untreated cells (normalized to 1). The bars represent means ± SEM; n = 3. (F–H) hMSCs were infected with kindlin-2 shRNA lentivirus or control lentivirus. 2 d after the infection, some of the cells were analyzed by Western blotting to confirm knockdown of kindlin-2 (F). The remaining cells were infected with adenovirus encoding Clover-RhoA-RKN-Rubby. 3 d later, cells were replated onto fibronectin-coated dishes for 24 h, and RhoA activation was then analyzed by FRET with time-lapse microscopy (images were acquired for 60 min at 1-min intervals) as described in the Materials and methods. Representative FRET/Clover ratio images at the indicated time points (10, 30, and 60 min) are shown (G). Bar, 50 µm. Normalized FRET/Clover ratio of the kindlin-2 knockdown cells at 60 min was compared with that of the control infectants and WT (WT) hMSCs at the same time point. Data are means ± SEM; n = 5; **, P < 0.01(H). (I) hMSCs were infected with kindlin-2 shRNA (Sh-K2) or control (Sh-con) lentiviruses. 2 d after infection, the cells were infected with lentiviral expression vectors encoding WT kindlin-2 (K2), the actin-binding defective LK/AA mutant (K2-LK), the integrin-binding defective QW/AA mutant (K2-QW), or a control vector lacking kindlin-2 sequence (VT) as described in the Materials and methods. 3 d after the lentiviral infection, RhoA activation was measured by G-LISA. Data are mean ± SEM; n = 3; *, P < 0.05; **, P < 0.01; ***, P < 0.001 (top). Negative control (Neg), buffer blank control; positive control; RhoA-positive control were provided by the kit. Total RhoA, kindlin-2, and GAPDH (as a loading control) were analyzed by Western blot (bottom). (J) The complex formation between kindlin-2 and MLKC in C3-treated and untreated cells was analyzed by coimmunoprecipitation and Western blot with kindlin-2 and MLCK antibodies. Lanes 1 and 2, cell lysates. Lane 3, control IgG immunoprecipitates. Lanes 4 and 5, kindlin-2 immunoprecipitates. (K and L) hMSCs were treated with Rho inhibitor C3 (3 µg/ml) for 24 h and analyzed by Western blotting with antibodies recognizing pMLC2Thr18/Ser19, MLC2, or GAPDH (as a loading control; K). Protein levels of pMLC2Thr18/Ser19 relative to total MLC2 in the C3-treated cells were quantified by densitometry and compared with untreated cells (normalized to 1). The bars represent means ± SEM; n = 3; **, P < 0.01 (L).
Figure 9.
Figure 9.
kindlin-2 regulates YAP/TAZ in a Lats1-independent manner. hMSCs were infected with kindlin-2 shRNA lentivirus (sh-K2), Lats1 shRNA lentivirus (sh-Lats1), control lentivirus (sh-Con), or both sh-kindlin-2 and sh-Lats1 (sh-K2+ sh-Lats1). The cells were cultured in normal medium for 5 d and analyzed by Western blotting (A) with antibodies recognizing YAP1, p-YAP1(Ser127), or GAPDH (as a loading control). The ratios of the level of Ser127-phosphorylated YAP1 versus total YAP1 (p-YAP1(Ser127)/YAP1) in infected hMSCs were quantified by densitometry and compared with those in the WT (WT) hMSCs (normalized to 1; B). The bars represent means ± SEM; n = 3; *, P < 0.05; **, P < 0.01. The cells were analyzed by immunofluorescent staining with DAPI and YAP1/TAZ antibodies (C). Bar, 50 µm. The percentages of cells with nuclear YAP1/TAZ were quantified (D). At least 100 cells were counted in each experiment. Bars represent means ± SEM; n = 3.
Figure 10.
Figure 10.
AIP4 mediates kindlin-2 regulation of YAP1/TAZ proteins. (A–E) hMSCs were infected with kindlin-2 shRNA or control shRNA lentivirus. 2 d later, the cells were transfected with siRNA targeting AIP4 (siAIP4) or a control siRNA (siNC). 3 d after transfection, the cells were analyzed by Western blotting with antibodies recognizing p-YAP1, YAP1, TAZ, kindlin-2, AIP4, or GAPDH (as a loading control; A). Protein levels of YAP1 (B) and TAZ (C) relative to that of GAPDH in the infected cells were quantified by densitometry and compared with that of WT hMSCs (normalized to 1) by using ImageJ. The bars represent means ± SEM; n = 3; *, P < 0.05; ***, P < 0.001. The cells were immunofluorescently stained with DAPI and YAP1/TAZ antibody (D). Bar, 50 µm. The percentages of nuclear YAP/TAZ positive cells among total cells were quantified (E). Data are means ± SEM; n = 3; **, P < 0.01. At least 100 cells were counted in each experiment.

Comment in

Similar articles

Cited by

References

    1. Aoki K., and Matsuda M.. 2009. Visualization of small GTPase activity with fluorescence resonance energy transfer-based biosensors. Nat. Protoc. 4:1623–1631. 10.1038/nprot.2009.175 - DOI - PubMed
    1. Aragona M., Panciera T., Manfrin A., Giulitti S., Michielin F., Elvassore N., Dupont S., and Piccolo S.. 2013. A mechanical checkpoint controls multicellular growth through YAP/TAZ regulation by actin-processing factors. Cell. 154:1047–1059. 10.1016/j.cell.2013.07.042 - DOI - PubMed
    1. Bianco P., Riminucci M., Gronthos S., and Robey P.G.. 2001. Bone marrow stromal stem cells: nature, biology, and potential applications. Stem Cells. 19:180–192. 10.1634/stemcells.19-3-180 - DOI - PubMed
    1. Bledzka K., Bialkowska K., Sossey-Alaoui K., Vaynberg J., Pluskota E., Qin J., and Plow E.F.. 2016. Kindlin-2 directly binds actin and regulates integrin outside-in signaling. J. Cell Biol. 213:97–108. 10.1083/jcb.201501006 - DOI - PMC - PubMed
    1. Bredella M.A., Torriani M., Ghomi R.H., Thomas B.J., Brick D.J., Gerweck A.V., Rosen C.J., Klibanski A., and Miller K.K.. 2011. Vertebral bone marrow fat is positively associated with visceral fat and inversely associated with IGF-1 in obese women. Obesity (Silver Spring). 19:49–53. 10.1038/oby.2010.106 - DOI - PMC - PubMed

Publication types

MeSH terms

Substances