

Attenuation of cGAS-STING signaling is mediated by a p62/SQSTM1-dependent autophagy pathway activated by TBK1
- PMID: 29496741
- PMCID: PMC5897779
- DOI: 10.15252/embj.201797858
Attenuation of cGAS-STING signaling is mediated by a p62/SQSTM1-dependent autophagy pathway activated by TBK1
Abstract
Negative regulation of immune pathways is essential to achieve resolution of immune responses and to avoid excess inflammation. DNA stimulates type I IFN expression through the DNA sensor cGAS, the second messenger cGAMP, and the adaptor molecule STING Here, we report that STING degradation following activation of the pathway occurs through autophagy and is mediated by p62/SQSTM1, which is phosphorylated by TBK1 to direct ubiquitinated STING to autophagosomes. Degradation of STING was impaired in p62-deficient cells, which responded with elevated IFN production to foreign DNA and DNA pathogens. In the absence of p62, STING failed to traffic to autophagy-associated vesicles. Thus, DNA sensing induces the cGAS-STING pathway to activate TBK1, which phosphorylates IRF3 to induce IFN expression, but also phosphorylates p62 to stimulate STING degradation and attenuation of the response.
Keywords: STING; DNA sensing; autophagy; innate immunity; p62/SQSTM1.
© 2018 The Authors.
Figures

- A
WT and Sting gt/gt MEFs were treated with dsDNA (4 μg/ml) for the indicated time interval, and lysates were immunoblotted for STING, LC3, and β‐actin.
- B
cGas −/− mice were treated with DMXAA (500 mg/mouse) for the indicated time interval, and spleen lysates were immunoblotted for STING and β‐actin.
- C
WT and Atg3 −/− MEFs were treated with dsDNA (4 μg/ml) or 2′3′ cGAMP (4 μg/ml) for 18 h, and supernatants were harvested and analyzed for levels of CXCL10.
- D, E
Electron microscopy of glutaraldehyde‐fixed cells treated with Lipofectamine (mock) or transfected with dsDNA (4 μg/ml) for 8 h. Panel (E) represents 10× magnifications of selected areas of the DNA‐stimulated cells. Red arrowheads highlight electron‐dense vesicles in DNA‐stimulated cells. Scale bars: 2 μm (D); 250 nm (E).
- F
Stereological analysis of data shown in panels (D, E). The graph is based on quantification of at least 35 cell profiles per group.
- G
Electron microscopy of glutaraldehyde‐fixed cells transfected with dsDNA (4 μg/ml) for 8 h. Red arrowheads highlight double‐membrane characteristic for autophagosomes. Scale bar: 250 nm.
- H
Stereological analysis of data shown in panel (G). The graph is based on quantification of at least 35 cell profiles per group.
- I
WT and Ulk1/2 −/− MEFs were treated with dsDNA (4 μg/ml) for the indicated time interval, and lysates were immunoblotted for pULK1 S555, ULK, STING, and β‐actin.
- J
Control, cGAS KO, and STING KO THP1 cells were treated with dsDNA (4 μg/ml) for the indicated time interval, and lysates were immunoblotted for cGAS, STING, pTBK1, pULK1, and β‐actin.
- K
WT and Ulk1/2 −/− MEFs were treated with dsDNA (4 μg/ml) or 2′3′ cGAMP (4 μg/ml) 18 h, and supernatants were harvested and analyzed for levels of CXCL10.
- L
MEFs were transiently transfected with STING‐mCherry and LC3‐EGFP, treated with DMXAA (100 μg/ml), and imaged live with wide‐field microscopy. Representative image sequence of STING‐mCherry and LC3‐EGFP is shown as inverted contrast. Arrowheads point to LC3‐EGFP recruitment to STING‐mCherry compartments. Scale bar: 5 μm.
- M
WT and Atg3 −/− MEFs were treated with dsDNA (4 μg/ml) for the indicated time interval, and lysates were immunoblotted for STING, pTBK1, LC3, and β‐actin.

- A, B
WT MEFs were treated with 2′3′ cGAMP (4 μg/ml) or DMXAA (100 μg/ml) for the indicated time interval, and lysates were immunoblotted for STING and β‐actin.
- C
THP1 cells were treated with dsDNA (4 μg/ml) for the indicated time interval, and lysates were immunoblotted for STING, LC3, and β‐actin.
- D
Illustration of the canonical autophagy pathway. 3MA, 3‐methyladenine. BafA1, Bafilomycin A1.
- E, F
Electron microscopy of sections from glutaraldehyde‐fixed cells transfected with dsDNA (4 μg/ml) for 8 h. Panel (E) shows DNA‐stimulated lysosome‐like vesicle, and panel (F) shows two images of vesicular structures enclosed by double membrane (autophagosome) or single membrane (autophagolysosome). Scale bar: 250 nm. Arrowheads: Vesicle outer membranes.
- G
Control, cGAS KO, and STING KO THP1 cells were treated with 2′3′ cGAMP (4 μg/ml) for the indicated time interval, and lysates were immunoblotted for cGAS, STING, pULK1 and β‐actin.
- H
WT and Ulk1/2 −/− MEFs were treated with dsDNA (4 μg/ml) for the indicated time interval, and lysates were immunoblotted for pTBK1 and β‐actin.
- I
WT MEFs were treated with dsDNA (4 μg/ml) for 8 h, and stained with DAPI, anti‐STING, and anti‐LC3. Scale bar, 5 μm.
- J
MEFs were transiently transfected with STING‐mCherry and LC3‐EGFP, treated with DMXAA (100 μg/ml) and imaged live with wide‐field microscopy. Upper panel, representative image sequence of a cell at different time points after stimulation. Lower panel, representative image sequence of the boxed regions. STING‐mCherry and LC3‐EGFP are shown as inverted contrast. Time is indicated as the time in minutes after the start of image acquisition. Arrowheads point to LC3‐EGFP recruitment to STING‐mCherry compartments. Scale bars, 5 μm.
- K–M
THP1 cells were treated with MG132 (20 mM), 3MA (5 mM) or Baf1A (10 μM) 1 h prior to stimulation with dsDNA (4 μg/ml). Lysates were isolated 9 h post‐stimulation and immunoblotted for STING and β‐actin.
- N
Supernatants from the cells treated as in panel (M) were isolated and levels of CXCL10 were determined by ELISA. Data are shown in means of triplicates ± s.d.

- A, B
WT MEFs were stimulated with dsDNA (4 μg/ml). The cells were fixed 8 h later and stained with antibodies against total ubiquitin or K63‐linked ubiquitin. Scale bars: 5 μm.
- C
THP1 cells were stimulated with dsDNA (4 μg/ml) for 8 h, and lysates were immunoblotted for p62, NBR1, OPTN, and NDP52.
- D–G
WT MEFs were stimulated with dsDNA (4 μg/ml). The cells were fixed 8 h later and stained with antibodies against total p62, OPTN, NDP52, or NBR1. Scale bars: 5 μm.
- H, I
WT and p62 −/− MEFs were stimulated with dsDNA (4 μg/ml) or 2′3′ cGAMP (4 μg/ml). Total RNA and supernatants were harvested 6 and 18 h later, respectively, and levels of Ifnb and CXCL10 were measured.
- J
The RNA analyzed in panel (H) was also subjected to a wider examination of ISGs by Fluidigm. The data are presented as a heatmap with each color representing the mean of triplicate measurements.
- K
Control and p62 KO THP1 cells were stimulated with dsDNA (4 μg/ml) or 2′3′ cGAMP (4 μg/ml). Supernatants were harvested 18 h later, and levels of CXCL10 were measured.
- L, M
THP1 cells were left untreated or stimulated with dsDNA (4 μg/ml) for 4 h in the presence or absence of 3MA (5 mM). p62 was immunoprecipitated from whole‐cell lysates, and levels of STING, TBK1, and p62 in the precipitates were evaluated by immunoblotting.
- N
THP1 cells were stimulated with dsDNA (4 μg/ml) or 2′3′ cGAMP (4 μg/ml). The cells were fixed 8 h later and stained with antibodies against p62, K63‐linked ubiquitin, and STING. Scale bar: 5 μm.
- O
THP1 cells were stimulated with dsDNA (4 μg/ml) for 8 h and stained with antibodies against STING, p62, and beclin‐1. Scale bar: 5 μm.

- A
WT MEFs were stimulated with dsDNA (4 μg/ml). The cells were fixed 8 h later and stained with antibodies against K48‐linked ubiquitin. Scale bar: 5 μm. Arrow: area of clear colocalization in the stainings.
- B
Illustration of the ubiquitin‐binding selective autophagy receptors.
- C, D
WT, Nbr1 −/− , and Optn −/− MEFs were stimulated with dsDNA (4 μg/ml) or 2′3′ cGAMP (4 μg/ml). Supernatants were harvested 18 h later, and levels of CXCL10 were measured by ELISA.
- E
Lysates from DNA‐stimulated WT and Optn −/− MEFs were immunoblotted for the indicated proteins.
- F
WT and Hdac6 −/− MEFs were stimulated with dsDNA (4 μg/ml). Total RNA was harvested 6 h later, and levels of Ifnb mRNA were measured by RT–qPCR.
- G
Illustration of the localization of the target regions in the p62 gene of the two gRNAs used to generate p62 KO THP1 cells.
- H
Lysates from control THP1 and two THP1‐derived p62‐deficient cell lines generate with two different gRNAs were immunoblotted for p62, STING, TBK1, IRF3, and β‐actin.
- I
Control and p62 KO THP1 cells (gRNA#2) were stimulated with dsDNA (4 μg/ml). Supernatants were harvested 18 h later, and levels of CXCL10 were measured.
- J, K
Human foreskin fibroblasts treated with control and p62‐specific gRNA were stimulated with dsDNA (4 μg/ml) or 2′3′ cGAMP (4 μg/ml). Total RNA and supernatants were harvested 6 and 18 h later, respectively, and levels of IFNB and CXCL10 were measured. Western blots for p62 are shown to the right.
- L, M
WT and p62‐deficient MEFs and THP1 cells were stimulated with dsDNA (4 μg/ml). Supernatants were harvested at the indicated time points, and levels of CXCL10 were determined by ELISA.
- N
THP1 cells were stimulated with dsDNA (4 μg/ml) for 8 h and stained with antibodies against STING, p62, and cGAS. Scale bar: 5 μm. Arrow: area of clear colocalization in the stainings.

- A
WT and p62 KO THP1 cells were stimulated with dsDNA (4 μg/ml) for the indicated time intervals, and lysates were immunoblotted with antibodies specific for the proteins shown.
- B–E
Expression of WT p62 in p62 KO THP1 cells and p62 −/− MEFs was reconstituted using lentiviral transduction. The cells were stimulated with dsDNA (4 μg/ml) and evaluated for levels of STING in lysates and CXCL10 in the supernatants 8 and 16 h post‐treatment, respectively.
- F–H
THP1 cells were stimulated with dsDNA (4 μg/ml) for the indicated time intervals. Total, K63‐linked and K48‐linked ubiquitin was precipitated, and precipitates were immunoblotted with anti‐STING and anti‐TBK1.
- I
HEK293T cells were transduced with TRIM56, STING‐HA, and p62‐FLAG. Lysates were generated 16 h later and subjected to anti‐HA immunoprecipitation. The precipitate was immunoblotted with anti‐HA, anti‐FLAG, and anti‐ubiquitin.

- A
WT and p62 −/− MEFs cells were stimulated with dsDNA (4 μg/ml) for the indicated time intervals and lysates were immunoblotted with antibodies specific for the proteins shown.
- B, C
Control and p62‐deficient THP1 cells and MEFs were transduced with lentivirus encoding p62, and expression of p62, STING, and β‐actin was measured in lysates from the cells by immunoblotting. The p62‐deficient and p62‐rescued cells were treated with dsDNA for 9 h in panel (B) and as indicated in panel (C). Levels of STING and β‐actin in lysates from the cells were evaluated by immunoblotting.
- D
Lysates from HEK293 cells transfected for 24 h with STING and p62‐3xFLAG were immunoblotted with anti‐STING and anti‐FLAG.

- A, B
MEFs stimulated with dsDNA (4 μg/ml) or 2′3′ cGAMP (4 μg/ml) for 8 h were fixed and stained with DAPI or antibodies against STING, p62, TBK1, and LC3. Scale bar: 5 μm.
- C–E
THP1 cells were left untreated or stimulated with dsDNA for 9 h (4 μg/ml). The cells were fixed and stained with antibodies specific for (C) the ER (calnexin), (D) Golgi (GM130), or (E) ERGIC (ERGIC‐53). Scale bars: 5 μm.
- F
Electron microscopy of glutaraldehyde‐fixed MEFs transfected with dsDNA (4 μg/ml) for 8 h. Scale bar: 500 nm.
- G–I
Control and p62 KO THP1 cells were stimulated with dsDNA (4 μg/ml) for 8 h and stained with anti‐STING and DAPI as well as (G) anti‐phospho‐TBK1, (H) anti‐LC3, and (I) LAMP1. Images of the single staining are shown in Fig EV4B–D. Scale bars: 5 μm.

- A
WT MEFs stimulated with dsDNA (4 μg/ml) for 6 h were fixed and stained with antibodies against STING, p62, and ATG9a. Scale bar: 5 μm.
- B–D
Images of single stainings shown in Fig 4G–I. Scale bar: 5 μm.

- A
Control and TBK1 KO cells were stimulated with dsDNA (4 μg/ml) for the indicated time intervals, and lysates were immunoblotted with antibodies specific for the antigens shown.
- B
THP1 cells were left untreated or stimulated with DNA for 3 or 9 h (4 μg/ml). The cells were fixed and stained with antibodies specific for p62, STING, and phospho‐TBK1. Scale bar: 5 μm.
- C, D
p62 KO THP1 cells were transduced with WT p62, S403A p62, or empty vector. The cells were stimulated with dsDNA for 8 h, and levels of STING were determined by immunoblotting. Supernatants were harvested 18 h later, and levels of CXCL10 were measured by ELISA. The data in panel (D) are presented as means of two replicates ± s.d. *0.01 < P < 0.05; **0.001 < P < 0.005.
- E
Control and IRF3 KO THP1 cells were treated as in (A).
- F–H
WT, Irf3 −/−, Ifnar −/−, and Irf3 S1/S1 MEFs were stimulated with dsDNA (4 μg/ml) for the indicated time intervals, and lysates were immunoblotted with antibodies specific for the antigens shown.

- A
Control and TBK1 KO THP1 cells were stimulated with 2′3′ cGAMP (4 μg/ml) for the indicated time intervals, and lysates were immunoblotted with antibodies specific for phospho‐p62 (p‐p62), phospho‐TBK1 (pTBK1), LC3, and β‐actin.
- B, C
WT and Tbk1 −/− MEF cells were stimulated with dsDNA (4 μg/ml) or 2′3′ cGAMP (4 μg/ml) for the indicated time intervals, and lysates were immunoblotted with antibodies against p62, p‐p62, LC3, and β‐actin.
- D
WT and Tbk1 −/− MEF cells were stimulated with dsDNA (4 μg/ml) for 6 h. The cells were fixed and stained with DAPI and antibodies against STING and K63‐ubiquitin. Scale bar: 5 μm.
- E
THP1 cells were left untreated or stimulated with DNA for 3 or 9 h (4 μg/ml). The cells were fixed and stained with antibodies specific for p62, STING, and phospho‐IRF3. Scale bar: 5 μm.
- F
WT and Irf3 s1/s1 MEFs were stimulated with dsDNA (4 μg/ml) or 2′3′ cGAMP (4 μg/ml). Supernatants were harvested 18 h later, and levels of CXCL10 were measured by ELISA. Data are presented as means of three replicates ± s.d. ***P < 0.001.
- A, B
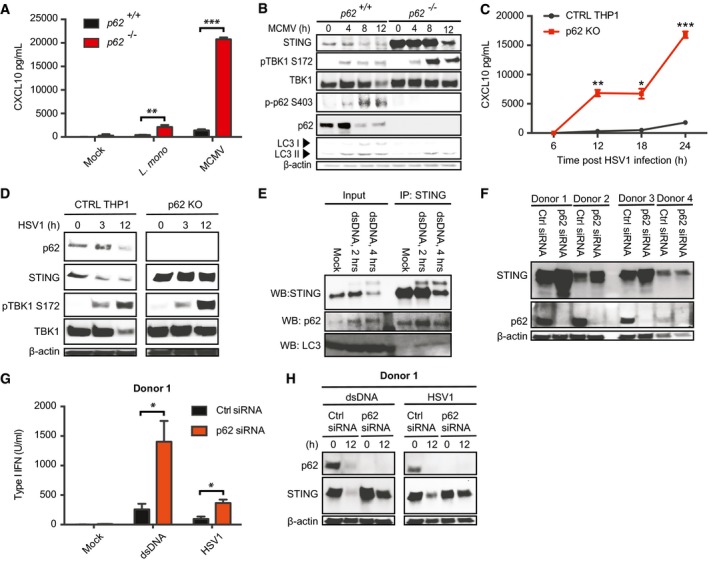
WT and p62 −/− MEFs were infected with Listeria monocytogenes (MOI 25) or MCMV (MOI 10). Supernatants were harvested 18 h post‐treatment, and lysates were isolated at the indicated time points. Supernatants were analyzed for levels of CXCL10, and lysates were immunoblotted for the indicated antigens.
- C, D
Control and p62 KO THP1 cells were infected with HSV‐1 (MOI 10) for the indicated time intervals. Supernatants were analyzed for levels of CXCL10, and lysates were immunoblotted for p62, STING, phospho‐TBK1, and β‐actin.
- E
Lysates from human monocyte‐derived macrophages transfected with dsDNA (4 μg/ml) were immunoprecipitated with anti‐STING, and immunoblotted with antibodies directed against STING, p62, and LC3.
- F–H
p62 was knocked down by siRNA in human monocyte‐derived macrophages from four donors. (F) Immunoblotting for p62 and β‐actin in lysates from the four donors. (G, H) The siRNA‐treated cells were treated with dsDNA (4 μg/ml) or infected with HSV‐1 (MOI 10). Supernatants were harvested 12 h post‐treatment, and lysates were isolated at the indicated time points. Supernatants were analyzed for levels of type I IFN, and lysates were immunoblotted for p62, STING, and β‐actin.

- A–D
WT and p62 −/− MEFs were infected with MCMV (MOI 10). Total RNA was harvested 6 h post‐treatment analyzed for expression of Cxcl10, Ifit1, Viperin, and Isg15 mRNA.
- E–G
MDMs from donor 2–4 treated with control and p62‐specific siRNA were stimulated with dsDNA (4 μg/ml) or infected with HSV1 (MOI 3). Supernatants were harvested 18 h post‐treatment, and levels of type I IFN bioactivity were measured.
References
-
- Chen M, Meng Q, Qin Y, Liang P, Tan P, He L, Zhou Y, Chen Y, Huang J, Wang RF, Cui J (2016) TRIM14 inhibits cGAS degradation mediated by selective autophagy receptor p62 to promote innate immune responses. Mol Cell 64: 105–119 - PubMed
Publication types
MeSH terms
Substances
Grants and funding
LinkOut - more resources
Full Text Sources
Other Literature Sources
Molecular Biology Databases
Research Materials
Miscellaneous
