Review
. 2018 Mar 2;359(6379):eaao0185.
doi: 10.1126/science.aao0185.

Science of science

Affiliations
Review

Science of science

Santo Fortunato et al. Science. .

Abstract

Identifying fundamental drivers of science and developing predictive models to capture its evolution are instrumental for the design of policies that can improve the scientific enterprise-for example, through enhanced career paths for scientists, better performance evaluation for organizations hosting research, discovery of novel effective funding vehicles, and even identification of promising regions along the scientific frontier. The science of science uses large-scale data on the production of science to search for universal and domain-specific patterns. Here, we review recent developments in this transdisciplinary field.


Figures

Fig. 1
Fig. 1. Growth of science
(A) Annual production of scientific articles indexed in the WoS database. (B) Growth of ideas covered by articles indexed in the WoS. This was determined by counting unique title phrases (concepts) in a fixed number of articles (4).
Fig. 2
Fig. 2. Choosing experiments to accelerate collective discovery
(A) The average efficiency rate for global strategies to discover new, publishable chemical relationships, estimated from all MEDLINE-indexed articles published in 2010. This model does not take into account differences in the difficulty or expense of particular experiments. The efficiency of a global scientific strategy is expressed by the average number of experiments performed (vertical axis) relative to the number of new, published biochemical relationships (horizontal axis), which correspond to new connections in the published network of biochemicals co-occurring in MEDLINE-indexed articles. Compared strategies include randomly choosing pairs of biochemicals, the global (“actual”) strategy inferred from all scientists publishing MEDLINE articles, and optimal strategies for discovering 50 and 100% of the network. Lower values on the vertical axis indicate more efficient strategies, showing that the actual strategy of science is suboptimal for discovering what has been published. The actual strategy is best for uncovering 13% of the chemical network, and the 50% optimal strategy is most efficient for discovering 50% of it, but neither are as good as the 100% optimal strategy for revealing the whole network. (B) The actual, estimated search process illustrated on a hypothetical network of chemical relationships, averaged from 500 simulated runs of that strategy. The strategy swarms around a few “important,” highly connected chemicals, whereas optimal strategies are much more even and less likely to “follow the crowd” in their search across the space of scientific possibilities. [Adapted from (15)]
Fig. 3
Fig. 3. Impact in scientific careers
(A) Publication record of three Nobel laureates in physics. The horizontal axis indicates the number of years after a laureate’s first publication, each circle corresponds to a research paper, and the height of the circle represents the paper’s impact, quantified by c10, the number of citations after 10 years. The highest-impact paper of a laureate is denoted with an orange circle. (B) Histogram of the occurrence of the highest-impact paper in a scientist’s sequence of publications, calculated for 10,000 scientists. The flatness of the histogram indicates that the highest-impact work can be, with the same probability, anywhere in the sequence of papers published by a scientist (49).
Fig. 4
Fig. 4. Size and impact of teams
Mean team size has been steadily growing over the past century. The red dashed curves represent the mean number of coauthors over all papers; the black curves consider just those papers receiving more citations than the average for the field. Black curves are systematically above the dashed red ones, meaning that high-impact work is more likely to be produced by large teams than by small ones. Each panel corresponds to one of the three main disciplinary groups of papers indexed in the WoS: (A) science and engineering, (B) social sciences, and (C) arts and humanities.
Fig. 5
Fig. 5. Universality in citation dynamics
(A) The citation distributions of papers published in the same discipline and year lie on the same curve for most disciplines, if the raw number of citations c of each paper is divided by the average number of citations c0 over all papers in that discipline and year. The dashed line is a lognormal fit. [Adapted from (69)] (B) Citation history of four papers published in Physical Review in 1964, selected for their distinct dynamics, displaying a “jump-decay” pattern (blue), experiencing a delayed peak (magenta), attracting a constant number of citations over time (green), or acquiring an increasing number of citations each year (red). (C) Citations of an individual paper are determined by three parameters: fitness λi, immediacy μi, and longevity σi. By rescaling the citation history of each paper in (B) by the appropriate (λ, μ, σ) parameters, the four papers collapse onto a single universal function, which is the same for all disciplines. [Adapted from (77)]

Comment in

References

    1. Garfield E. Citation indexes for science; a new dimension in documentation through association of ideas. Science. 1955;122:108–111. doi: 10.1126/science.122.3159.108. - DOI - PubMed
    1. Price DJS. Little Science, Big Science. Columbia Univ Press; 1963.
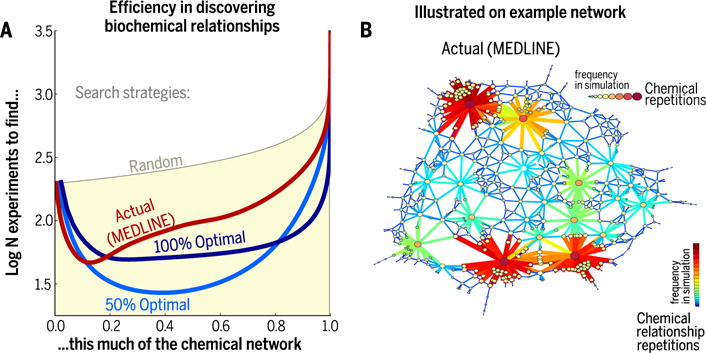
    1. Foster JG, Rzhetsky A, Evans JA. Tradition and innovation in scientists’ research strategies. Am Sociol Rev. 2015;80:875–908. doi: 10.1177/0003122415601618. - DOI
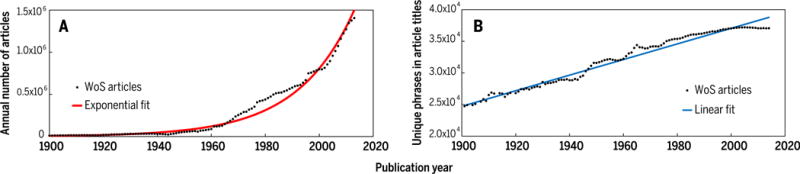
    1. Milojević S. Quantifying the cognitive extent of science. J Informetr. 2015;9:962–973. doi: 10.1016/j.joi.2015.10.005. - DOI
    1. Kuhn T, Perc M, Helbing D. Inheritance patterns in citation networks reveal scientific memes. Phys Rev X. 2014;4:041036. doi: 10.1103/PhysRevX.4.041036. - DOI

Publication types