. 2018 May 1;29(9):1031-1047.
doi: 10.1091/mbc.E17-10-0577.

Quantitative proteomic and phosphoproteomic comparison of human colon cancer DLD-1 cells differing in ploidy and chromosome stability

Affiliations

Quantitative proteomic and phosphoproteomic comparison of human colon cancer DLD-1 cells differing in ploidy and chromosome stability

Cristina Viganó et al. Mol Biol Cell. .

Abstract

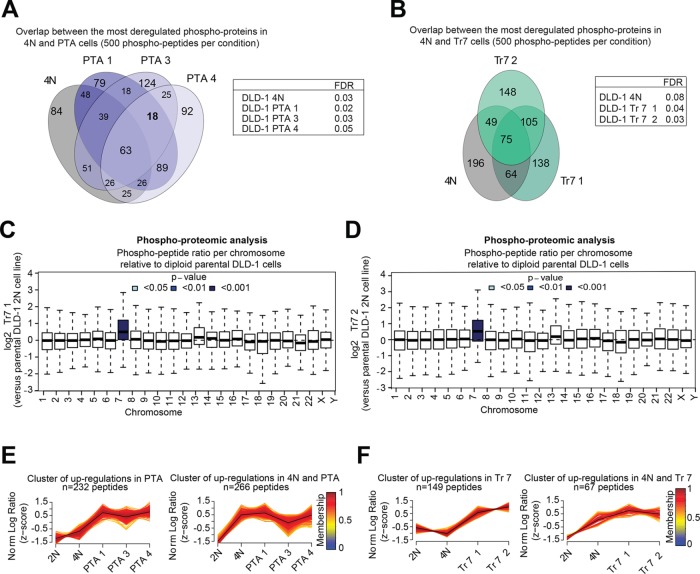
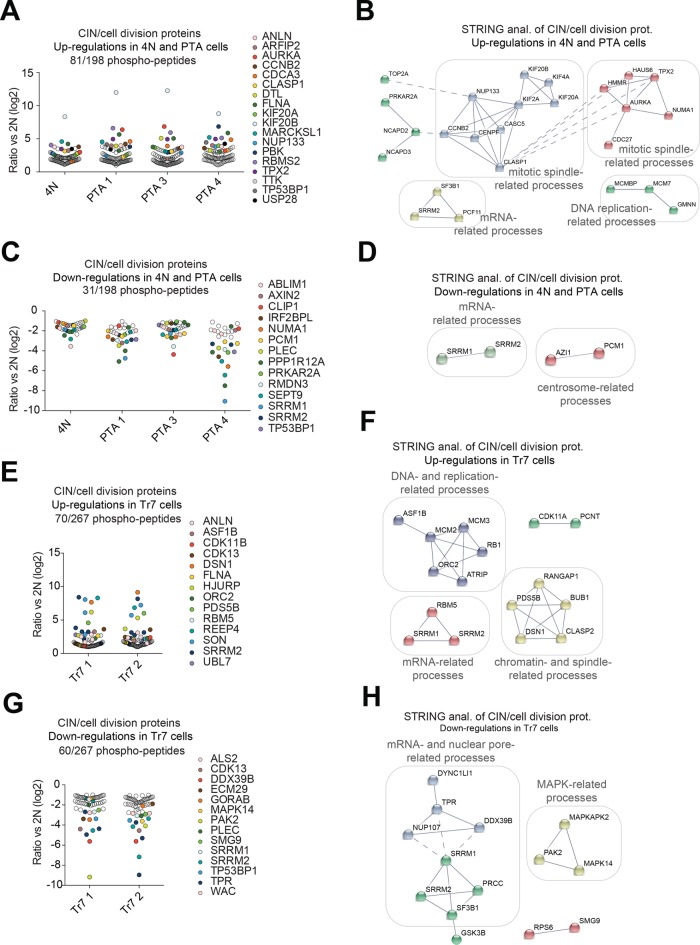
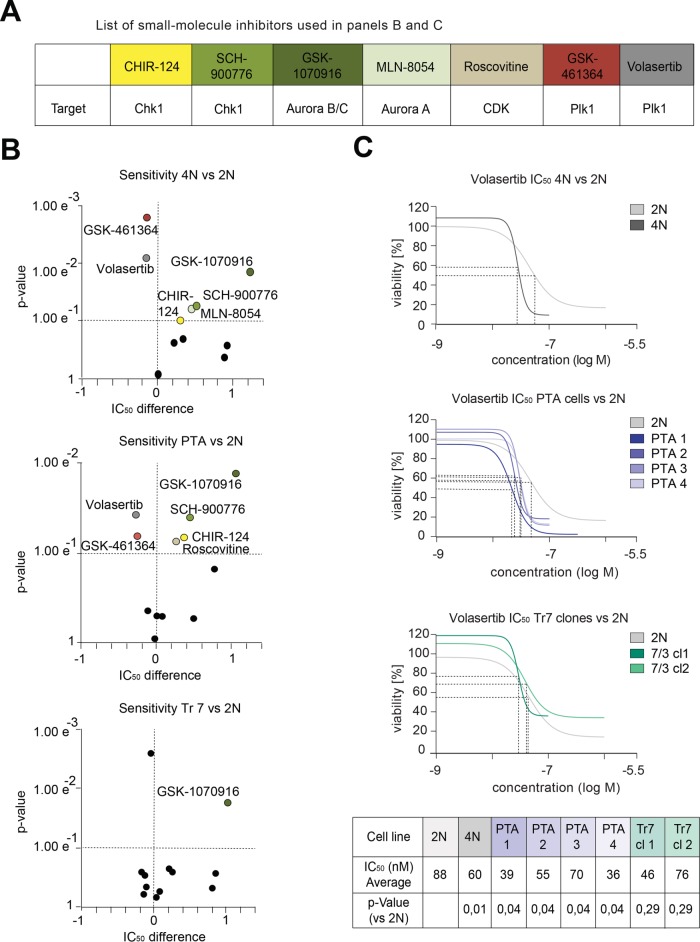
Although aneuploidy is poorly tolerated during embryogenesis, aneuploidy and whole chromosomal instability (CIN) are common hallmarks of cancer, raising the question of how cancer cells can thrive in spite of chromosome aberrations. Here we present a comprehensive and quantitative proteomics analysis of isogenic DLD-1 colorectal adenocarcinoma cells lines, aimed at identifying cellular responses to changes in ploidy and/or CIN. Specifically, we compared diploid (2N) and tetraploid (4N) cells with posttetraploid aneuploid (PTA) clones and engineered trisomic clones. Our study provides a comparative data set on the proteomes and phosphoproteomes of the above cell lines, comprising several thousand proteins and phosphopeptides. In comparison to the parental 2N line, we observed changes in proteins associated with stress responses and with interferon signaling. Although we did not detect a conspicuous protein signature associated with CIN, we observed many changes in phosphopeptides that relate to fundamental cellular processes, including mitotic progression and spindle function. Most importantly, we found that most changes detectable in PTA cells were already present in the 4N progenitor line. This suggests that activation of mitotic pathways through hyper-phosphorylation likely constitutes an important response to chromosomal burden. In line with this conclusion, cells with extensive chromosome gains showed differential sensitivity toward a number of inhibitors targeting cell cycle kinases, suggesting that the efficacy of anti-mitotic drugs may depend on the karyotype of cancer cells.


Figures

FIGURE 1:
FIGURE 1:
Establishment of DLD-1–derived lines differing in ploidy. (A) Schematic summarizing the generation, properties, and analysis of DLD-1 colon cancer cell lines. Starting from a diploid (2N) parental culture, tetraploid (4N) cells were obtained by inhibition of cytokinesis. The 4N cells were then used for clonal isolation of posttetraploid aneuploid (PTA) descendants. Clones harboring trisomies of chromosome 7 (Tr7) were generated from the diploid parental culture by microcell-mediated chromosome transfer. (B) Histograms document the DNA profiles of the cell lines used in this study. Cells were stained with propidium iodine and subjected to analysis by flow cytometry. Dotted lines indicate the G1 and G2/M peaks expected for the diploid culture. (C) Top panel: micrographs depict mitotic spreads of the indicated cell lines; chromosomes were stained with DAPI. Bottom panel: histograms show chromosome numbers for each cell line, with bars and numbers indicating mean values; at least 40 cells were counted for each line. Data represent results from three biological replicates. Scale bar denotes 10 μm.
FIGURE 2:
FIGURE 2:
Mitotic properties of DLD-1–derived cells. (A) Analysis of chromosome segregation fidelity. Top panel: representative images illustrate chromosome missegregation events and micronucleation. Scale bar represents 5 μm. Right panel: histograms show the frequency of the above phenotypes in the indicated cell lines. (B) Left panel: micrographs show mitotic spreads of the indicated cell lines, with arrows pointing at structural chromosome aberrations (enlarged in insets). Scale bar represents 10 μm. Right panel: histogram shows the frequency of chromosome structural aberrations observed in the indicated cell lines. (C) Mitotic duration and cell fate in DLD-1–derived cells. Left panel: schematic summarizes cell fate analysis by time-lapse microscopy, using asynchronously growing cultures stably expressing GFP-tagged histone H2B. Dashed lines indicate mean mitotic duration. Frequencies of cell fates are shown to the right of each histogram. All fixed cells were stained with DAPI. Error bars in A and B show SD, and numbers of counted cells are indicated. Data represented in A and B result from three biological replicates; data in C from two biological replicates. Two-tailed t test: *p < 0.05, **p < 0.01, ***p < 0.001, and ****p < 0.0001.
FIGURE 3:
FIGURE 3:
Comparison of chromosome copy number and protein expression. (A) Comparative genomic hybridization assay shows chromosome copy number changes for the indicated cell lines and chromosomes, relative to a generic diploid (2N) reference line. Copy number variations that remained largely unchanged in all cell cultures are highlighted in yellow, and individual variations are highlighted in red. (B) LC-MS/MS analysis using the TMT labeling approach. Box-whisker plots show protein abundance relative to the parental diploid (2N) DLD-1 culture for the indicated lines. Proteins are ordered by chromosome origin, and blue shading indicates the level of significance. Data in B are from three biological replicates.
FIGURE 4:
FIGURE 4:
Comparative proteomic analysis of DLD-1–derived cells. (A, B) Left panels: Venn diagrams represent the numbers of shared protein deregulated across the indicated cell lines. Results were obtained by selecting the 300 most deregulated proteins per cell line (based on a false discovery rate [FDR] of <10%). Right panels: tables listing the FDR for each cell line. (C) Listing of the 11 proteins commonly deregulated across tetraploid and PTA clones, as shown in B. Asterisk demarks the single protein found to be deregulated specifically to PTA clones only, as shown in B. Shaded area highlights proteins involved in type I interferon signaling. (D) STRING functional network analysis of the 11 proteins commonly deregulated in 4N and PTA clones, as shown in B and C. Nodal connections are based on a confidence value of 0.9, using experimental and database evidence. (E) Box-whisker plots show the relative abundance of proteins involved in type I interferon signaling across microsatellite instable (MIN) and chromosomally instable (CIN) cell lines. The graph is based on experimental data shown in Supplemental Figure S1, A and B, and Supplemental Table S1. Data in E are from a single biological replicate (pilot experiment).
FIGURE 5:
FIGURE 5:
Comparative phosphoproteomic analysis of DLD-1–derived cells. (A, B) Left panel: Venn diagrams represent the number of shared protein deregulations across the indicated cell lines (with each protein showing at least one deregulated phosphopeptide). Results were obtained by selecting the 500 most deregulated phosphopeptides per cell line (FDR of <10%, yielding a total of 1410 phosphopeptides from 807 proteins). Right panel: table listing the FDR for analyzed cell lines. (C, D) The box-whisker plots show the distribution of phosphopeptide abundances of the two trisomy 7 clones relative to the parental diploid (2N) DLD-1, per chromosome. Each box spans the interquartile range. The notches extend to the most extreme data point, which is no more than 1.5 times the interquartile range from the box. The thick horizontal line in each box show the median. The color coding indicates two-sided Student’s t test p value significance, testing the probability of observing a mean log2 ratio at least large as the one observed by chance alone. Data are from three biological replicates (Supplemental Table S4, gray columns). (E, F) Cluster analysis of the data presented in A and B using the fuzzy C-means algorithm “MFuzz.” Depicted clusters show phosphopeptide up-regulations common to PTA (left graph) or 4N and PTA (right graph) clones. Log2 ratios were normalized to yield a SD of 1 and a mean of 0 (z-score). Black lines indicate the optimal membership of 1; color-coding represents cluster membership values. Note that clusters were formed based on peptides that showed significant deregulation in at least one condition; statistical significance for all peptides is given in Supplemental Table S6.
FIGURE 6:
FIGURE 6:
Targeted analysis of protein phosphorylation in DLD-1–derived cells. (A, C, E, G) Dot plots showing the phosphopeptide ratios (versus parental 2N cells) of detected proteins belonging to the CIN/cell division inclusion list and showing at least twofold deregulation. Dots represent significant (p ≤ 0.05) phosphopeptide log2 ratios. Proteins related to mitotic spindle regulation and chromosome segregation are shown in bold. (B, D, F, H) STRING functional network analysis of the data shown in A, C, E, and G. Nodal connections are based on a confidence value of 0.9 using experimental and database evidence. Solid lines indicate intranetwork and dashed lines internetwork connections.
FIGURE 7:
FIGURE 7:
Drug sensitivity assays in cultures of DLD-1–derived cells. (A) Table shows the small molecule inhibitors and their kinase targets, used in B and C. (B) Dot plots show the sensitivities (significance determined by unpaired two-tailed t test) on the y-axes and the IC50 differences (log ratios relative to the parental 2N DLD-1 cell line) on the x-axes, as observed after adding compounds to the indicated cell cultures. Dashed lines demark the quadrants of significant increases in sensitivity (top left), significant decreases in sensitivity (top right), and insignificant changes of IC50 values (bottom quadrants). Data in B are from three biological replicates. (C) Graphs show dose–response curves using the Plk1 inhibitor Volasertib on the indicated cell cultures. Dashed lines indicate IC50 values. Table lists IC50 averages from three biological replicates (see Supplemental Table S7) and p values for the indicated cell lines (unpaired two-tailed t test).

References

    1. Abaza A, Soleilhac J-M, Westendorf J, Piel M, Crevel I, Roux A, Pirollet F. (2003). M phase phosphoprotein 1 is a human plus-end-directed kinesin-related protein required for cytokinesis. J Biol Chem , 27844–27852. - PMC - PubMed
    1. Adams ND, Adams JL, Burgess JL, Chaudhari AM, Copeland RA, Donatelli CA, Drewry DH, Fisher KE, Hamajima T, Hardwicke MA, et al (2010). Discovery of GSK1070916, a potent and selective inhibitor of aurora B/C kinase. J Med Chem , 3973–4001. - PubMed
    1. Ahrné E, Glatter T, Viganó C, Schubert CV, Nigg EA, Schmidt A. (2016). Evaluation and improvement of quantification accuracy in isobaric mass tag-based protein quantification experiments. J Proteome Res , 2537–2547. - PubMed
    1. Alexa A, Rahnenfuhrer J, Lengauer T. (2006). Improved scoring of functional groups from gene expression data by decorrelating GO graph structure. Bioinformatics , 1600–1607. - PubMed
    1. Alvaro D, Sunjevaric I, Reid RJD, Lisby M, Stillman DJ, Rothstein R. (2006). Systematic hybrid LOH: a new method to reduce false positives and negatives during screening of yeast gene deletion libraries. Yeast , 1097–1106. - PubMed

Publication types

LinkOut - more resources